
AXS
Axie Infinity
| تریدر | نوع سیگنال | حد سود/ضرر | زمان انتشار | مشاهده پیام |
|---|---|---|---|---|
No results found. | ||||
Price Chart of Axie Infinity
سود 3 Months :
سیگنالهای Axie Infinity
Filter
Sort messages by
Trader Type
Time Frame

TheGemHunter
Can AXS Recover?
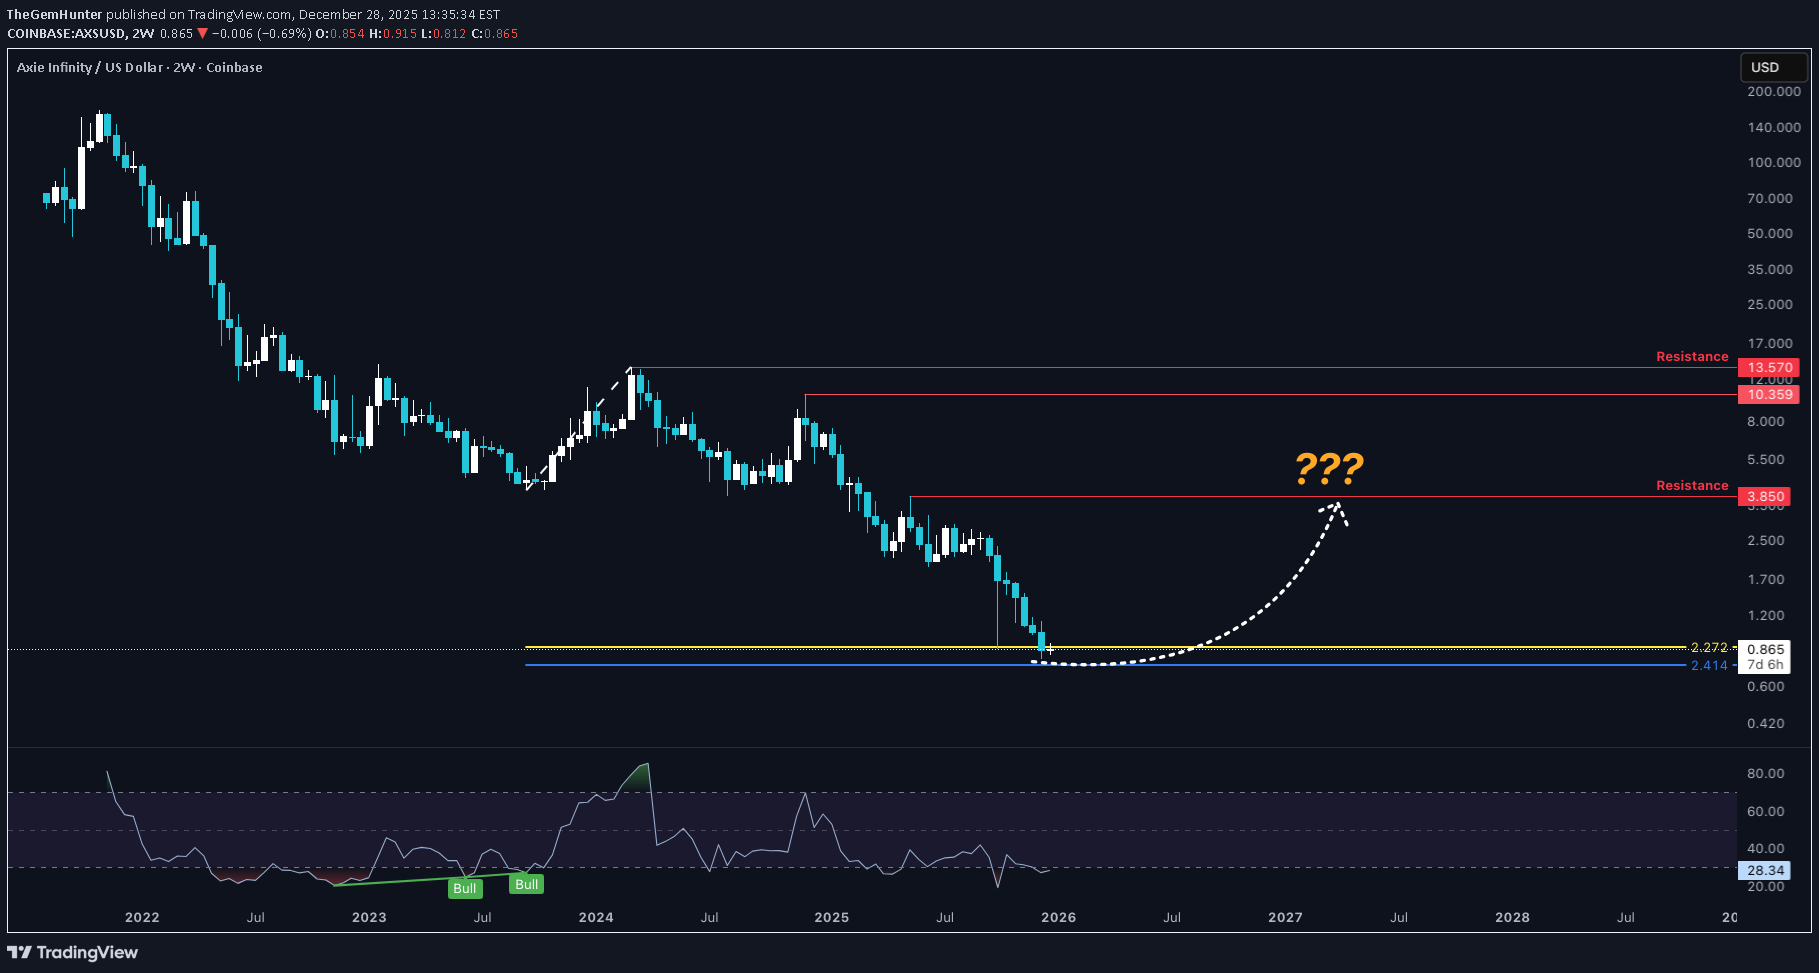
AXS has been on a downtrend for some years, but could this be the area of accumulation? Price currently in a 2.272 window, which price has tagged before in the past, making a quick liquidity sweep. RSI Bullish Divergence is printing. On a LTF price made a slightly lower low off of a minor wave 2.272; an ideal place for a Secondary Test where price "checks the floor". 👇👇👇 If this area does turn out to be the floor, signs of accumulation will show and Automatic Rallies to the upside will occur. -Not Financial Advice-

miladchikol
miladchikol
miladchikol

CryptoYodaX
سیگنال صعودی AXS: آیا کف حمایتی ترکید؟ فرصت خرید پنهان در کانال نزولی!
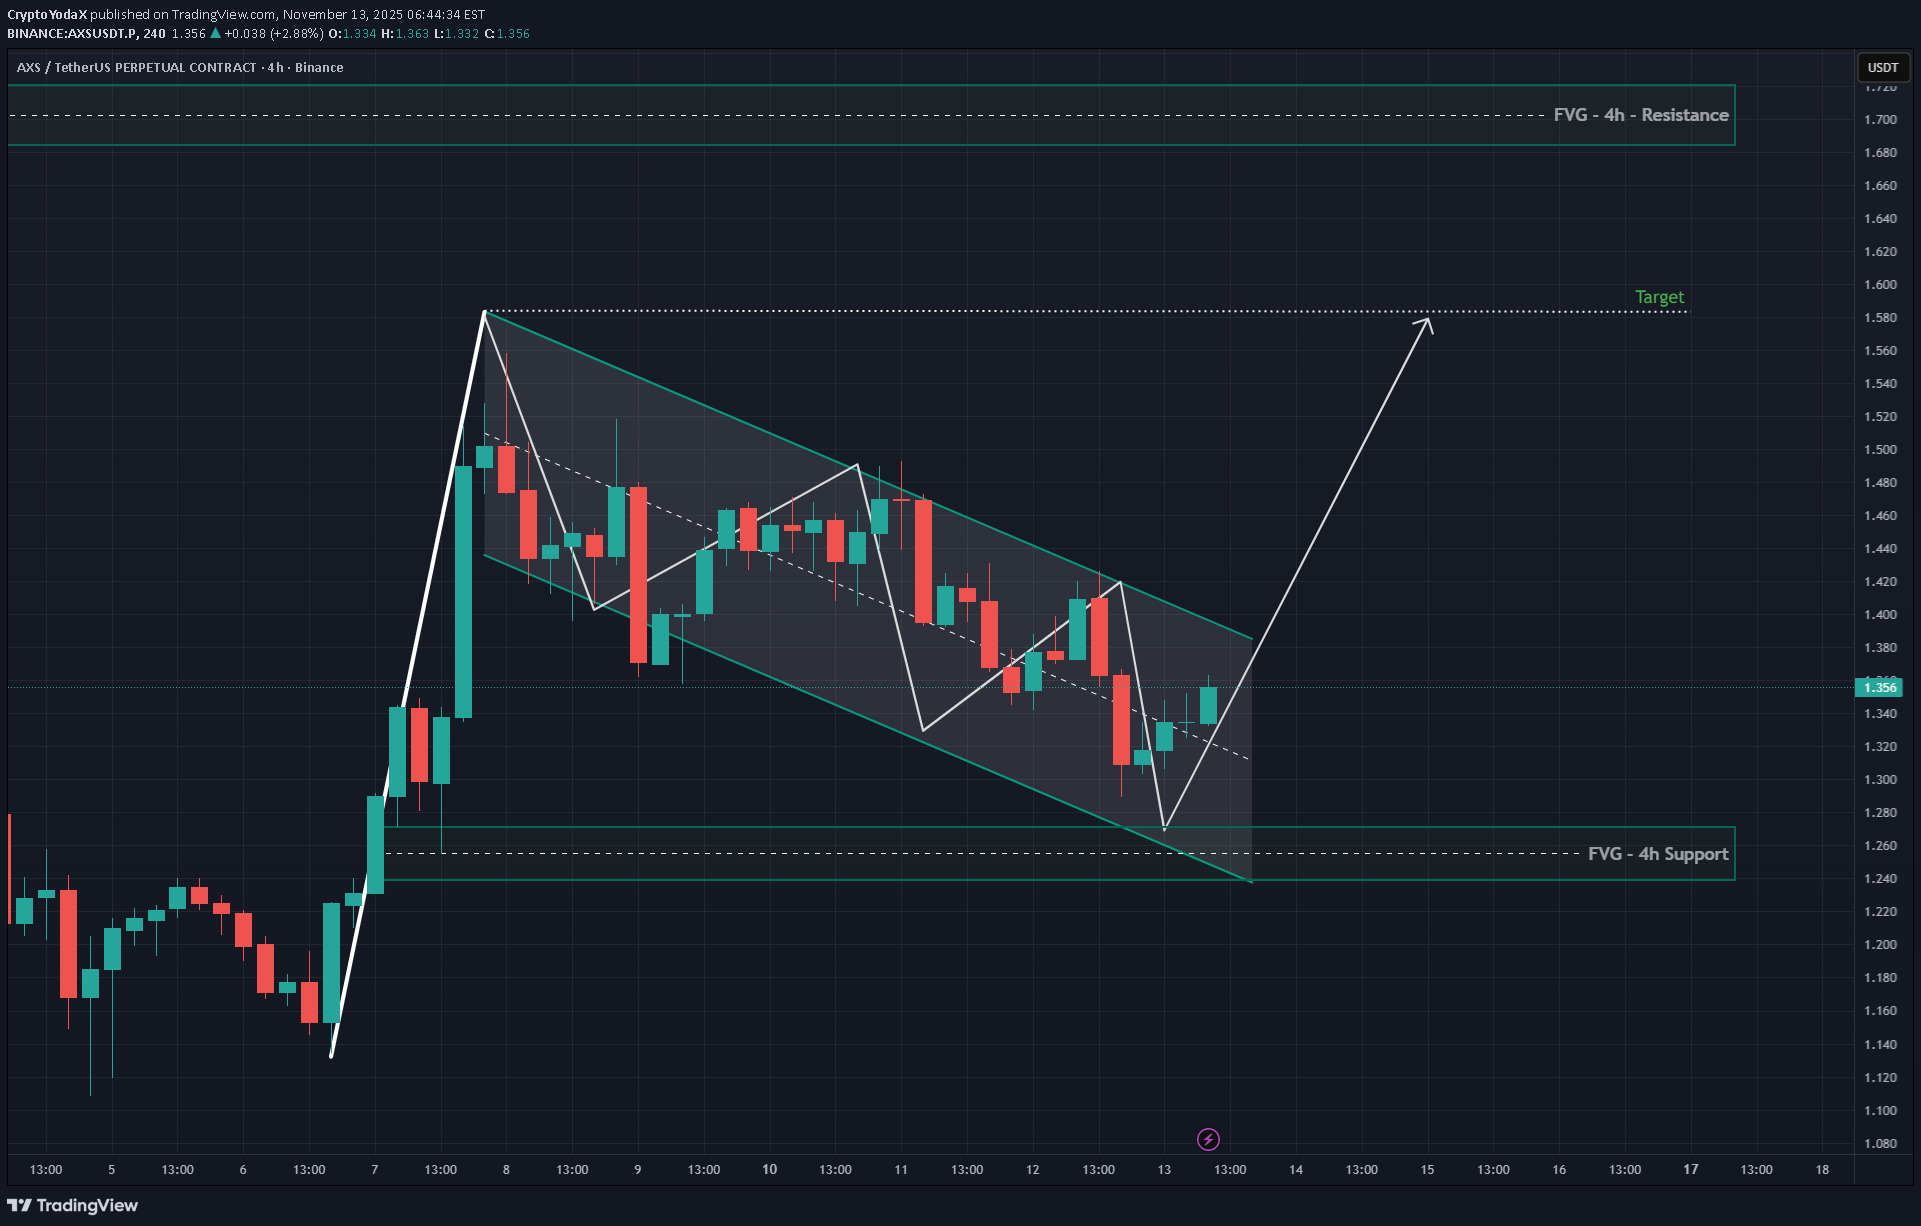
AXS 4H chart showing a falling channel structure, price just bounced perfectly from the 4h FVG support zone. A potential bullish breakout could target the $1.58 area, aligning with the upper channel and 4h resistance zone. Looks like smart money accumulation in progress. #AXSUSDT #Crypto #YodaXCalls
miladchikol

MMBTtrader
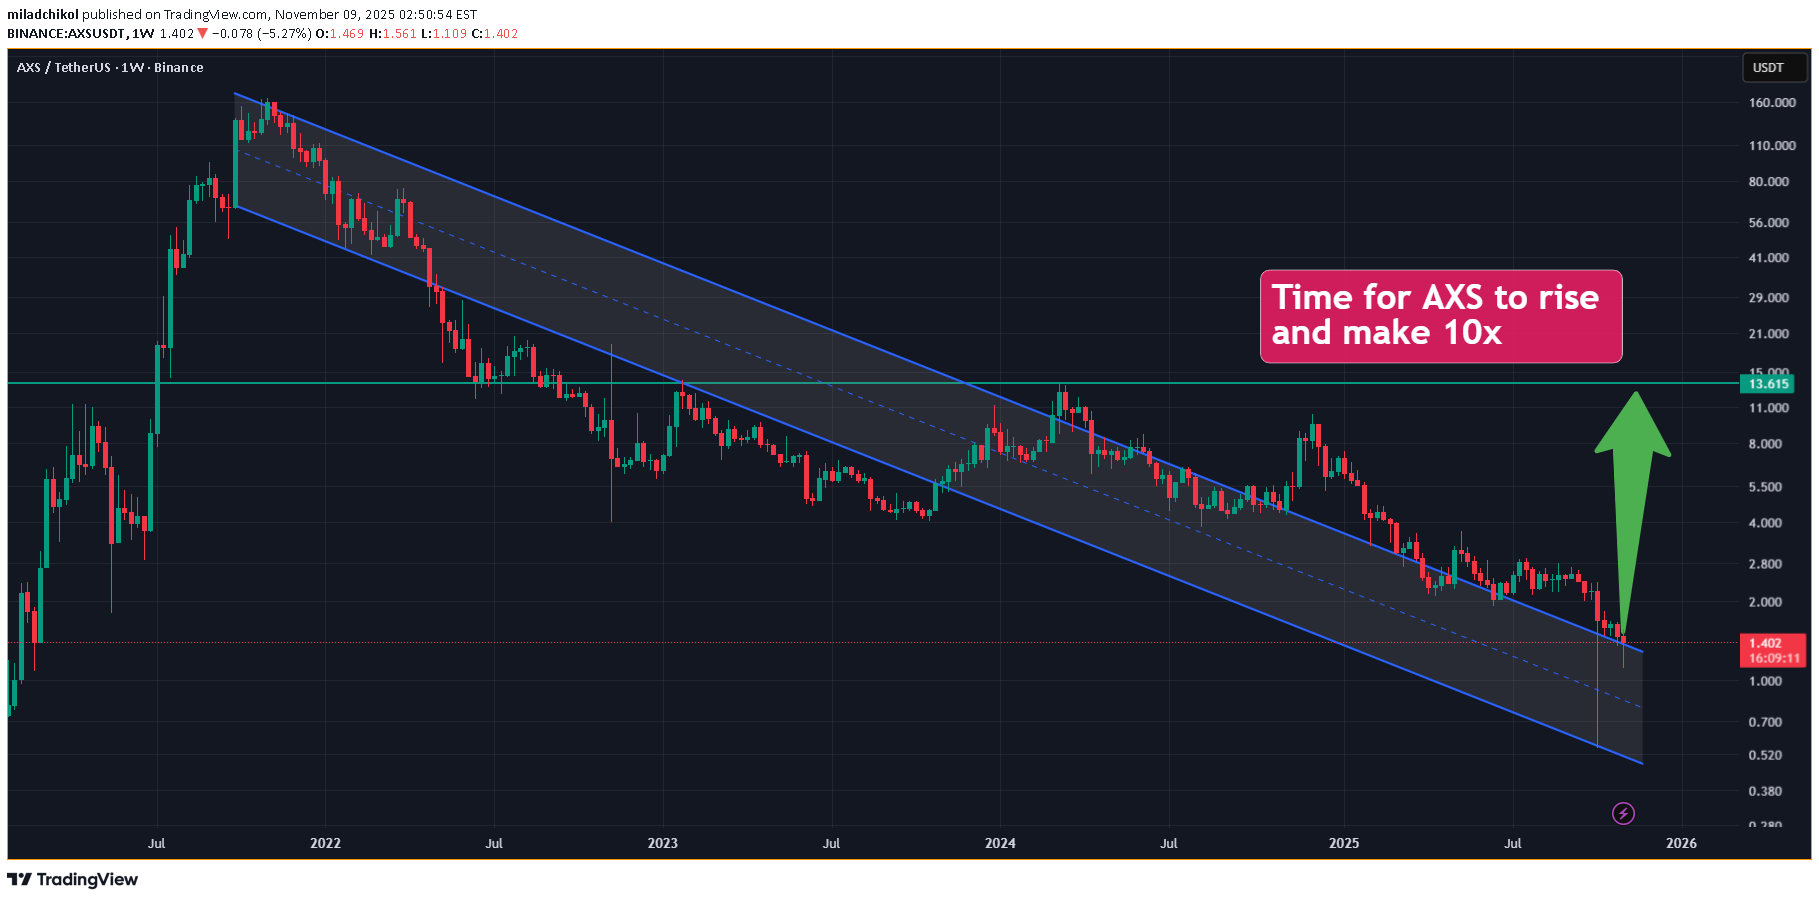
سرمایهگذاری انفجاری: آیا AXS و SLP آماده جهش ۱۰ برابری هستند؟
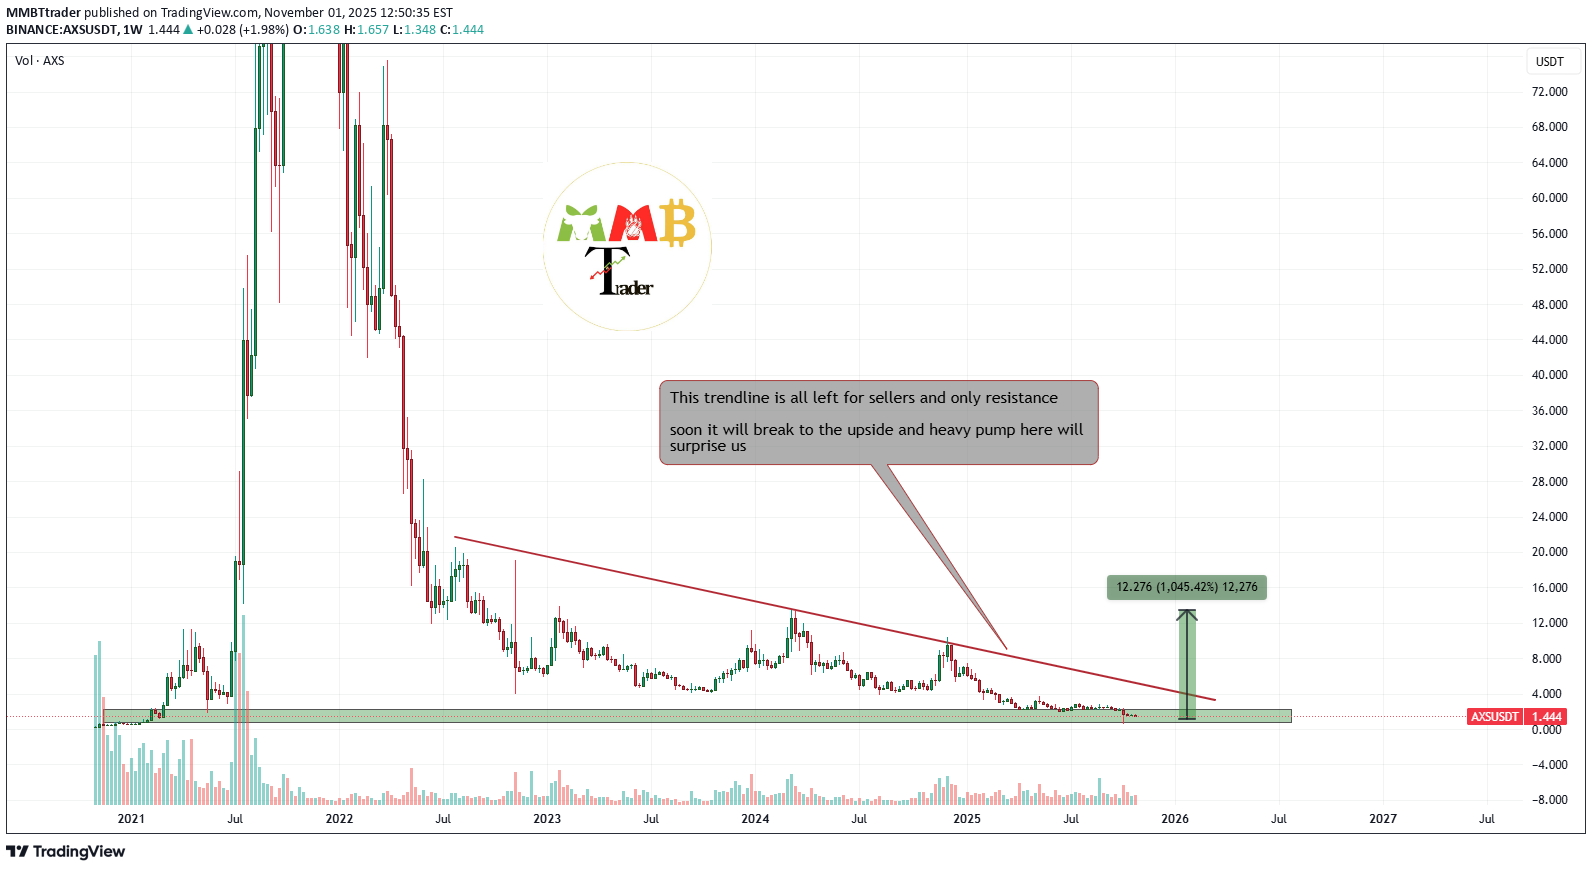
Both AXS and SLP are fundamentally robust tokens with strong interlinked utilities. From a technical perspective, they are currently trading at a historically significant support zone, suggesting a potential market bottom. This convergence of positive fundamentals and oversold technical conditions presents a compelling case for a substantial upward revaluation. A significant price appreciation, potentially reaching a 10X return, is a plausible scenario upon a market resurgence.
DISCLAIMER: ((trade based on your own decision))
<

crypto_profile
تحلیل جامع: آیا بازار گاوی ارزهای دیجیتال در راه است یا فریب میخوریم؟
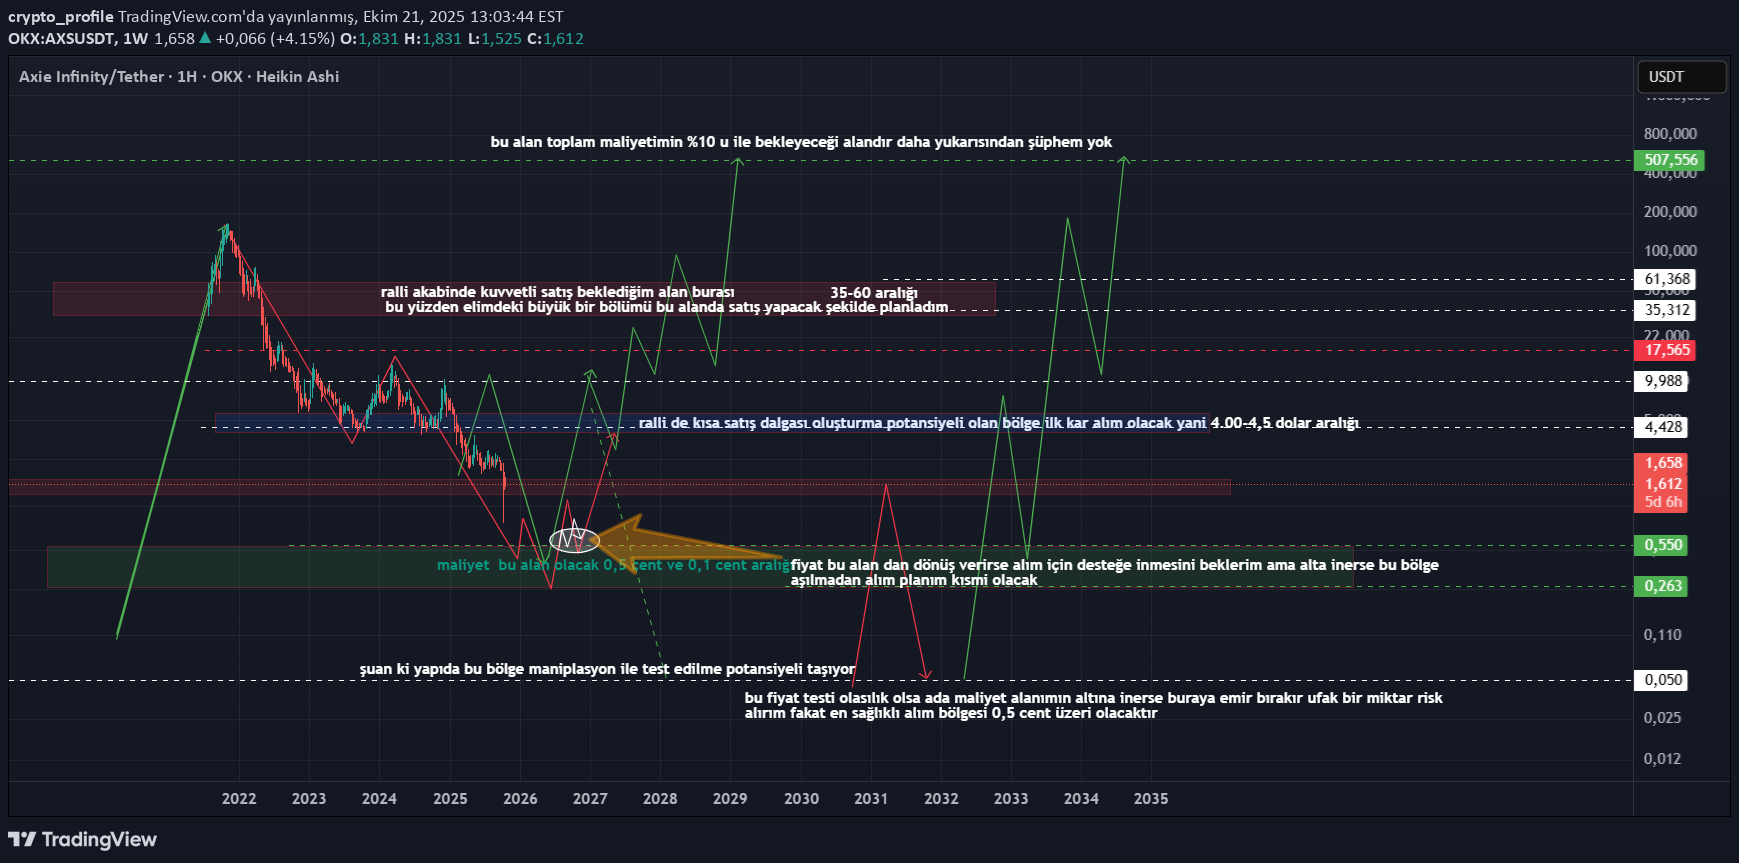
ARKADAŞLAR öncelikle boğa gelmiş diyebilmek için fiyatın 1-2 ay içerisinde 4-5 dolar aralığını geçmesi gerekiyor yada düzeltme ile baskının sona erip sert tepkiler vermesi gerekiyor bu yüzden boğaya girdik yada giriyoruz diyenlere katılmıyorum ama görüşlerine saygı duyuyorum herkesin bakış açısı gerçekçi gördüğü senaryolara dayanmaktadır. şimdi sadece grafiklerle ikna olamayan ama sürekli laf atan arkadaşlar var bu yüzden bu analizi oldukça açıklaycı ve temel sebeplere dayandırarak sunmak istiyorum bu üründe düşüş beklentim devam ediyor bununla beraber şubat ayı veya sonrası boğanın başlayacağını eğer başlamaz ise temmuz ağustos ayına kalacağını bu durumda cripto piyasasının eski döngüsüne geçebileceğini şimdiden belirteyim yani 1 yıl yükseliş sonra düzeltme ve toparlanma sonra maniplasyon yükselişi ve ayıya kafadan giriş ama şimdilik bu durum sadece senaryo olarak kalıyor bunu bize ya şubat yada ağustos temmuz ayları gösterecek. şimdi müsadenizle nalize geçiyorum . 1-total market şimdilik 3.2t altına inmediği sürece sorun yok fakat 4.5t de doyum bölgesidir daha kısa zaman aralığında ise 4t dolar hem psikolojık hemde kurumsal satış alanıdır bu sebeple şuan karar aşamasında olduğunu görebilriz 2-usdt.d 4.2 de sağlam bir alan var bu alan grafik okumayı bilen arkadaşların da farkedeceği gibi 2020 ekim ayından beri sürekli çalışmakta olan bir bölgedir kırılımı ile 2 yönlüde sert hareketler gelmiş ve maalesef bu defa üste kırmış ve teste iniyor buda birçok tüccaarın satış eğilimşnde olduğu anlamına geliyor ki usdt.d yükselişi mal satışlarını verir ve tether tarafında artışı verir ve 5,02 lik alan haftalık bazda ilk direnç olduğu için tepki vermiş olsa da düzeltme değil diyebilmemiz için dönüşünü izlemek gerekiyor 3-btc.d ve bence altların kaderini belirleyen son dönemin favori endeksi geniş ölçekli bakılmadığı sürece soz zamanlarda hırpalayacı bir endex olmuştur şimdi ilk kırılması gereken alanın 53,8-57,7 aralığı olduğunu ve hatta anahtar bölge olduğunu kesinlikle söyleyebilirim ve alan akybı gelmediği sürece 71-77 alan testi için gerekli zeminin oluştuğunu söyleyebilirm 4-others.d tarafından bakalım bu seferde 6 ekim tarihinde yukarı yönlü test vermiş görünüyor buda 10 bölgesini aşamayan bu endexin satış yönlü hareketinin devamı anlamına gelmektedir ve derin bir satış ile bunu test etti şimdi bunu söylerken aslın da haberlerin süreci hızlandırdığı fikrinde olduğumu bilmeyen bazı eleştirmen arkadaşların sahneye çıkacağını görebiliyorum neyse konumuza dönelim 5,57-6,16 aralığı kaybedilirse 3,40 kadar düşüş beklerim yani pozitif herhangi bir emare yok bunlar endexler tarafından analizdi total2 ve 3 bakmaya değecek durum da değiller çünkü direnç alanına ulaşmışlar şimdi işin temel boyutunu inceleyelim a-kripto piyasası hisse senetleri ve hatta altın ve gümüş bu ürünler küresel de gelen ekonomik krizde satış baskısı alır sebebi riskli varlık olmalarıdır büyük yatırımcılar bu dönemlede parasını devlet tahvilleri ve faize yönlendirmektedir bu faizler de hala yüksekkken kimsenin buralardan parasını çekmeye cesaret edemediğini bunun için en az 1-2 seneye daha ihtiyaç olduğunu söyleyebilirm b-faiz konusu birçok kişinin gözden kaçırdığı ama ekonominin temelini oluşturan bir konudur kısaca faizlerin devletlerin paraya ihtiyacı olduğu sürece yüksek olduğunu zaten biliyoruz işte tam da bu yüzden devletler ekonomik darboğazı geçene kadar ihtiyacı olan parayı toplamak için faiz ve tahvillere yönelirler kabaca açıklaması bu ve piyasa ekonomisine yön veren FED de dillendirdi ki henüz indirimler için erken hala ekonomik kriz 2028 ekadar sürebilir yani kemer sıkma politikaları birkaç sene daha devam edebilir unutmayın bütün savaşlar kaynak eksikliğinden doğmuştur.devletlerin paraya ihtiyacı olduğu bu süreçte paranın dijital varlıllara akıyor olması bu alana bir savaş açmaya kadar gider ama herkes de biliyorki yüksek vergi potansiyeli olan bu alana şimdilik doğrudan müdahale yok ve mevcut volatil risklerden dolayı yatırımcının uzak durduğu bir alan olmasına rağmen içeri de 4t dolar gibi bir hacim var sorun paranın olması değil paranın kimin cebinde olduğunun bilinmemesi c-abd nin elinde bulundurduğu yüksek miktarda btc nin satışı için sürekli bir tasarı oluşturuluyor buda volatil piyasanın haberlerle panik satışı yapmasına yetiyor d-açılmayı bekleyen yüksek miktarlarda ki kilitli varlıklar sadece bu yılın ekim ve kasım ayların da 20 milyarlık bir hacmin üzerinde seyrediyor ve yıl sonuna kadar bu devam edecek. e-çin ve abd arasında ki gerilimler şimdi son düşüşün abd nin uyguladığı çin ürün vergilerinden olduğunu belirttiler belediğimiz bir düşüştü ama atladığımız konu bu düşüşün içeriye girmeyi bekleyen yatırımcıları almadan son bulması unutmayın ayı çin emlak sektörünün patlaması haberi ile gelmişti. f-son düşüşle açıklanan rakam 20 milyar dolar ama verilerin eksikliği tartışması var yani yaklaşık 2 triyon dolara yakın 1 miyondan fazla hesabın tasfiye edildiği binance gibi borsaların da bunu sümen altı ettiği söylentileri uzun zamandır dönüyür ve eğer bu doğru ise hacim kalmamış şuan piyasa senaryolar ile hareket ediyor demektir gelecek olan en hafif kötü haberde bile bunun gerçekliği ortaya saçılacakdır. g-ayrıca son boğa ile yüksek getiri haberlerinin sebep olması ile hergün 100lerce coın basılıyor olması ve sadece coınmarketcap da 10k üzeri ürün olması shıt çılgınlığı zaten pastadaki payın küçükdüğü yatırımcıyı korkutan en temel sebeptir şimdi toparlayacak olursak global verilerin kötülüğü ve hacimsiz piyasanın sağlıklı olmaması endexlerin kötü görünmesi ekonomik açıklamaların hala pozitif olmaması gibi nedenlerden dolayı hala düşüşler bekliyorum fakat bu düşüş ile piyasa öldü bitti değil yatırımcı mıknatısı oluşacağı için kısa bir zaman da boğanın da kapımızı çalacağını ve düşeceği bölgelerin bir daha gelmesinin zor olacağını düşünüyor ve alımlara sıcak bakıyorum ekonomi ile boğanın da kendine geleceğini düşünüyorum sabrın sonu selamettir boğa geldiğinde her ürün kalmayacak ama kalanlar özellikle listemizde olanlar piyasa da olduğu sürece korkum yok sırf bu yüzden alt markette düşüş devam edecekken alım hala yapmış değilim anlattıklarım kendi yol haritamı oluşturmama sebep olan verilerdir yatırım tavsiyesi vermiyorum ama yatırım yapacak arkadaşların kendine bir yol haritası belirlemesi için faydalı olacağını düşündüğüm bilgilerdir geç girip herkesden sonra almam bana birkaç x eksik kazandırabilir ama yanlış zaman da girmem bana para kaybettirir bu yüzden kendi şartlarımca doğru aralığı bekliyor olacağım tekrar görüşene kadar ve dediğim gibi boğa gelip bana ihtiyacınız kalmayana kadar kötü gününüzde yanınız da olmaya devam edeceğim her türlü eleştiriye açığım ama saygısızlık kırmızı çizgimizdir lütfen bu bağlam da hareket edelim sizleri seviyor ve sağlıcakla kalmanızı temenni ediyorum

تحلیل تکنیکال AXS: آیا قیمت بالای 1.6 تثبیت میشود و صعود ادامه مییابد؟ (20 اکتبر 2025)

if today 20 oct 2025 daily close we can stand the price above 1.6 , possibly we can continue rally up

trader_94955
اسیاتک

Make a profit with Asatak and be rewarded
Disclaimer
Any content and materials included in Sahmeto's website and official communication channels are a compilation of personal opinions and analyses and are not binding. They do not constitute any recommendation for buying, selling, entering or exiting the stock market and cryptocurrency market. Also, all news and analyses included in the website and channels are merely republished information from official and unofficial domestic and foreign sources, and it is obvious that users of the said content are responsible for following up and ensuring the authenticity and accuracy of the materials. Therefore, while disclaiming responsibility, it is declared that the responsibility for any decision-making, action, and potential profit and loss in the capital market and cryptocurrency market lies with the trader.