
AXL
Axelar
| تریدر | نوع سیگنال | حد سود/ضرر | زمان انتشار | مشاهده پیام |
|---|---|---|---|---|
No results found. | ||||
Price Chart of Axelar
سود 3 Months :
سیگنالهای Axelar
Filter
Sort messages by
Trader Type
Time Frame

Sohaib_zafar007
AXLUSDT 1D Chart Analysis 18-Dec-25
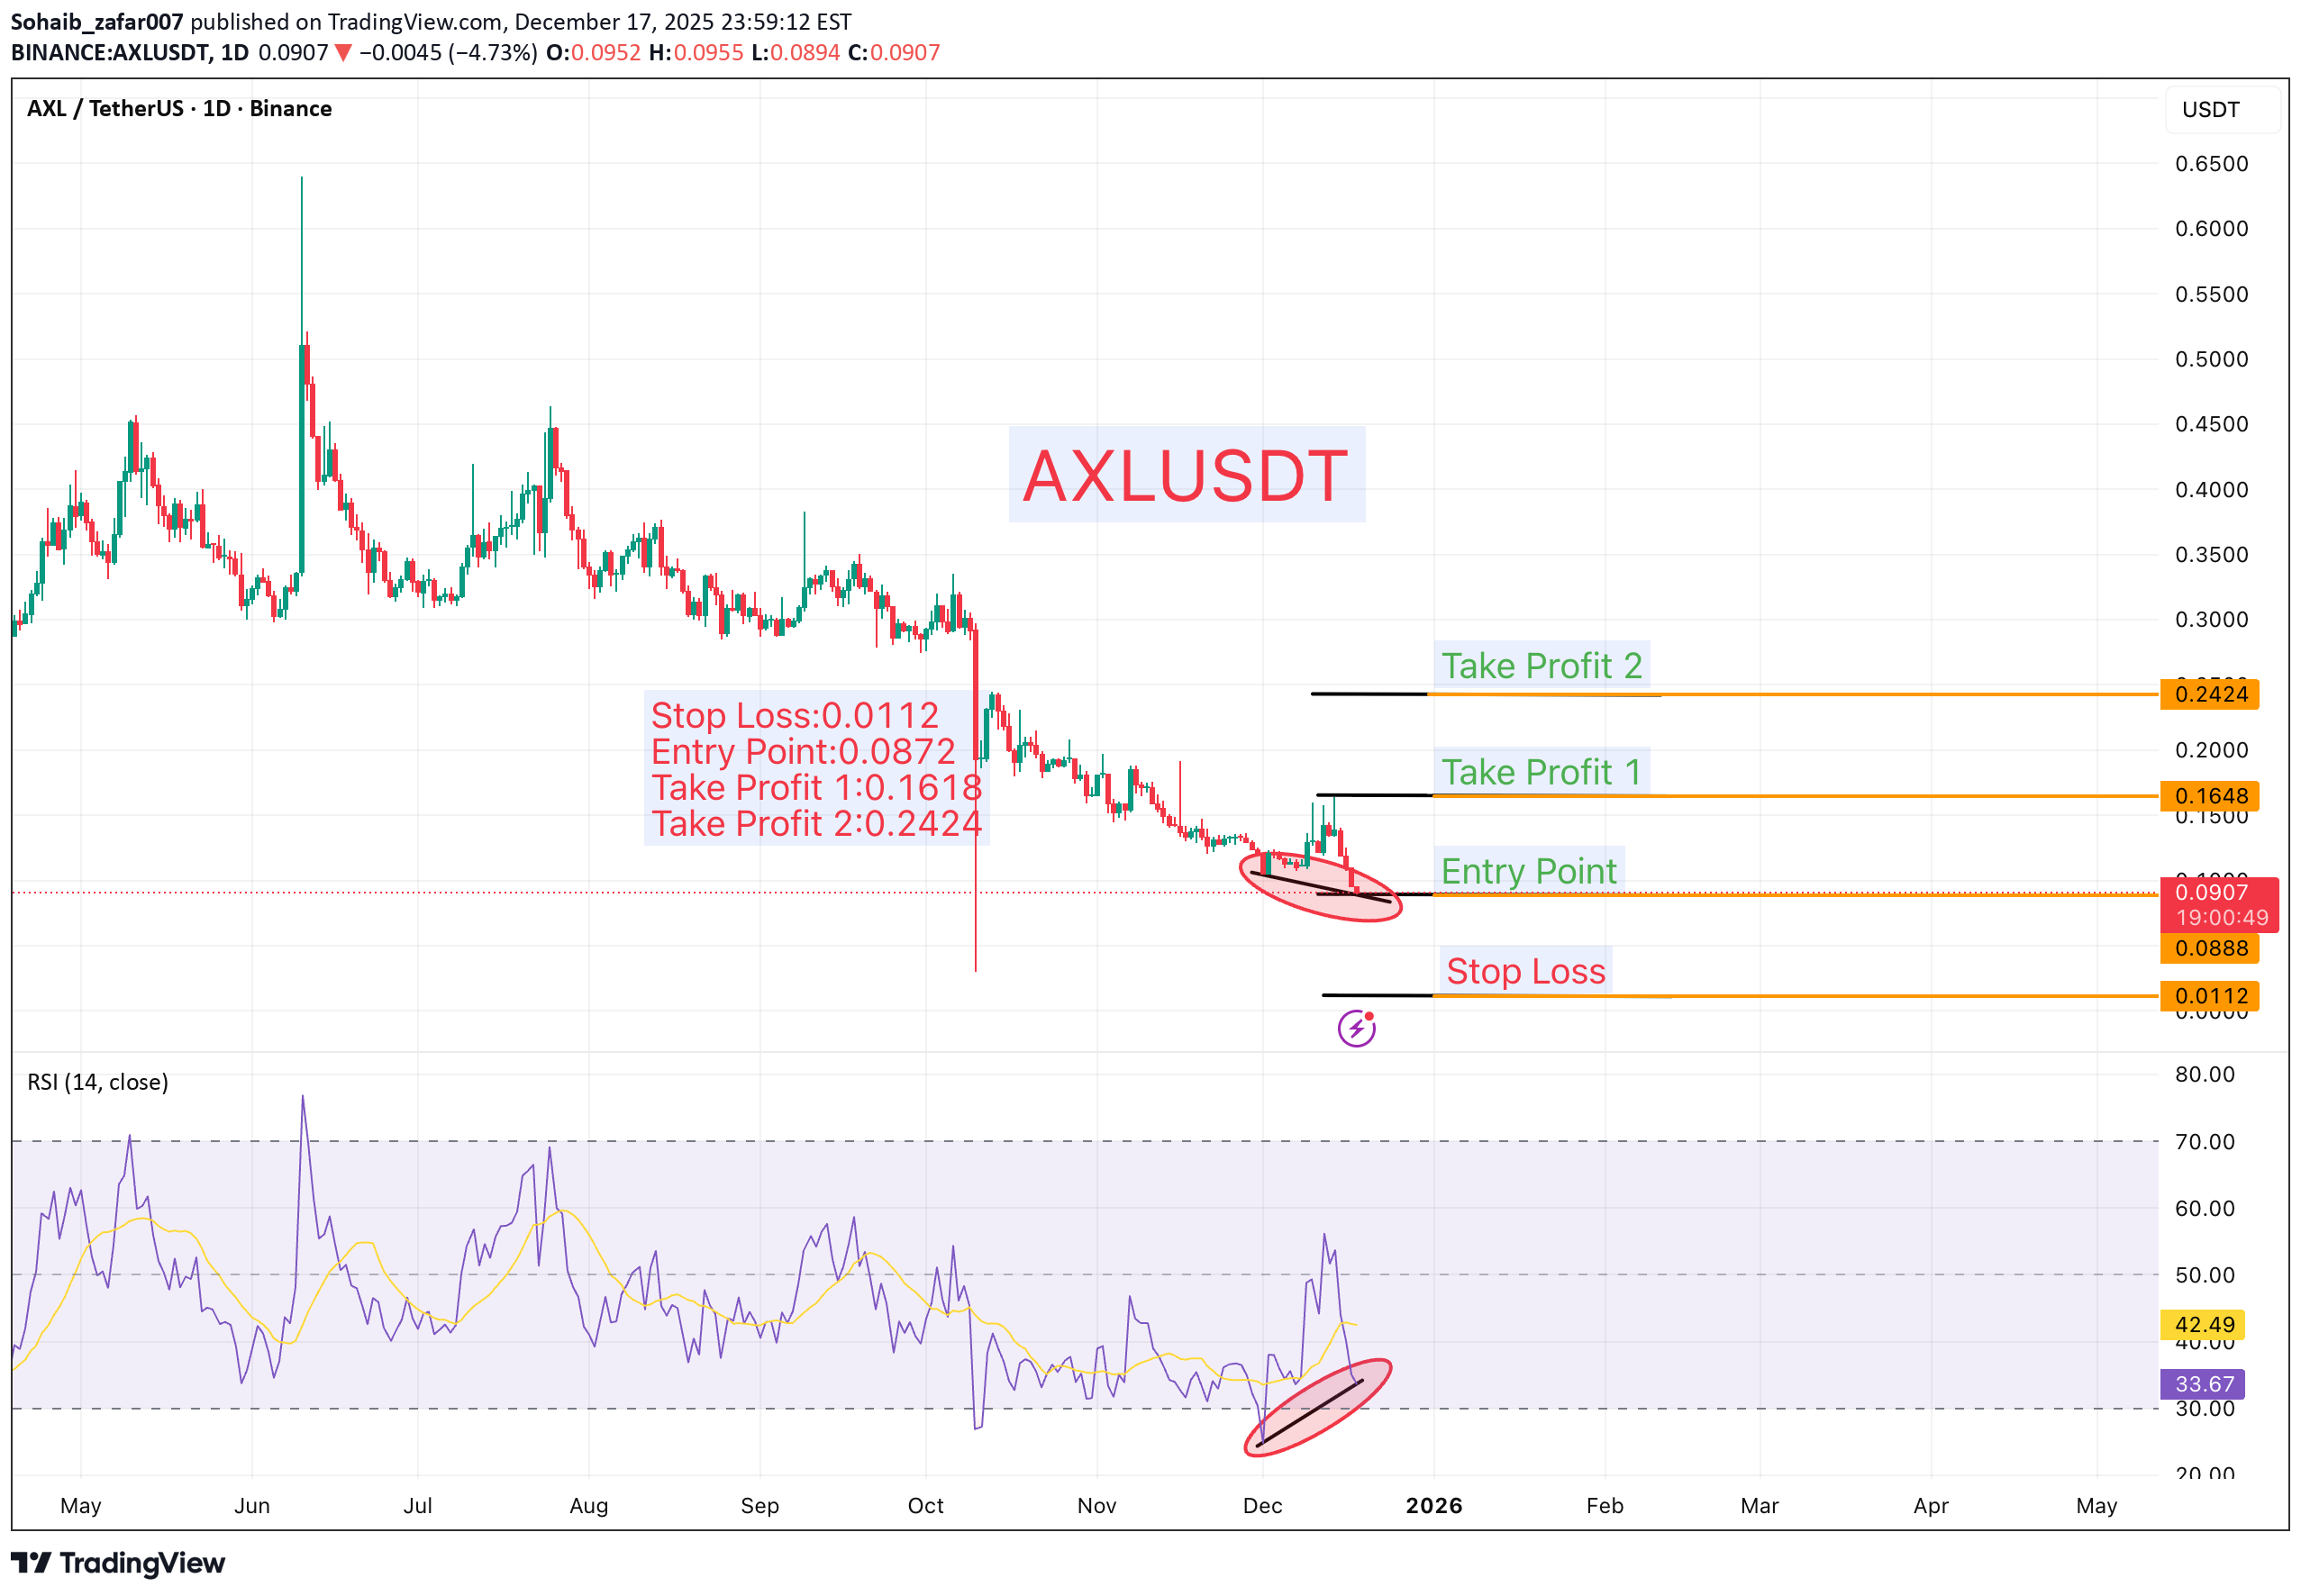
Stop Loss: 0.0112 Entry Point: 0.0872 Take Profit 1: 0.1618 Take Profit 2: 0.2424 Based on 1D and 4H chart analysis, a clear bullish divergence has formed, indicating a potential trend reversal from bearish to bullish. The suggested entry is around 0.0872, with expectations for the price to move toward the projected targets at 0.1618 and 0.2424. ⚠️ Always remember to protect your capital with a proper stop-loss and disciplined risk management.

Crypto_alphabit
AXL
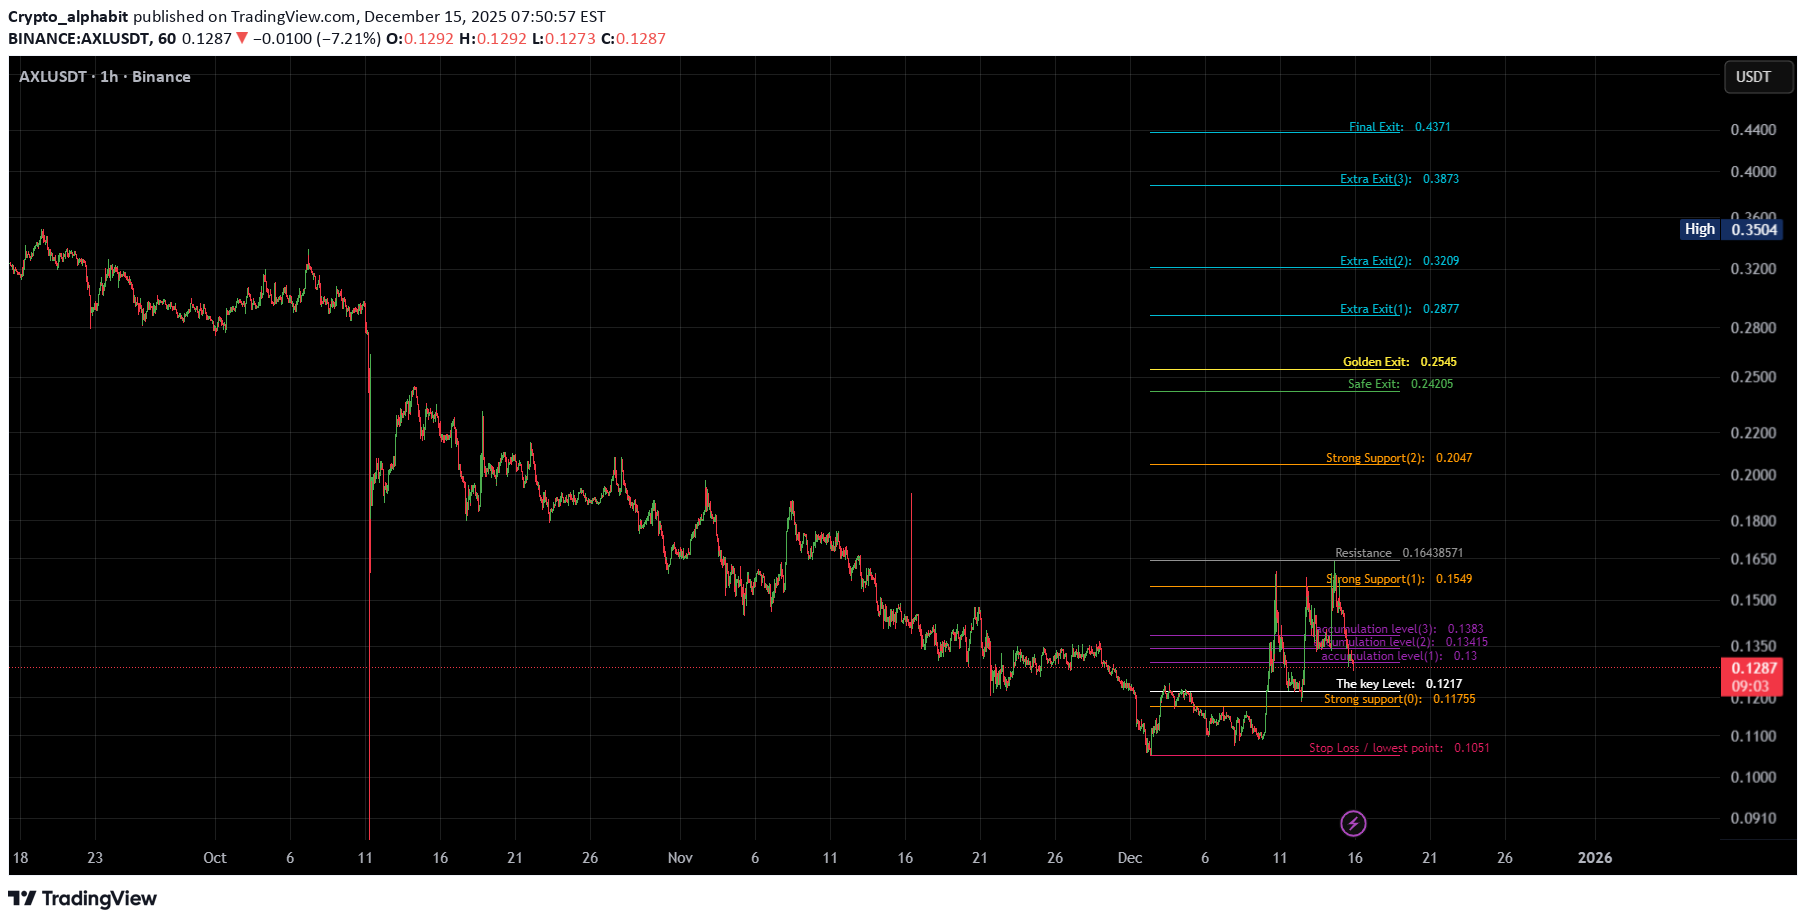
#AXL / USDT watch the indicator and see the price action to the indicator levels _______________________________________________________ Golden Advices. ******************** * collect the coin slowly in the entry range. * Please calculate your losses before the entry. * Do not enter any trade you find it not suitable for you. * No FOMO - No Rush , it is a long journey.

Alpha-GoldFX
سیگنال انفجار بزرگ AXLUSDT: الگوی گُوِه نزولی و احتمال رشد ۹۰ درصدی!
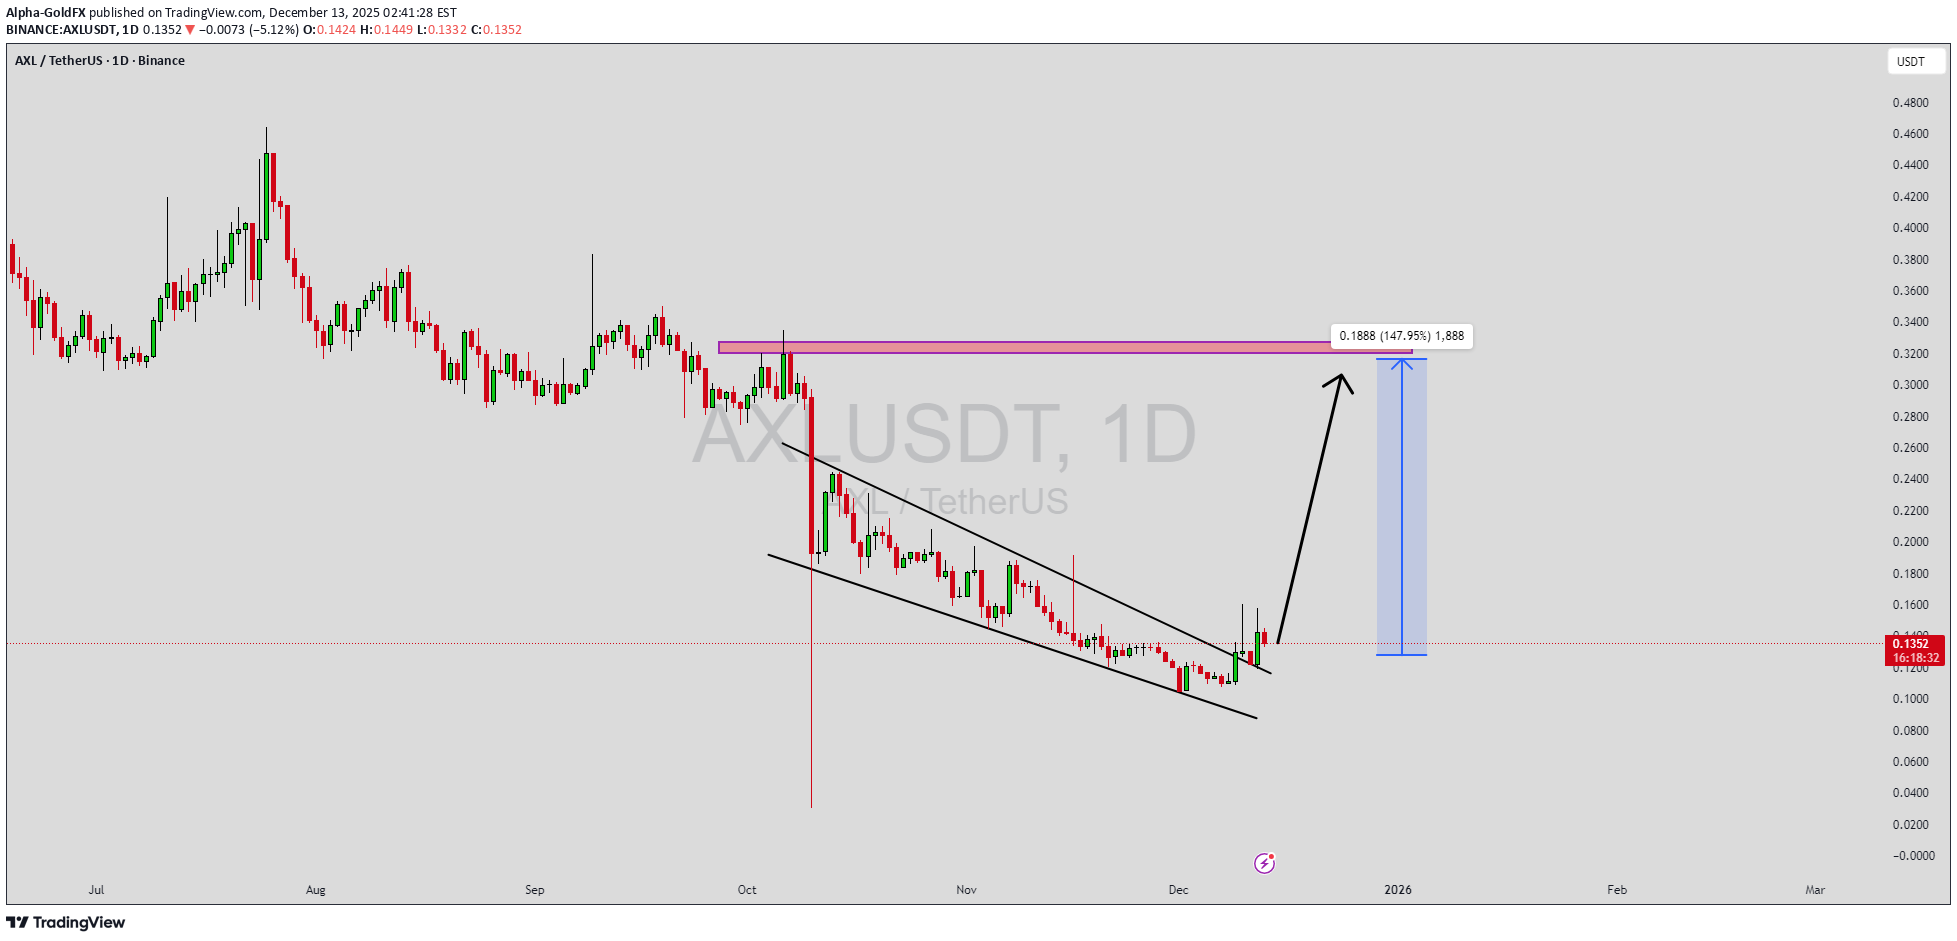
AXLUSDT is forming a clear falling wedge pattern, a classic bullish reversal signal that often indicates an upcoming breakout. The price has been consolidating within a narrowing range, suggesting that selling pressure is weakening while buyers are beginning to regain control. With consistent volume confirming accumulation at lower levels, the setup hints at a potential bullish breakout soon. The projected move could lead to an impressive gain of around 90% to 100% once the price breaks above the wedge resistance. This falling wedge pattern is typically seen at the end of downtrends or corrective phases, and it represents a potential shift in market sentiment from bearish to bullish. Traders closely watching AXLUSDT are noting the strengthening momentum as it nears a breakout zone. The good trading volume adds confidence to this pattern, showing that market participants are positioning early in anticipation of a reversal. Investors’ growing interest in AXLUSDT reflects rising confidence in the project’s long-term fundamentals and current technical strength. If the breakout confirms with sustained volume, this could mark the start of a fresh bullish leg. Traders might find this a valuable setup for medium-term gains, especially as the wedge pattern completes and buying momentum accelerates. ✅ Show your support by hitting the like button and ✅ Leaving a comment below! (What is your opinion about this Coin?) Your feedback and engagement keep me inspired to share more insightful market analysis with you!

rainbow_sniper
The Big Short AXLUSDT
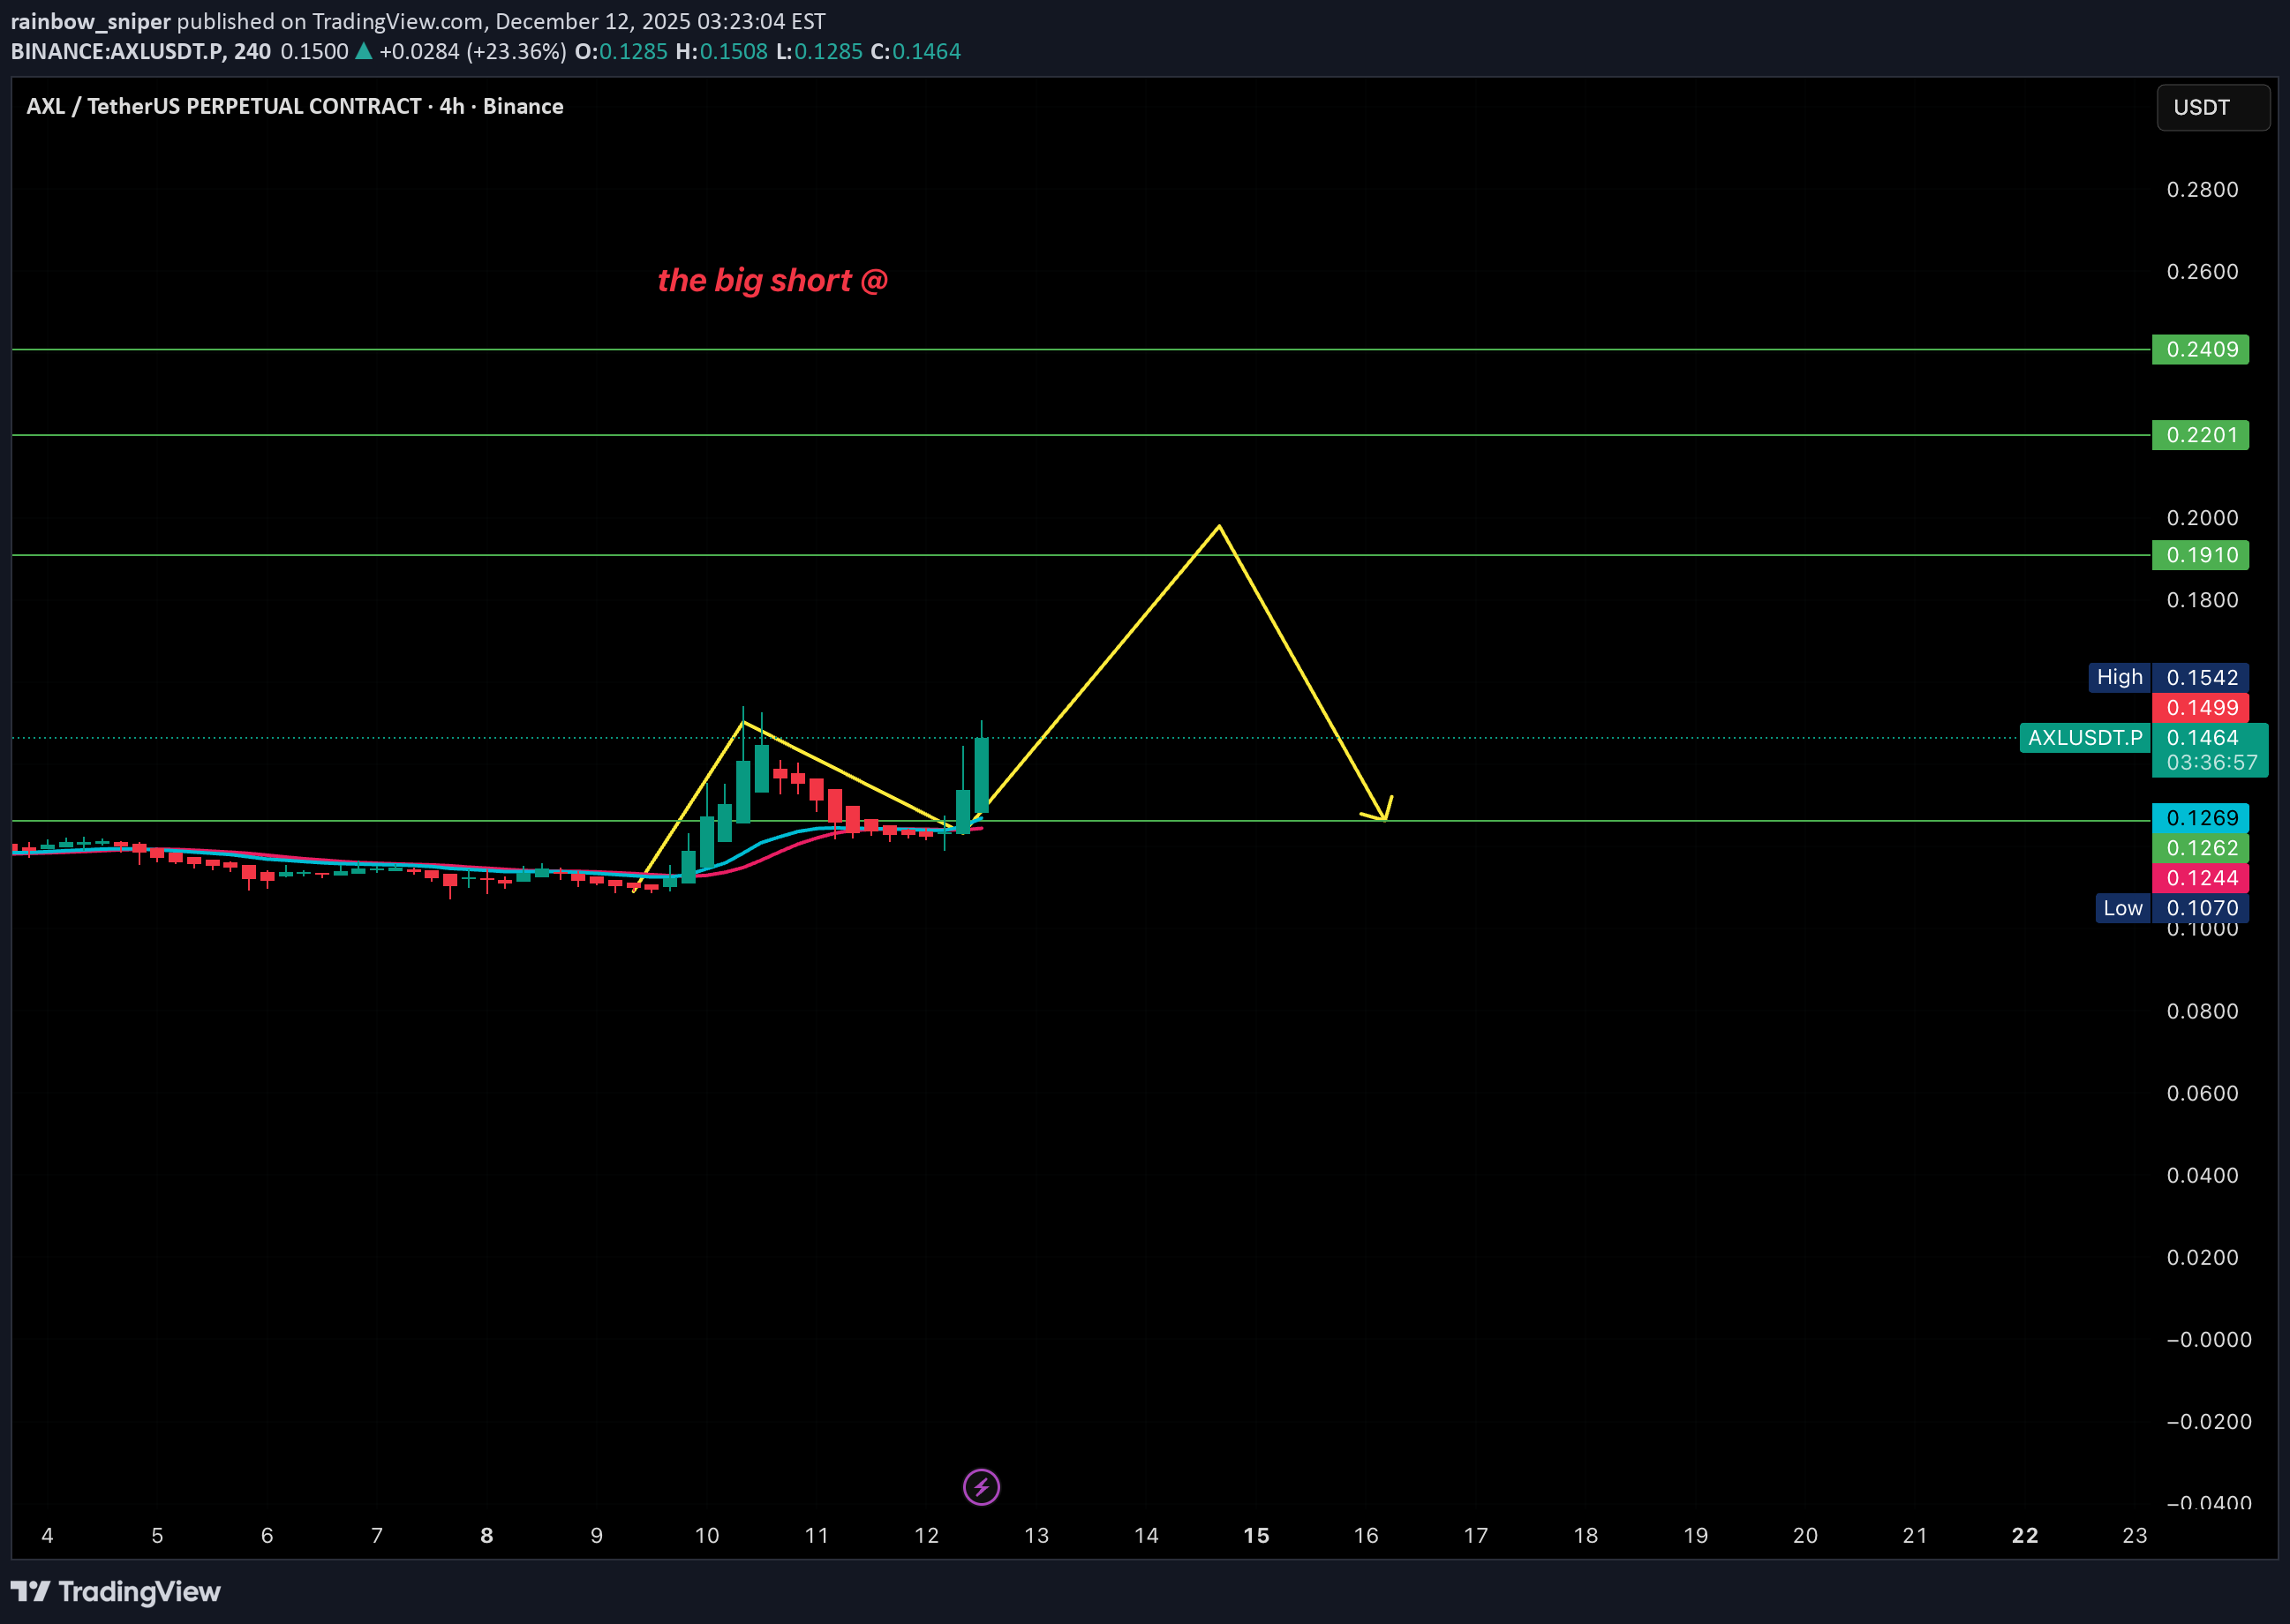
Market Context This idea is based on higher timeframe structure and short confluence. It represents a probability based scenario, not a prediction. The setup forms near a potential D1 top area. Strategy Strategy name: The Big Short This setup focuses on short signals when multiple conditions align. When confluence appears at higher timeframe levels, price may move quickly. Leverage amplifies both risk and reward. Risk management is mandatory. Entry Zones Planned short zones: 0.19 0.22 0.24 Position should be managed in parts to reduce execution risk. Trade Management Possible management approach: Partial profit taking or active management based on price reaction. With leverage, returns can be significant if the scenario plays out. Losses must be predefined if structure fails. Time Expectation This setup is expected to develop over a short term window. It follows the current cycle rather than intraday noise. Risk Note Always define invalidation before entry. If price breaks the structure, the idea is invalid. Capital protection comes first.
Alpha-GoldFX
AXLUSDT Forming falling Wedge
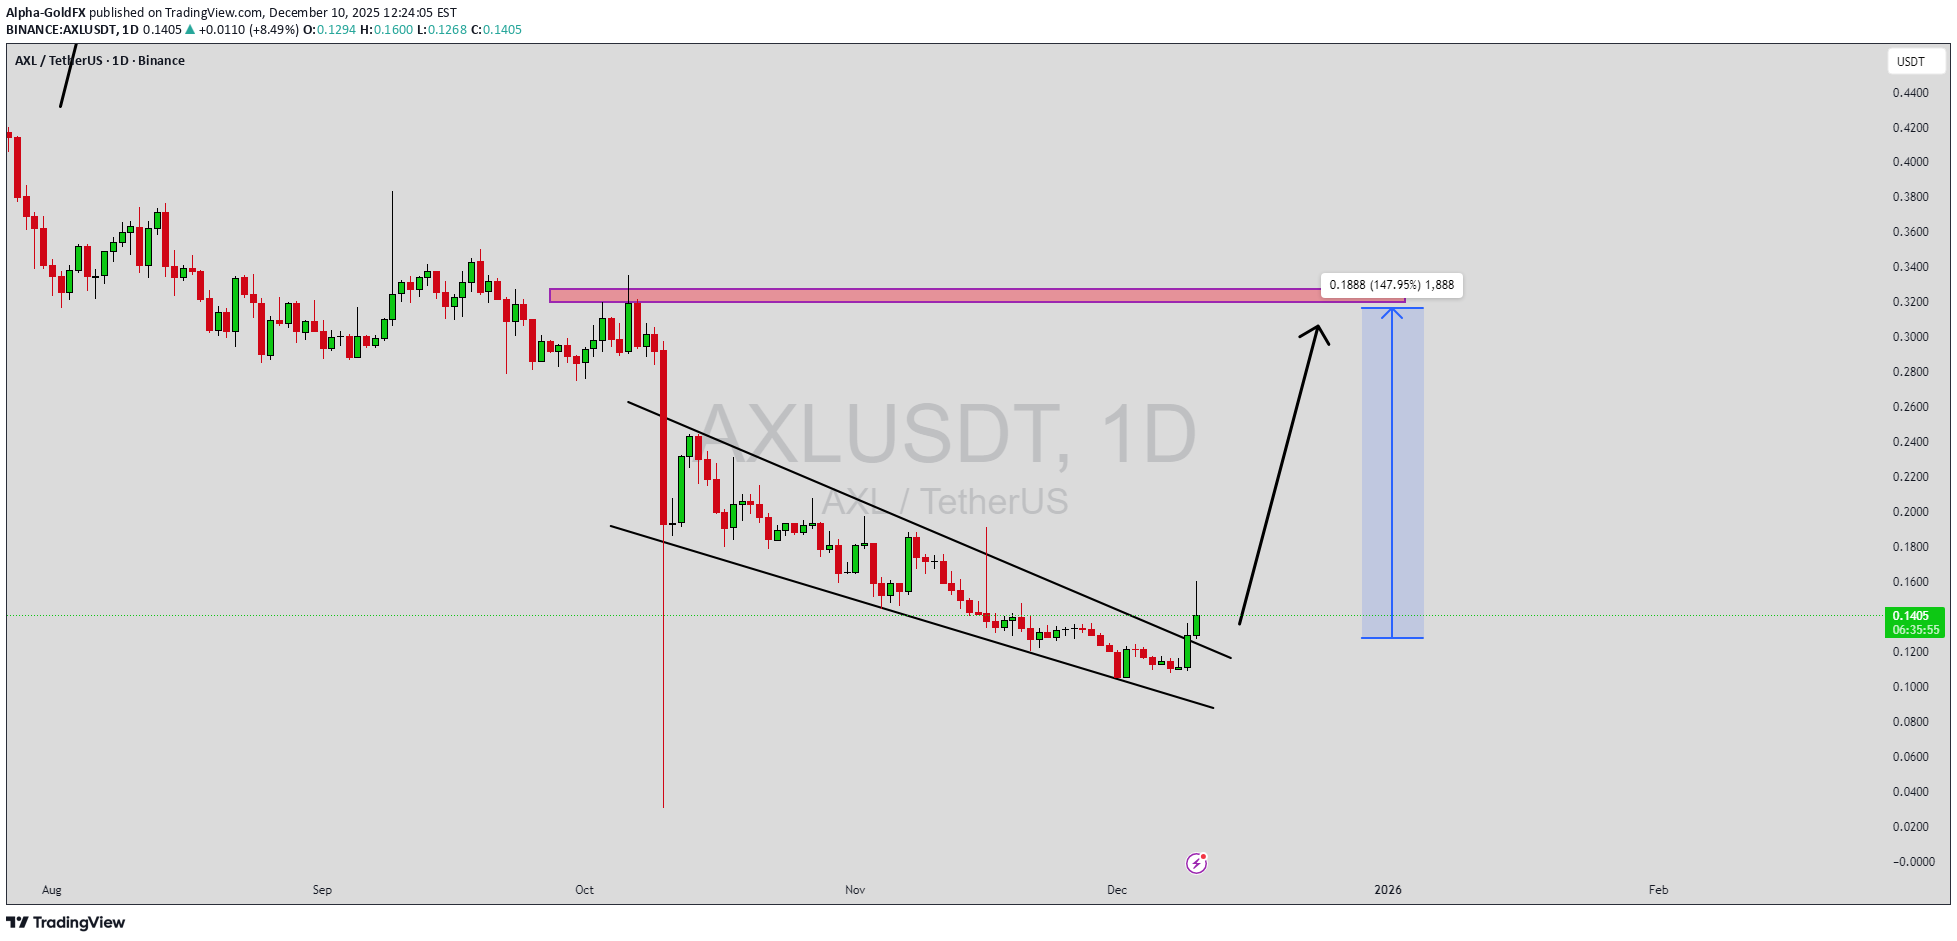
AXLUSDT is forming a clear falling wedge pattern, a classic bullish reversal signal that often indicates an upcoming breakout. The price has been consolidating within a narrowing range, suggesting that selling pressure is weakening while buyers are beginning to regain control. With consistent volume confirming accumulation at lower levels, the setup hints at a potential bullish breakout soon. The projected move could lead to an impressive gain of around 90% to 100% once the price breaks above the wedge resistance. This falling wedge pattern is typically seen at the end of downtrends or corrective phases, and it represents a potential shift in market sentiment from bearish to bullish. Traders closely watching AXLUSDT are noting the strengthening momentum as it nears a breakout zone. The good trading volume adds confidence to this pattern, showing that market participants are positioning early in anticipation of a reversal. Investors’ growing interest in AXLUSDT reflects rising confidence in the project’s long-term fundamentals and current technical strength. If the breakout confirms with sustained volume, this could mark the start of a fresh bullish leg. Traders might find this a valuable setup for medium-term gains, especially as the wedge pattern completes and buying momentum accelerates. ✅ Show your support by hitting the like button and ✅ Leaving a comment below! (What is your opinion about this Coin?) Your feedback and engagement keep me inspired to share more insightful market analysis with you!

asilturk
توکن AXL: آیا این ارز دیجیتال کوچک، بازار را متحول میکند؟

AXL is the governance and service token of the Axelar Network, which connects different blok chains in a secure and decentralized manner, forming the basis of the multi-chain future. It is currently traded at a price band of $0.14. There is no formation, only technical data is positive. I wish you good luck.

Bithereum_io
تحلیل AXL/USDT: مثلث نزولی و کف دوقلو؛ اهداف صعودی انفجاری!

#AXL is moving inside a falling wedge pattern on the daily chart and has also formed a double bottom pattern. Short-term targets: 🎯 $0.2317 🎯 $0.2606 In case of a breakout above the wedge resistance, the potential targets are: 🎯 $0.3084 🎯 $0.3470 🎯 $0.3855 🎯 $0.4404 🎯 $0.5104 ⚠️ Always remember to use a tight stop-loss and maintain proper risk management.

JupahduhX
$axl
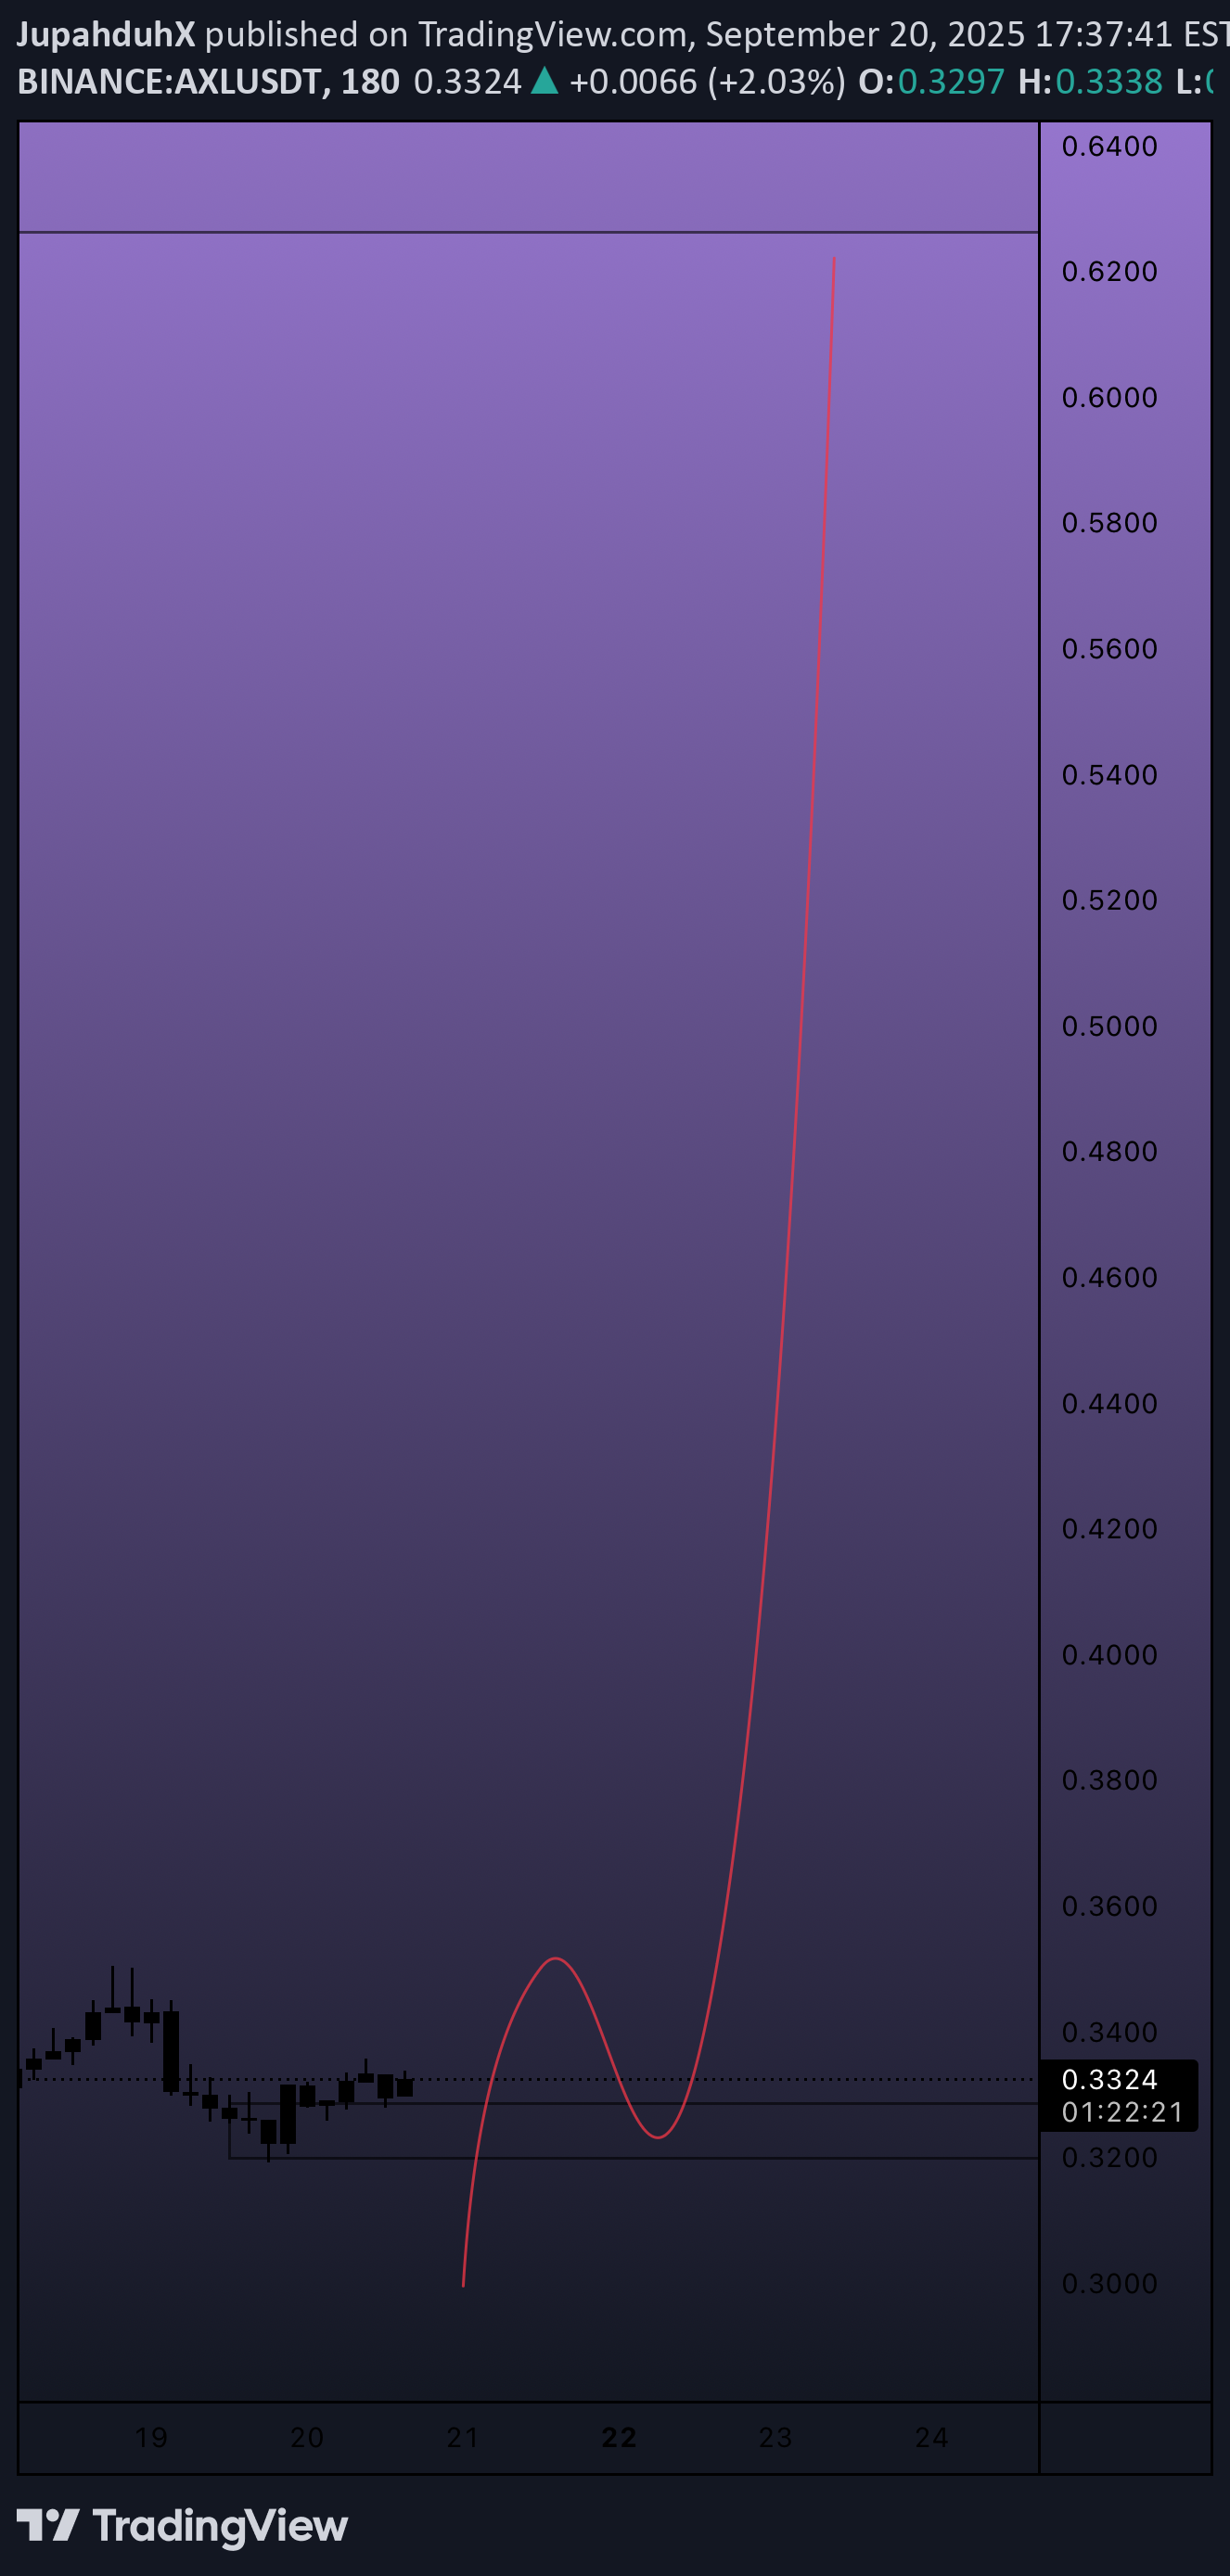
AXL potential from here…. $0.32 is crucial to pricing. I have a low end tolerance of $0.30 for this one. If we can sustain this handle this should get a nice run into $0.62-$0.87!!!! At that point, will it face its biggest test! 😊🫶🏽
Bithereum_io
AXLUSDT 1D
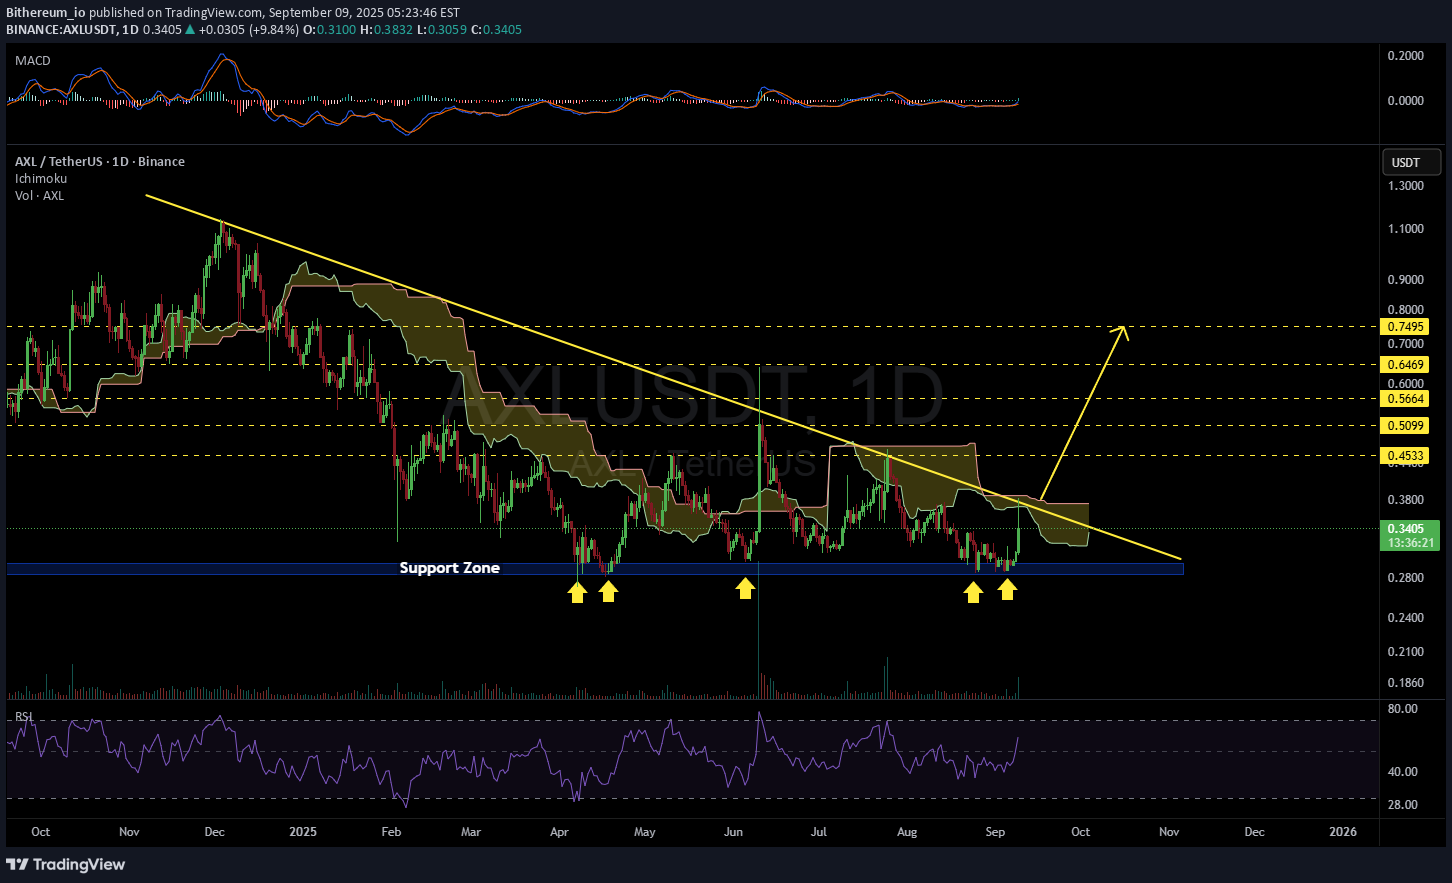
#AXL is moving within a descending triangle on the daily chart. Recently, it bounced off the support zone and was rejected from the triangle resistance line and the Ichimoku cloud. We believe it will break above the resistance soon. If that happens, the potential targets are: 🎯 $0.4533 🎯 $0.5099 🎯 $0.5664 🎯 $0.6469 🎯 $0.7495 ⚠️ Always remember to use a tight stop-loss and follow proper risk management.

CryptoNuclear
AXLUSDT — Demand Zone Defense or Bearish Breakdown?
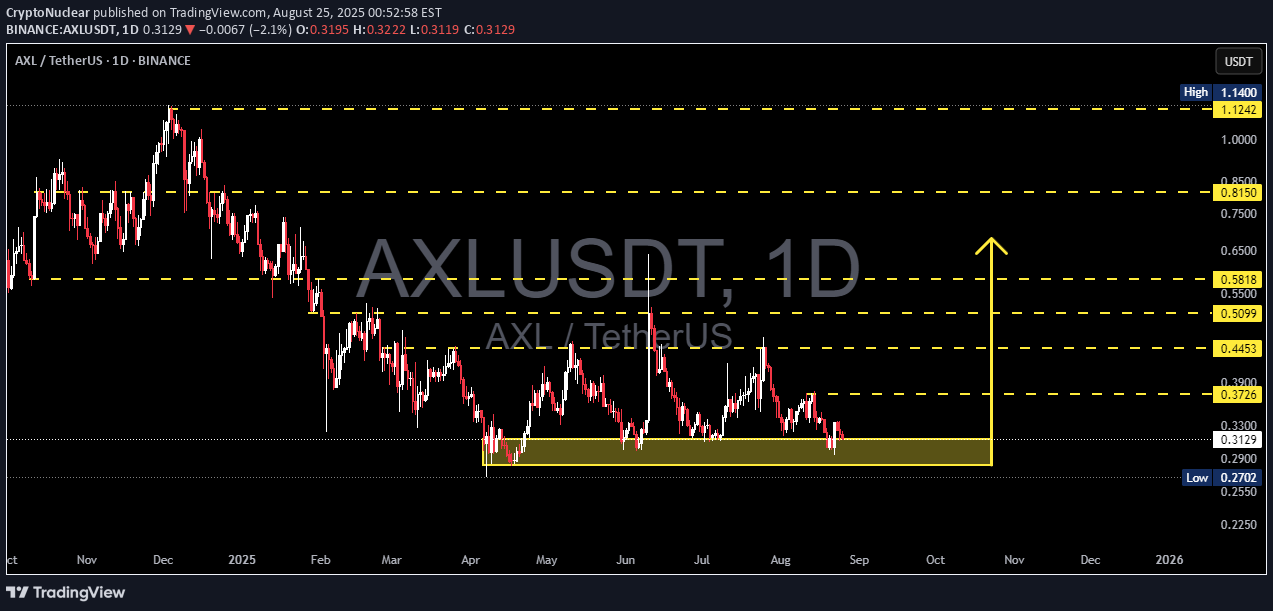
📝 Overview Currently, AXLUSDT (1D, Binance) is trading inside a key demand zone between 0.27–0.33 (yellow box on the chart). This area has been tested multiple times since April 2025, showing strong buying interest whenever price dips into it. However, the broader structure still shows a clear downtrend with consistent lower highs, meaning the market is now at a critical decision point: will this demand zone hold and trigger an accumulation phase leading to reversal, or will sellers push price into a deeper bearish continuation? --- 📍 Key Technical Levels Main Demand/Support Zone: 0.27 – 0.33 Lowest wick: 0.2702 Current mid-range: around 0.3143 Major Resistances above: 0.3726 → 0.4453 → 0.5099 → 0.5818 → 0.8150 → 1.1242 / 1.14 (High) --- 🔎 Structure & Pattern Range base at the bottom of a downtrend: Price has been consolidating within this range since April. Liquidity sweeps (fakeouts): Long wicks below the zone were quickly absorbed, signaling strong buyers defending the area. Reversal confirmation: Only valid if price can close daily above 0.3726 and sustain it with a successful retest. Until then, risk of sideways chop or breakdown remains. --- 🚀 Bullish Scenario 1. Price sustains above 0.30 without a daily close below 0.27. 2. Breakout trigger: Daily close > 0.3726, followed by a successful retest → reversal confirmation. 3. Upside targets: 🎯 TP1: 0.4453 🎯 TP2: 0.5099 🎯 TP3: 0.5818 🎯 Extended: 0.8150 → 1.12–1.14 if momentum strengthens. 4. Bullish invalidation: Daily close < 0.27. Aggressive approach: Buy around 0.30–0.31, SL below 0.27. Conservative approach: Wait for breakout above 0.3726 and buy the retest. --- 📉 Bearish Scenario 1. Failure to hold the 0.27–0.33 demand will weaken structure further. 2. Daily close below 0.27 opens the door for deeper downside. 3. Next bearish targets: First support: 0.2550 If broken, potential new lows due to lack of historical demand below. --- ⚖️ Conclusion The 0.27–0.33 demand zone is a make-or-break level for AXLUSDT. As long as price holds above it, the possibility of accumulation and reversal remains alive, especially with a breakout above 0.3726. But if the zone fails, sellers may extend the downtrend to fresh lows. In short: This is the golden zone for a decisive move — either accumulation to fuel a reversal, or a breakdown to continue the bearish trend. #AXLUSDT #AXL #CryptoAnalysis #PriceAction #SupportResistance #DemandZone #RangeTrading #BreakoutSetup #BearishScenario #BullishScenario #CryptoTrading #DYOR
Disclaimer
Any content and materials included in Sahmeto's website and official communication channels are a compilation of personal opinions and analyses and are not binding. They do not constitute any recommendation for buying, selling, entering or exiting the stock market and cryptocurrency market. Also, all news and analyses included in the website and channels are merely republished information from official and unofficial domestic and foreign sources, and it is obvious that users of the said content are responsible for following up and ensuring the authenticity and accuracy of the materials. Therefore, while disclaiming responsibility, it is declared that the responsibility for any decision-making, action, and potential profit and loss in the capital market and cryptocurrency market lies with the trader.