
ATOM
Cosmos
| تریدر | نوع سیگنال | حد سود/ضرر | زمان انتشار | مشاهده پیام |
|---|---|---|---|---|
خرید | حد سود: تعیین نشده حد ضرر: تعیین نشده | 12/16/2025 |

Price Chart of Cosmos
سود 3 Months :
خلاصه سیگنالهای Cosmos
سیگنالهای Cosmos
Filter
Sort messages by
Trader Type
Time Frame

cryptodailyuk
ATOM/USDT short-term
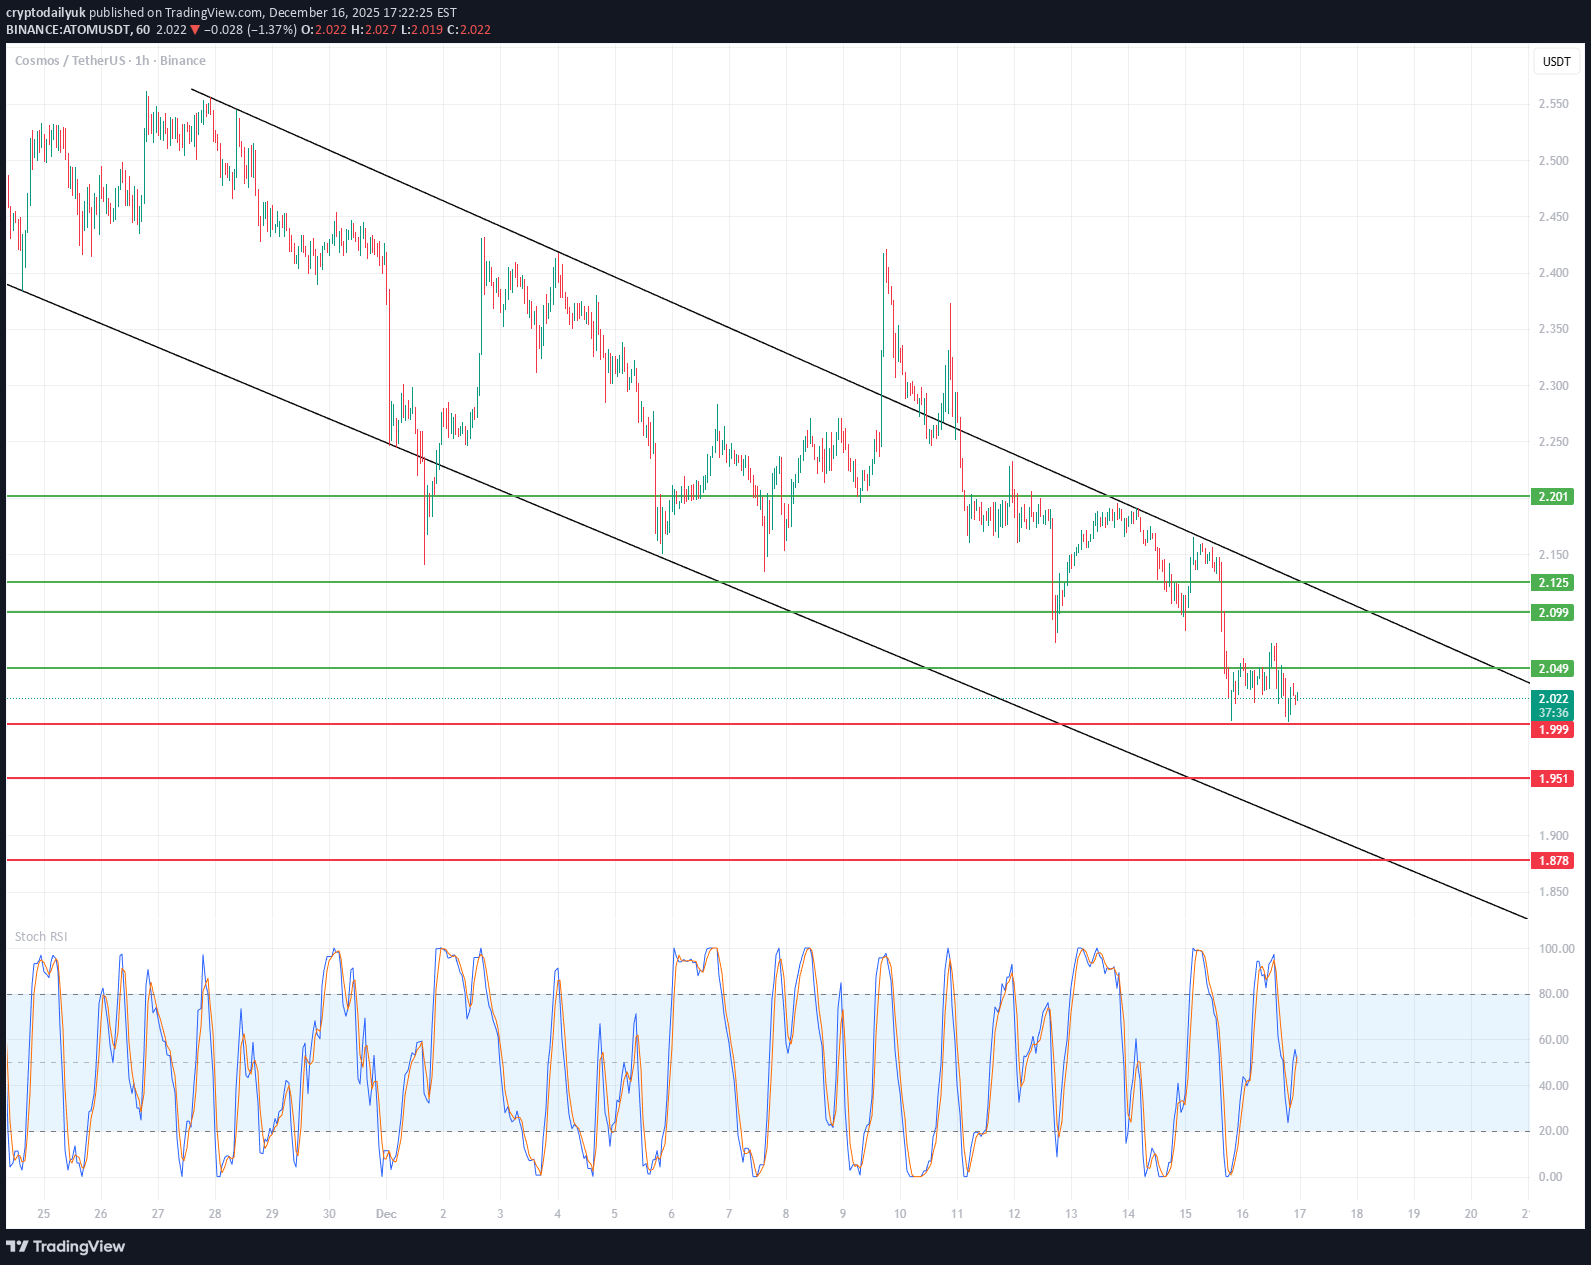
🔍 Market Structure Clear downtrend – price is moving within a descending channel (lower highs and lows). Each bounce is sold at the upper band of the channel. No signal of a change in structure yet (no HH + HL). 📉 Current Price Status Price is at the lower end of the channel. Consolidation after a downward impulse → typical bearish continuation or short technical rebound. Current Zone: ~2.02–2.05 USDT – local support + demand reactions. 🟢 Key Levels Support 2.049 – local support (current reaction) 1.999 – strong psychological support 1.951 1.878 – lower demand zone (important!) Resistance 2.099 2.125 2.201 – key resistance / S→R flip. Upper channel line (~2.20–2.23) 📊 Stochastic RSI Oscillator often in oversold territory. Currently recovering from the low → possible short rebound. BUT: in a downtrend. The Stoch RSI is not a long-term signal. ➡️ More likely a pullback, not a trend change. 🧠 Scenarios 🔴 Baseline scenario (most likely) Bounce to: 2.09 → 2.12 Rejection + further decline: 1.99 then 1.95 / 1.88 ➡️ Short at resistance levels in line with the trend. 🟢 Alternative scenario (less likely) Breakout of 2.20 + close of the 1H candle above the channel Retest from above Then targets: 2.28 2.35–2.40 ➡️ Only then can we talk about a change in structure.
Atom In a Clear Supply Zone and primed for reversal. Sizing long
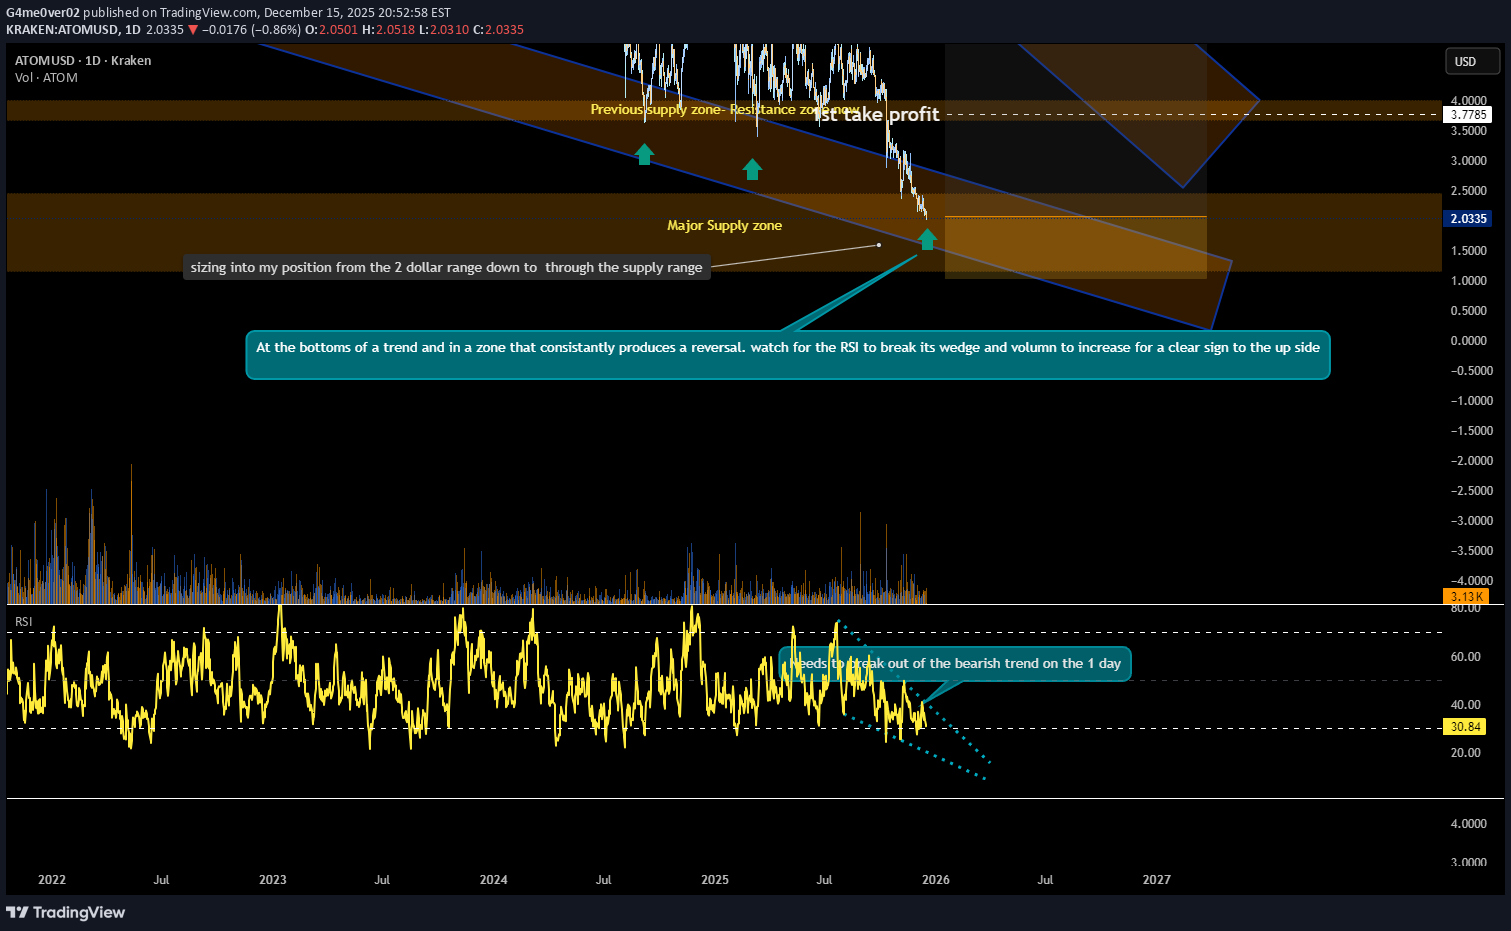
Atom is in a critical zone for its future. zone has historically produced reactions and turn arounds. im adding and sizing into my long

SwallowAcademy
Cosmos (ATOM): Looking For Break of Bollinger Bands Middle Line
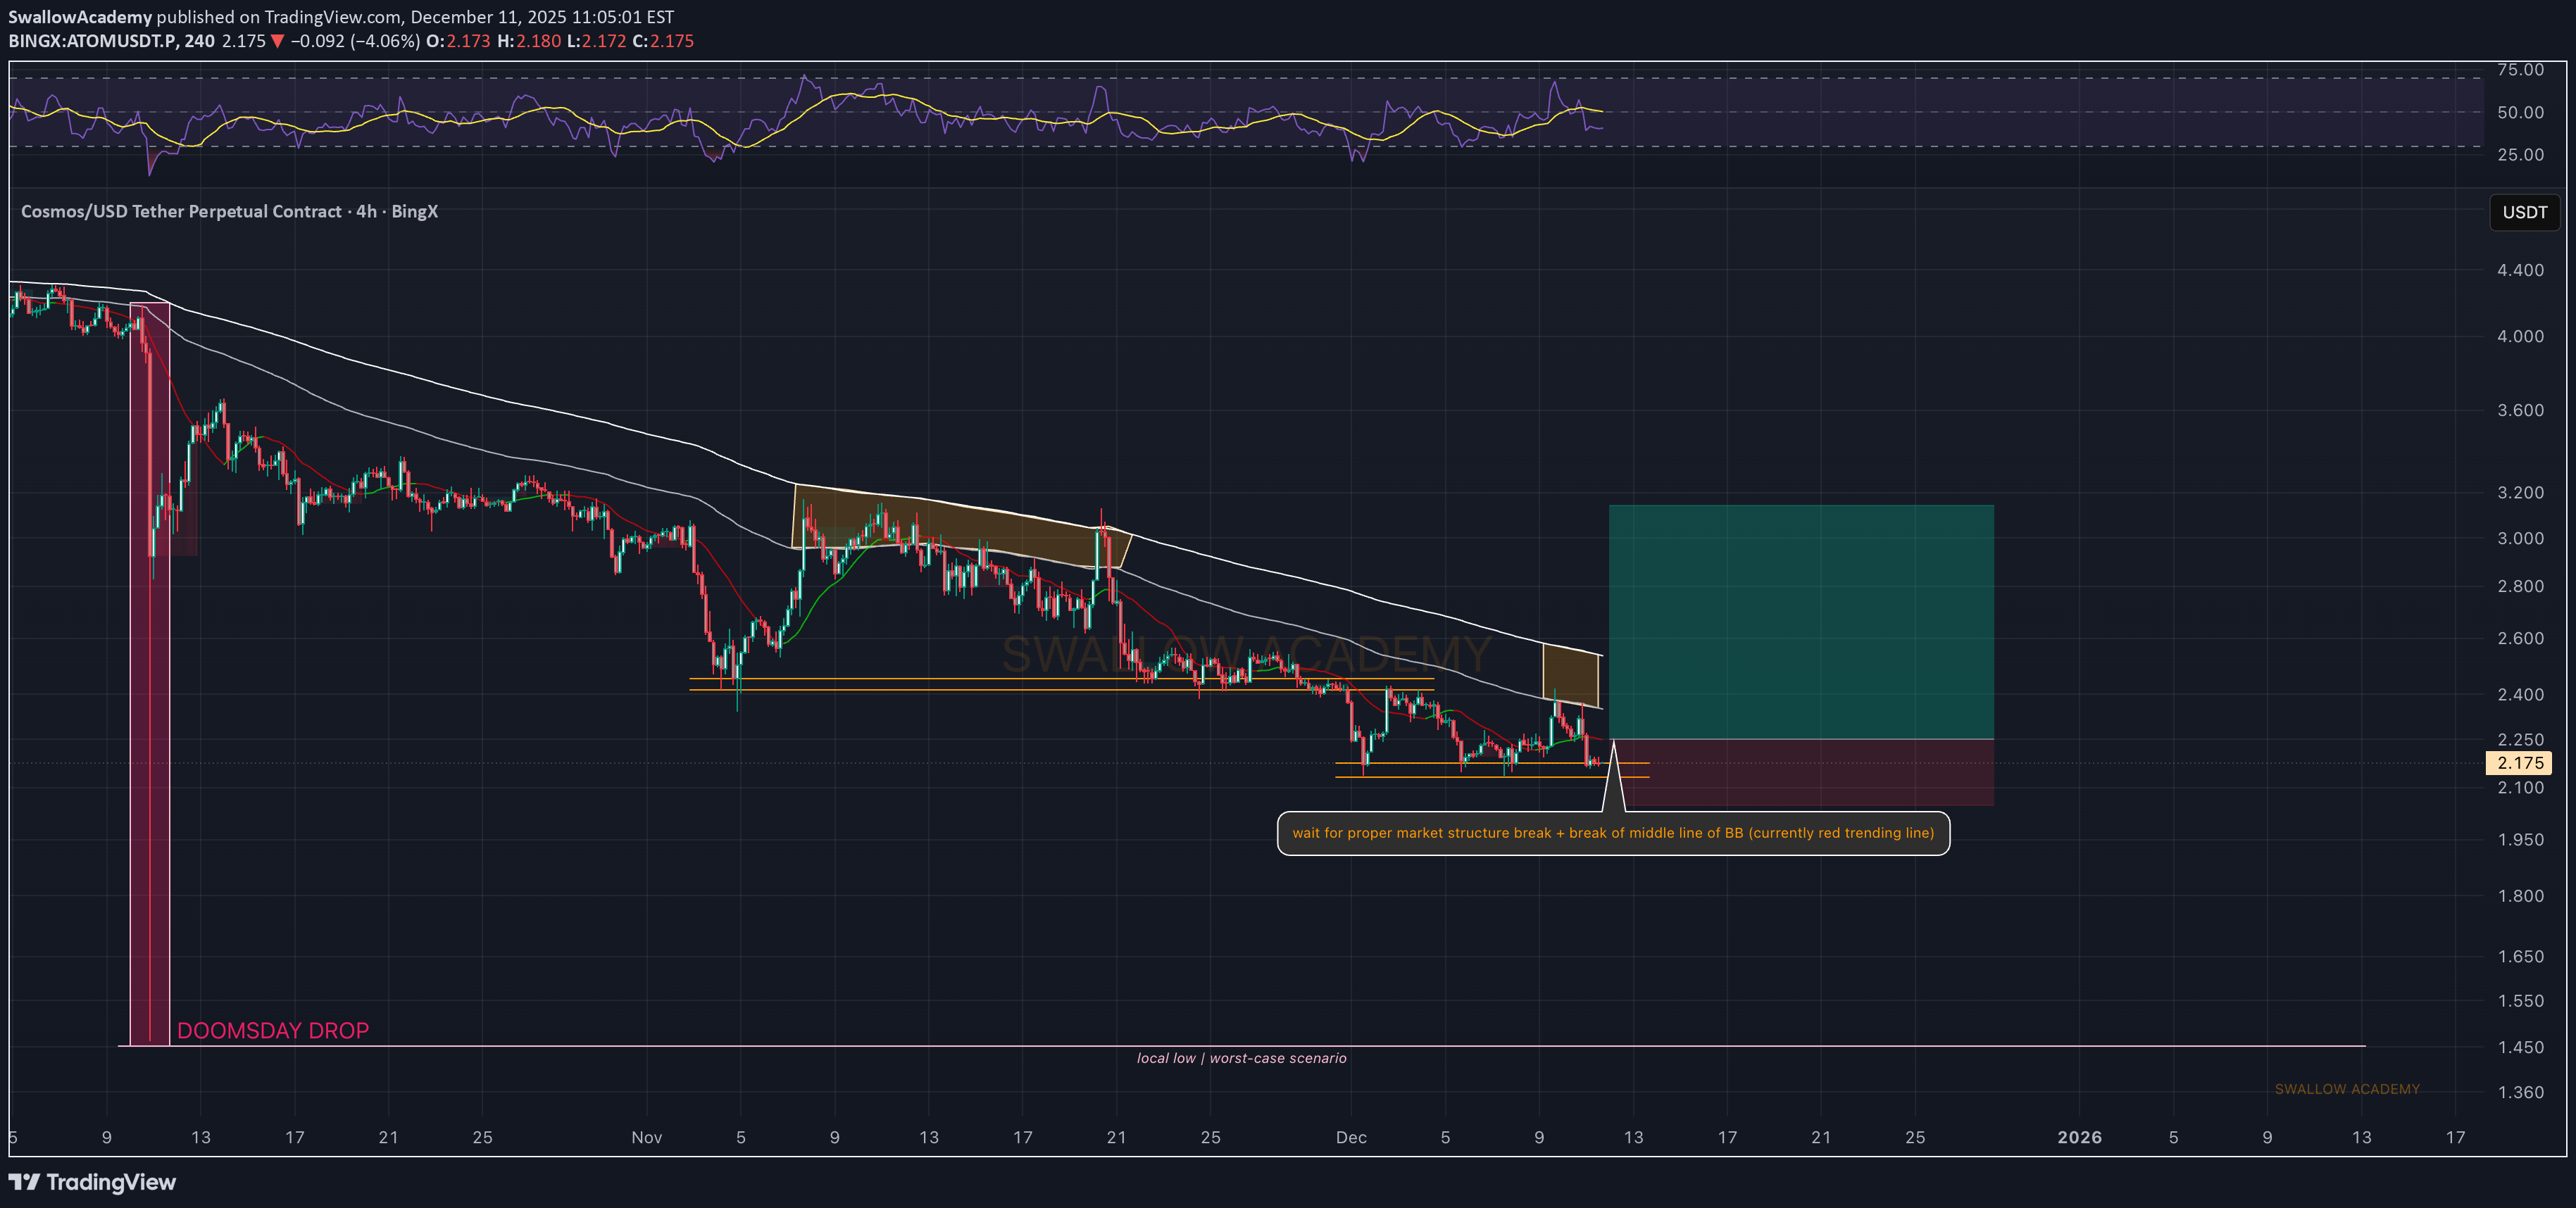
ATOM is still trading inside this slow bleed, but the last reaction from the smaller support shows buyers are trying to hold the zone. We already saw one pickup from this level, meaning this area stays the key region for any bullish attempt. For upside, we need a proper structure break first. Price has to break above the middle BB/trendline and show buyers reclaiming it. Only then the long setup starts to make sense, as the whole trend is still leaning bearish until that shift happens. If we get a clean MSB + break above the red trending line, the next targets open up quickly since liquidity above recent highs hasn’t been taken yet. Until then, patience — let the confirmation come. Swallow Academy

SpartaBTC
ATOM - COSMOS. Main Trend 12 2025
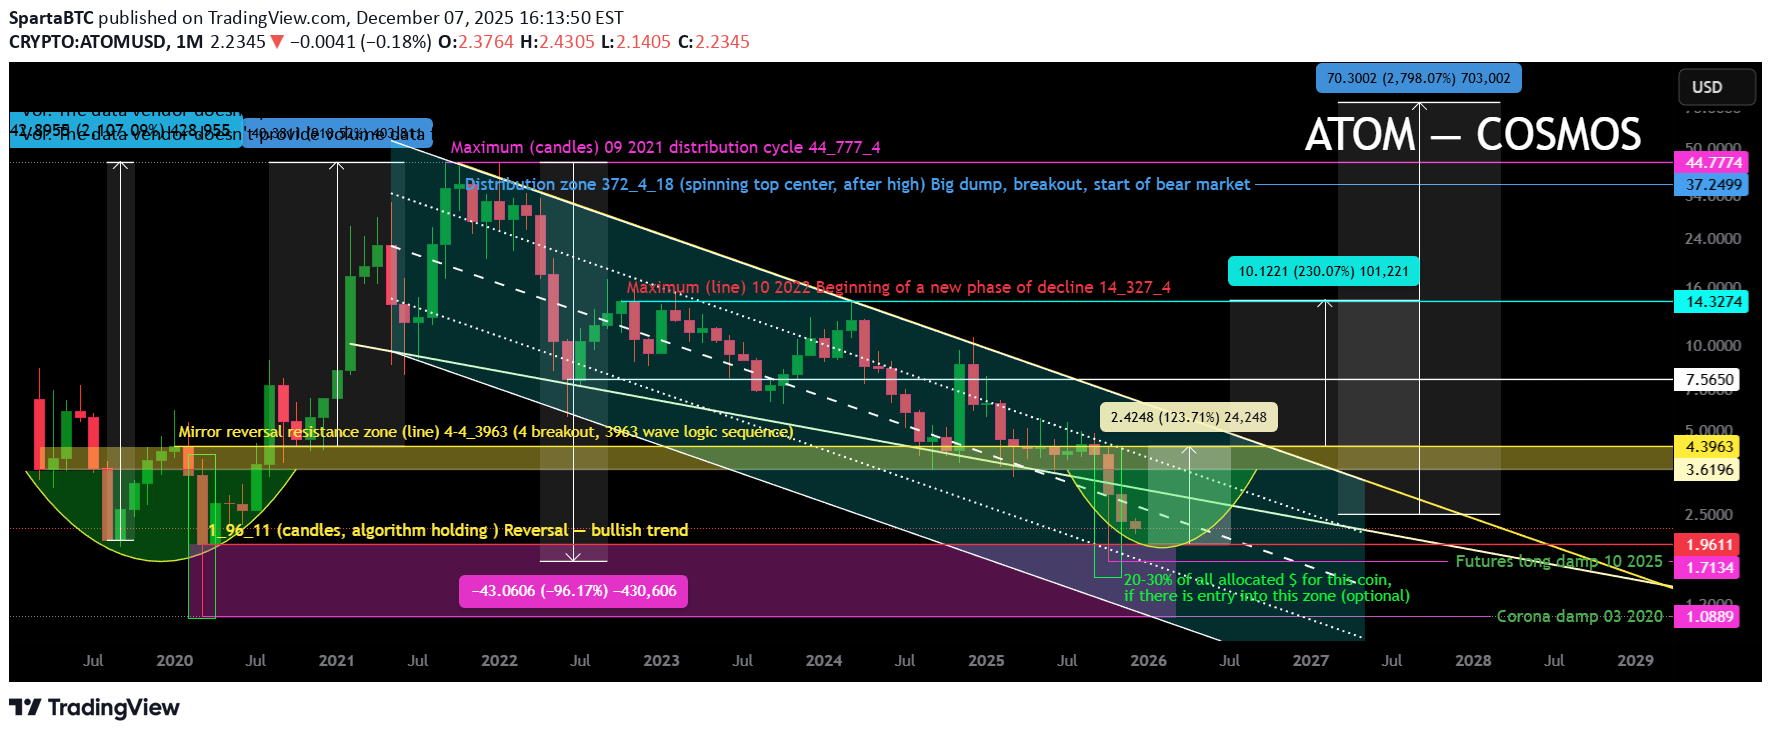
Logarithm. 1-month time frame to visualize the primary trend. Price is in a downward secondary trend channel right at the distribution zone of the 2021 super hype wave. The hype is dead, but it's highly likely to revive when it makes sense from the overall market perspective. That's why, after so many years, I'm publishing this idea + I'll show you something else. 1-month time frame 3-day time frame. Buy fear in increments, in accumulation zones, sell joy in increments, in selling zones. Any purchase, including at the market, is acceptable and very cheap from the perspective of the primary trend and its potential (even secondary). If you also manage the risks of asset diversification (avoid buying dying "schoolboy candy wrappers" or "promising junk" on hype or listings, which are the same thing), and entry/exit amounts, rather than slapping a stop-loss after every purchase, where it's needed (short-term breakouts of trend movements, distribution trading) and where it's not needed (capitulation, reversal zones with a clear outcome), but the book says it's mandatory (liquidity collection by exchanges and large market participants, algorithms, through the cloned actions of the majority). Then you'll experience peace and profit over time, that is, speculative "Zen." 1) Your intelligence level. 2) Trading plan. 3) Risk control. This correlates strongly with discipline (maturity, experience) and the first point. If you lack any one of the above three points (one doesn't work without the other), then give up investing and trading, as you'll always be an underdog, and any fleeting wins (accidents or being "baited" into you) won't matter. After all, in the long run, you'll never have anything but emotional devastation and regret. This applies to any activity related to money and responsibility. Risk must always be justified and controlled by you. This is the foundation of foundations. If this isn't the case, then you're building a speculative house on a clay foundation, trying only to guess the price. Sooner or later, it will collapse, and the later it happens, the more painful it will be. 🧠 Information for self-improvement only for the more savvy. No one needs this, because you'll be inventing something that doesn't exist. Standard TA logic + risk management are sufficient for making money. The algorithm's "levels" (coinciding with support/resistance zone levels, which is logical) are all set using a magnet, precisely based on numerical values (not everyone needs to understand this; it's a bonus, nothing more). I specifically only used a large time frame (month) and key trend direction zones to keep things simple. I've already demonstrated this many times, whether you understand it or not. Some magnet levels are based on candlesticks (lows and highs), while others are based on the trend direction (linear). I've indicated it in parentheses. As the price showed many years later (trend development), as planned (trend direction and key areas), so it was all created by an AI algorithm "that doesn't exist," like "Aladdin squared." Oh, yes. It's a conspiracy theory... Open your eyes... Markets are driven by capital according to rationality, according to its actions (buying at lows creates news horror, selling at highs creates news euphoria), which equals profit. Governments play a huge role in this, especially the government of a "global democracy."

WaveRiders2

CryptoYodaX
SwallowAcademy
کازموس (ATOM) آماده جهش: بهترین نقاط ورود برای سود کوتاهمدت و بلندمدت
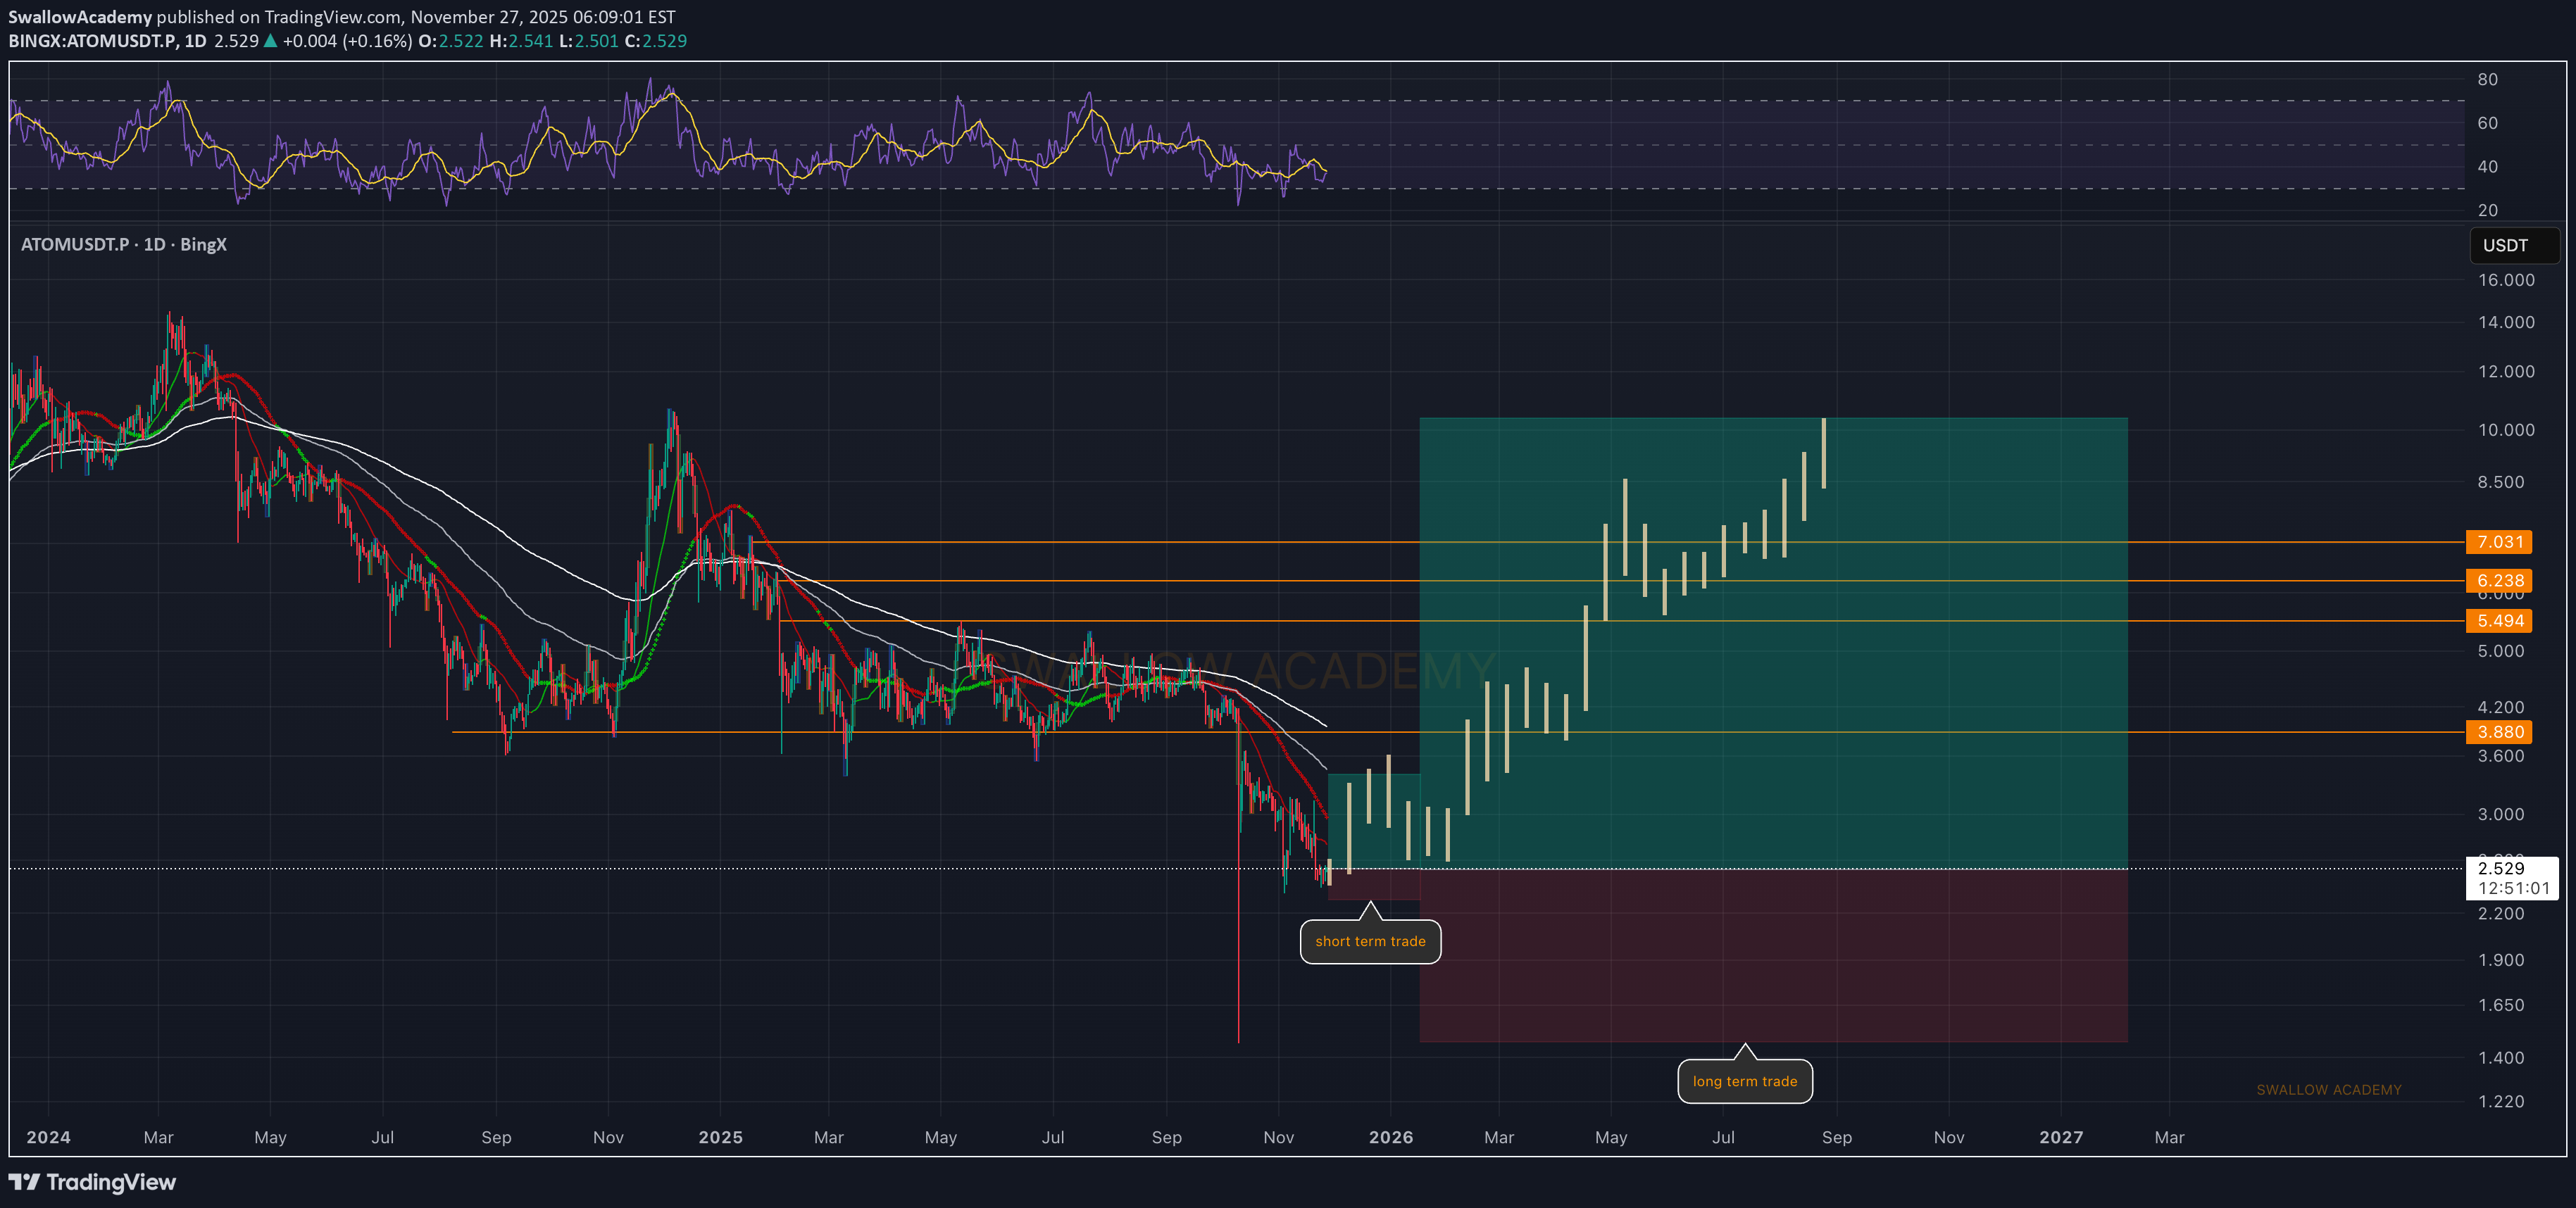
ATOM is finally showing signs of a reversal after that long downside stretch, and with this reaction we already have a short-term trading opportunity forming. For the long-term setup the idea stays the same, but we’d go with smaller leverage since the SL is naturally wider on higher-timeframe plays. If this momentum continues, buyers should aim to push price back into the unfilled zones near the EMAs — that’s where the real expansion could start. As long as this reversal holds, both short-term and long-term trades stay valid. Swallow Academy

CryptoAnalystSignal
تحلیل ATOM/USDT: آیا موج صعودی جدید در راه است؟ (سطوح کلیدی و اهداف قیمت)
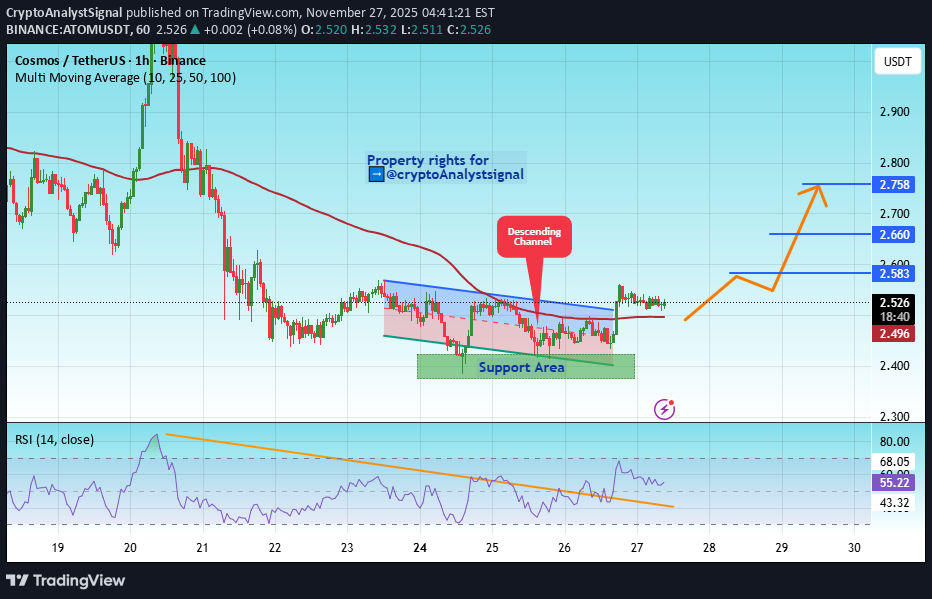
#ATOM The price is moving in a descending channel on the 1-hour timeframe. It has reached the lower boundary and is heading towards breaking above it, with a retest of the upper boundary expected. We have a downtrend on the RSI indicator, which has reached near the lower boundary, and an upward rebound is expected. There is a key support zone in green at 2.40. The price has bounced from this zone multiple times and is expected to bounce again. We have a trend towards stability above the 100-period moving average, as we are moving close to it, which supports the upward movement. Entry price: 2.51 First target: 2.58 Second target: 2.66 Third target: 2.75 Don't forget a simple principle: money management. Place your stop-loss below the support zone in green. For any questions, please leave a comment. Thank you.

tradecitypro
قیمت اتم (ATOM) در آستانه سقوط؟ حمایت حیاتی که نباید از دست برود!
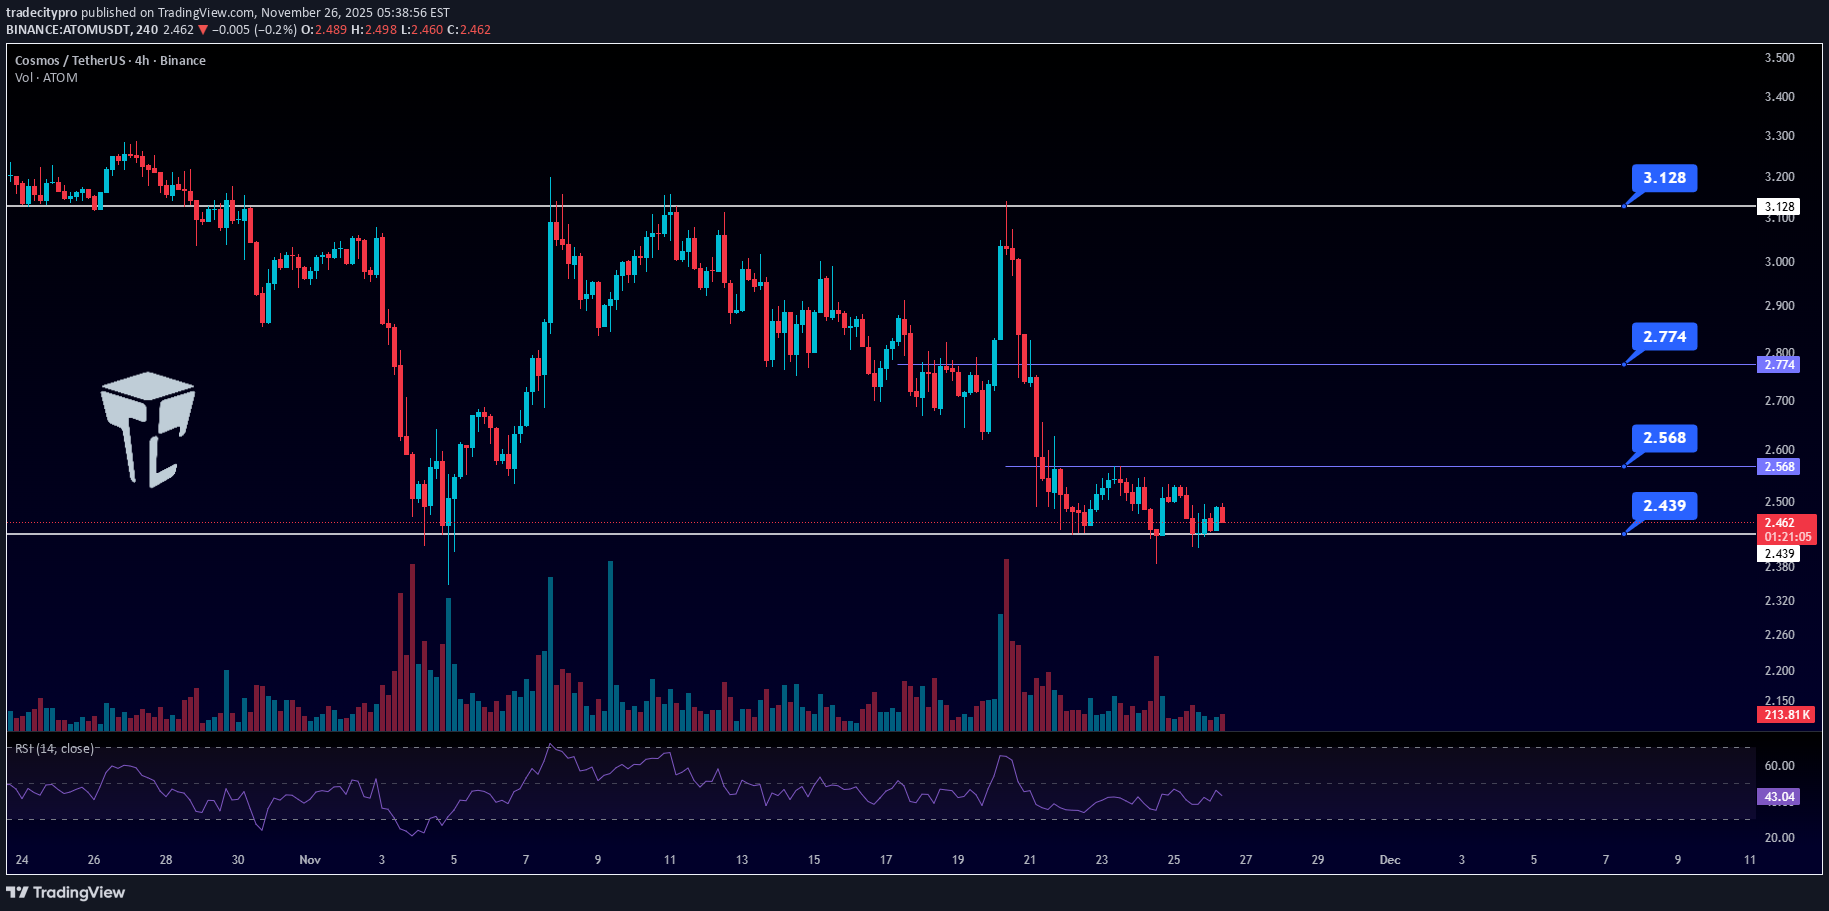
👋 Welcome to TradeCityPro! Let’s dive into the analysis of ATOM, one of the older coins in the crypto market, which is currently sitting on a very critical support level — essentially its last major support zone. 🌐 Bitcoin Overview Before we begin, let me remind you once again that at your request, we’ve moved the Bitcoin analysis section to a dedicated daily report — allowing us to analyze Bitcoin’s trend, dominance, and overall market sentiment in greater depth each day. In the higher timeframes, due to the recent heavy declines across the market, ATOM previously fell all the way to nearly $0, experiencing an extremely steep drop and entering a long consolidation phase afterward. Right now, price has once again reached the bottom of the range — the key support zone it has respected for a long time. This area, around $2.439, can be considered ATOM’s final line of defense. 🔻 Short Position A break below 2.439 gives a clear trigger for a short position. However, confirmation requires an increase in volume to validate the breakdown. 🔼 Long Position Due to the strong bearish structure, taking a long position is not the preferred option at the moment. But if price continues ranging and holds this support, a breakout above 2.568 can provide a valid long setup.
Disclaimer
Any content and materials included in Sahmeto's website and official communication channels are a compilation of personal opinions and analyses and are not binding. They do not constitute any recommendation for buying, selling, entering or exiting the stock market and cryptocurrency market. Also, all news and analyses included in the website and channels are merely republished information from official and unofficial domestic and foreign sources, and it is obvious that users of the said content are responsible for following up and ensuring the authenticity and accuracy of the materials. Therefore, while disclaiming responsibility, it is declared that the responsibility for any decision-making, action, and potential profit and loss in the capital market and cryptocurrency market lies with the trader.