
ATM
Atletico De Madrid Fan Token
| تریدر | نوع سیگنال | حد سود/ضرر | زمان انتشار | مشاهده پیام |
|---|---|---|---|---|
No results found. | ||||
Price Chart of Atletico De Madrid Fan Token
سود 3 Months :
سیگنالهای Atletico De Madrid Fan Token
Filter
Sort messages by
Trader Type
Time Frame

CryptoAnalystSignal
#ATM/USDT UPDATE
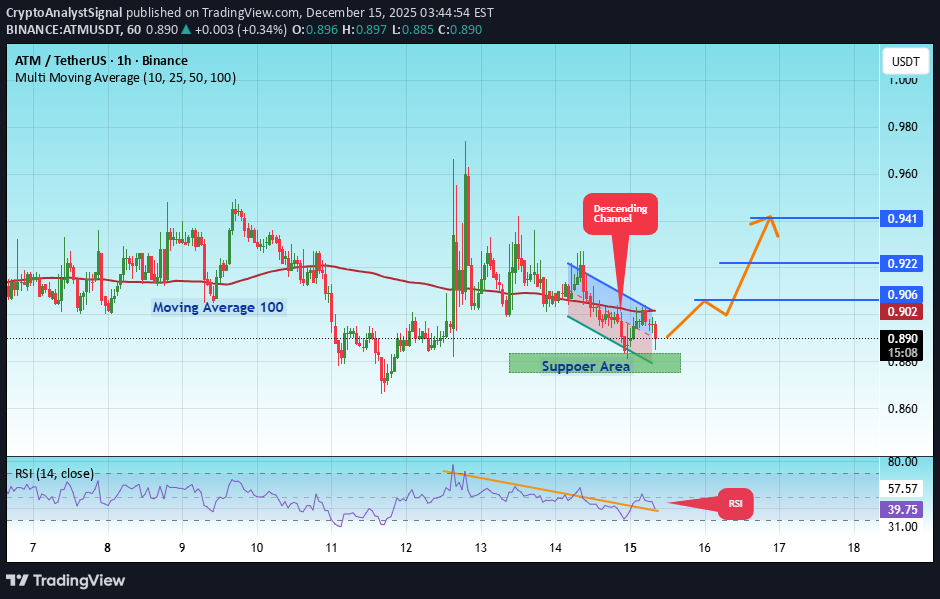
#ATM The price is moving in a descending channel on the 1-hour timeframe. It has reached the lower boundary and is heading towards breaking above it, with a retest of the upper boundary expected. We have a downtrend on the RSI indicator, which has reached near the lower boundary, and an upward rebound is expected. There is a key support zone in green at 0.880. The price has bounced from this level multiple times and is expected to bounce again. We have a trend towards consolidation above the 100-period moving average, as we are moving close to it, which supports the upward movement. Entry price: 0.888 First target: 0.906 Second target: 0.922 Third target: 0.941 Don't forget a simple principle: money management. Place your stop-loss below the support zone in green. For any questions, please leave a comment. Thank you.

Bithereum_io
ATMUSDT 1D
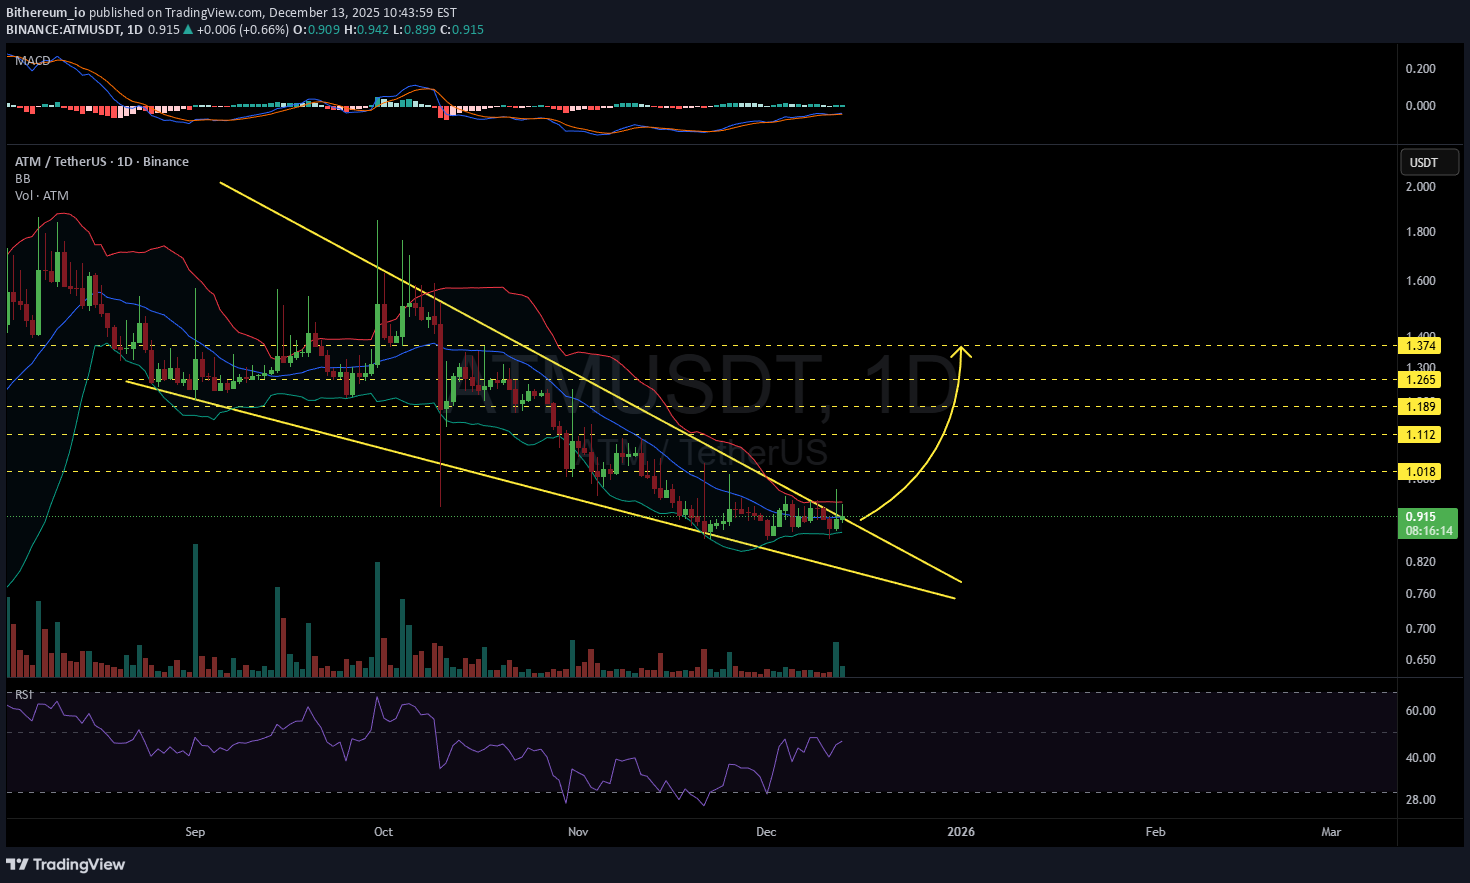
#ATM is moving inside a falling wedge pattern on the daily chart and is on the verge of breaking out above it. The Bollinger Bands are tightening, suggesting a major move may be ahead. In case of a breakout above the wedge, the potential targets are: 🎯 $1.018 🎯 $1.112 🎯 $1.189 🎯 $1.265 🎯 $1.374 ⚠️ Always remember to use a tight stop-loss and maintain proper risk management.

Strateg_
فانتوم توکنهای ورزشی در آستانه انفجار؟ سیگنالهای صعودی قوی برای ATM، CITY و JUV

As I mentioned in the last market review, the probability of sales for most coins and disruptions of ETH remains predominant. Against this background, the oversold ATM CITY ACM JUV fantokens are extremely interesting for speculators. The quarter opened above the supports, which gives a strong bullish signal. Quite large purchases are immediately observed against this background. When selling on ETH, there is an opportunity to shadow on CHZ to a retest of 0.041-425, which so far prevents x on fantokens. This can create new favorable prices for scalping. In particular, for ATM, there is a possibility of a pullback to a retest of the 1.25-35 range, which is the main support in this monthly candle. Next, you can have a new stable bullish reversal of the monthly candle from the middle of the month and consolidate the formed trend line. In the absence of a drawdown on ETH and CHZ, continued growth is possible from the middle of the week. CITY JUV and ACM did not give significant impulses to retest the resistances, which is why the probability of growth from current levels is slightly higher for them.

Alpha-GoldFX
ATMUSDT Forming Falling Wedge
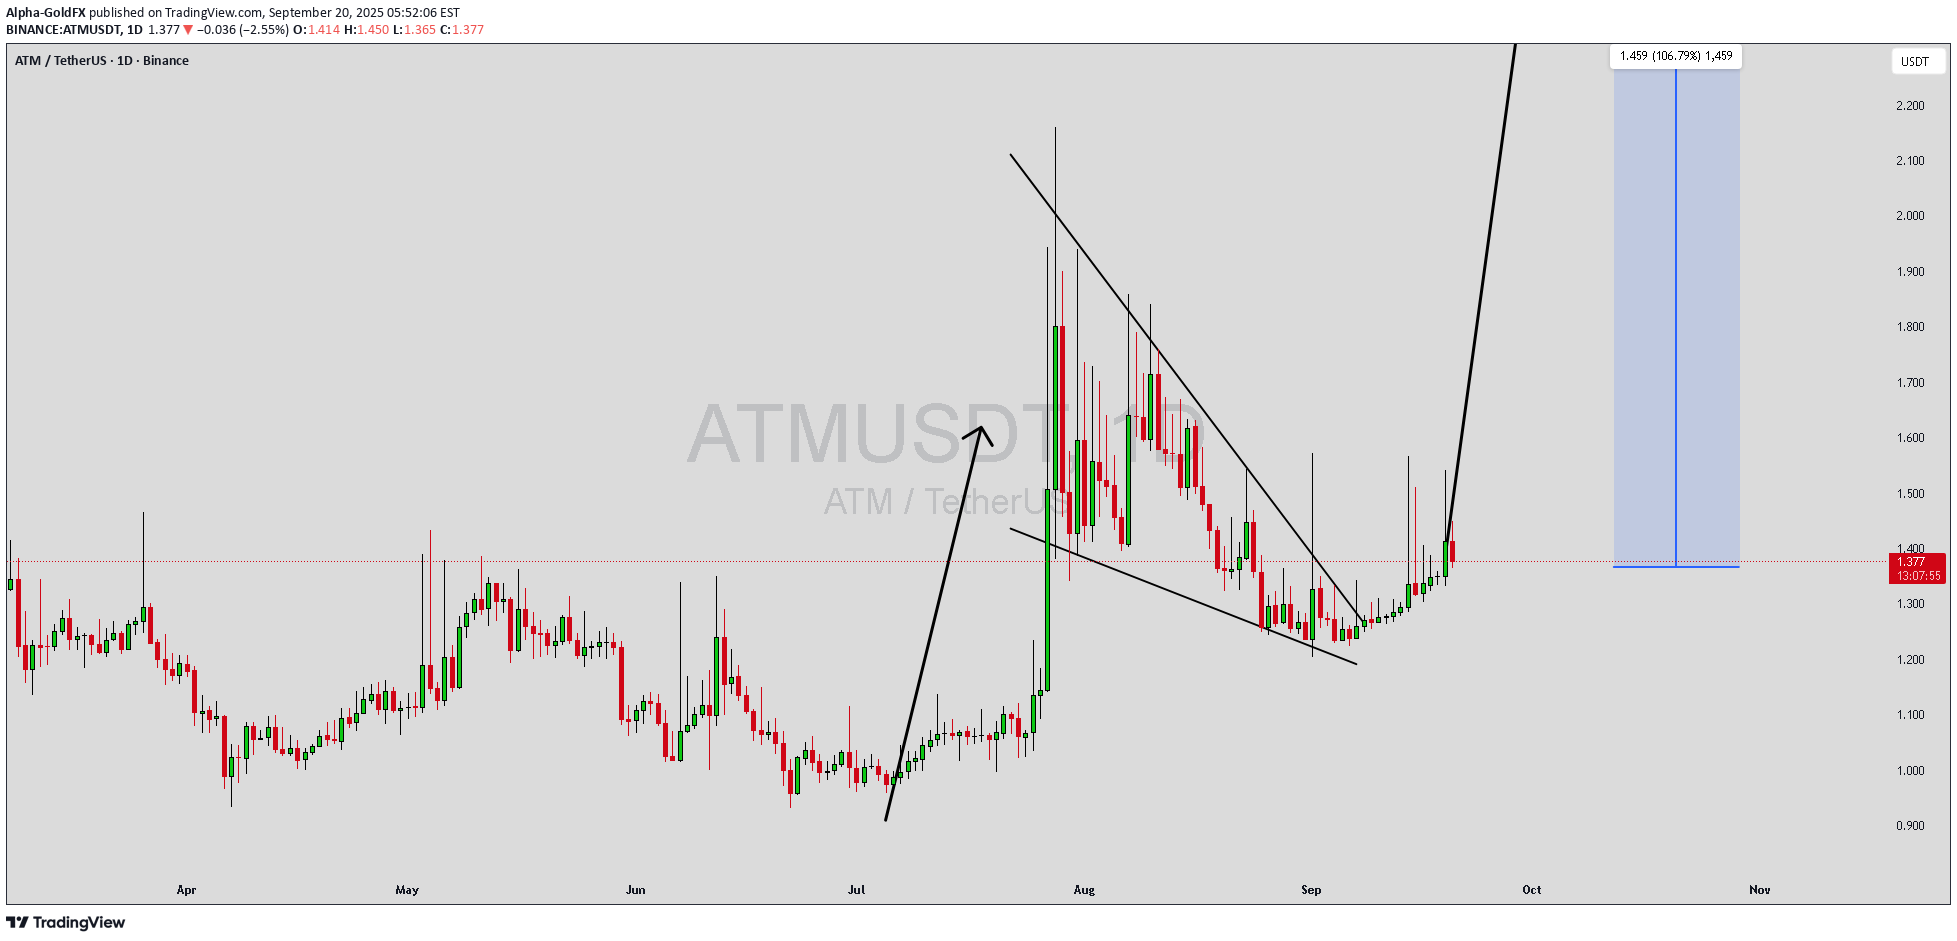
ATMUSDT is showing a classic falling wedge pattern, which is widely considered a strong bullish reversal signal in technical analysis. After a sustained downtrend, the price action is narrowing within a wedge, and this often leads to an explosive breakout to the upside. With good trading volume accompanying this formation, the conditions are aligning well for a potential sharp move higher once the breakout is confirmed. The projection suggests a possible gain of 90% to 100%+, making this setup highly attractive for traders looking for strong risk-to-reward opportunities. Falling wedges often mark the end of bearish pressure and the beginning of a new bullish phase, and the current price structure of ATMUSDT is reflecting this shift. Investor interest is growing around this project, further strengthening the bullish outlook. If the wedge breakout is sustained with solid momentum, it could open the door to a powerful rally and attract even more market participants. This makes ATMUSDT a pair worth close attention in the coming sessions. ✅ Show your support by hitting the like button and ✅ Leaving a comment below! (What is You opinion about this Coin) Your feedback and engagement keep me inspired to share more insightful market analysis with you!

CryptoWithJames
ATMUSDT UPDATE
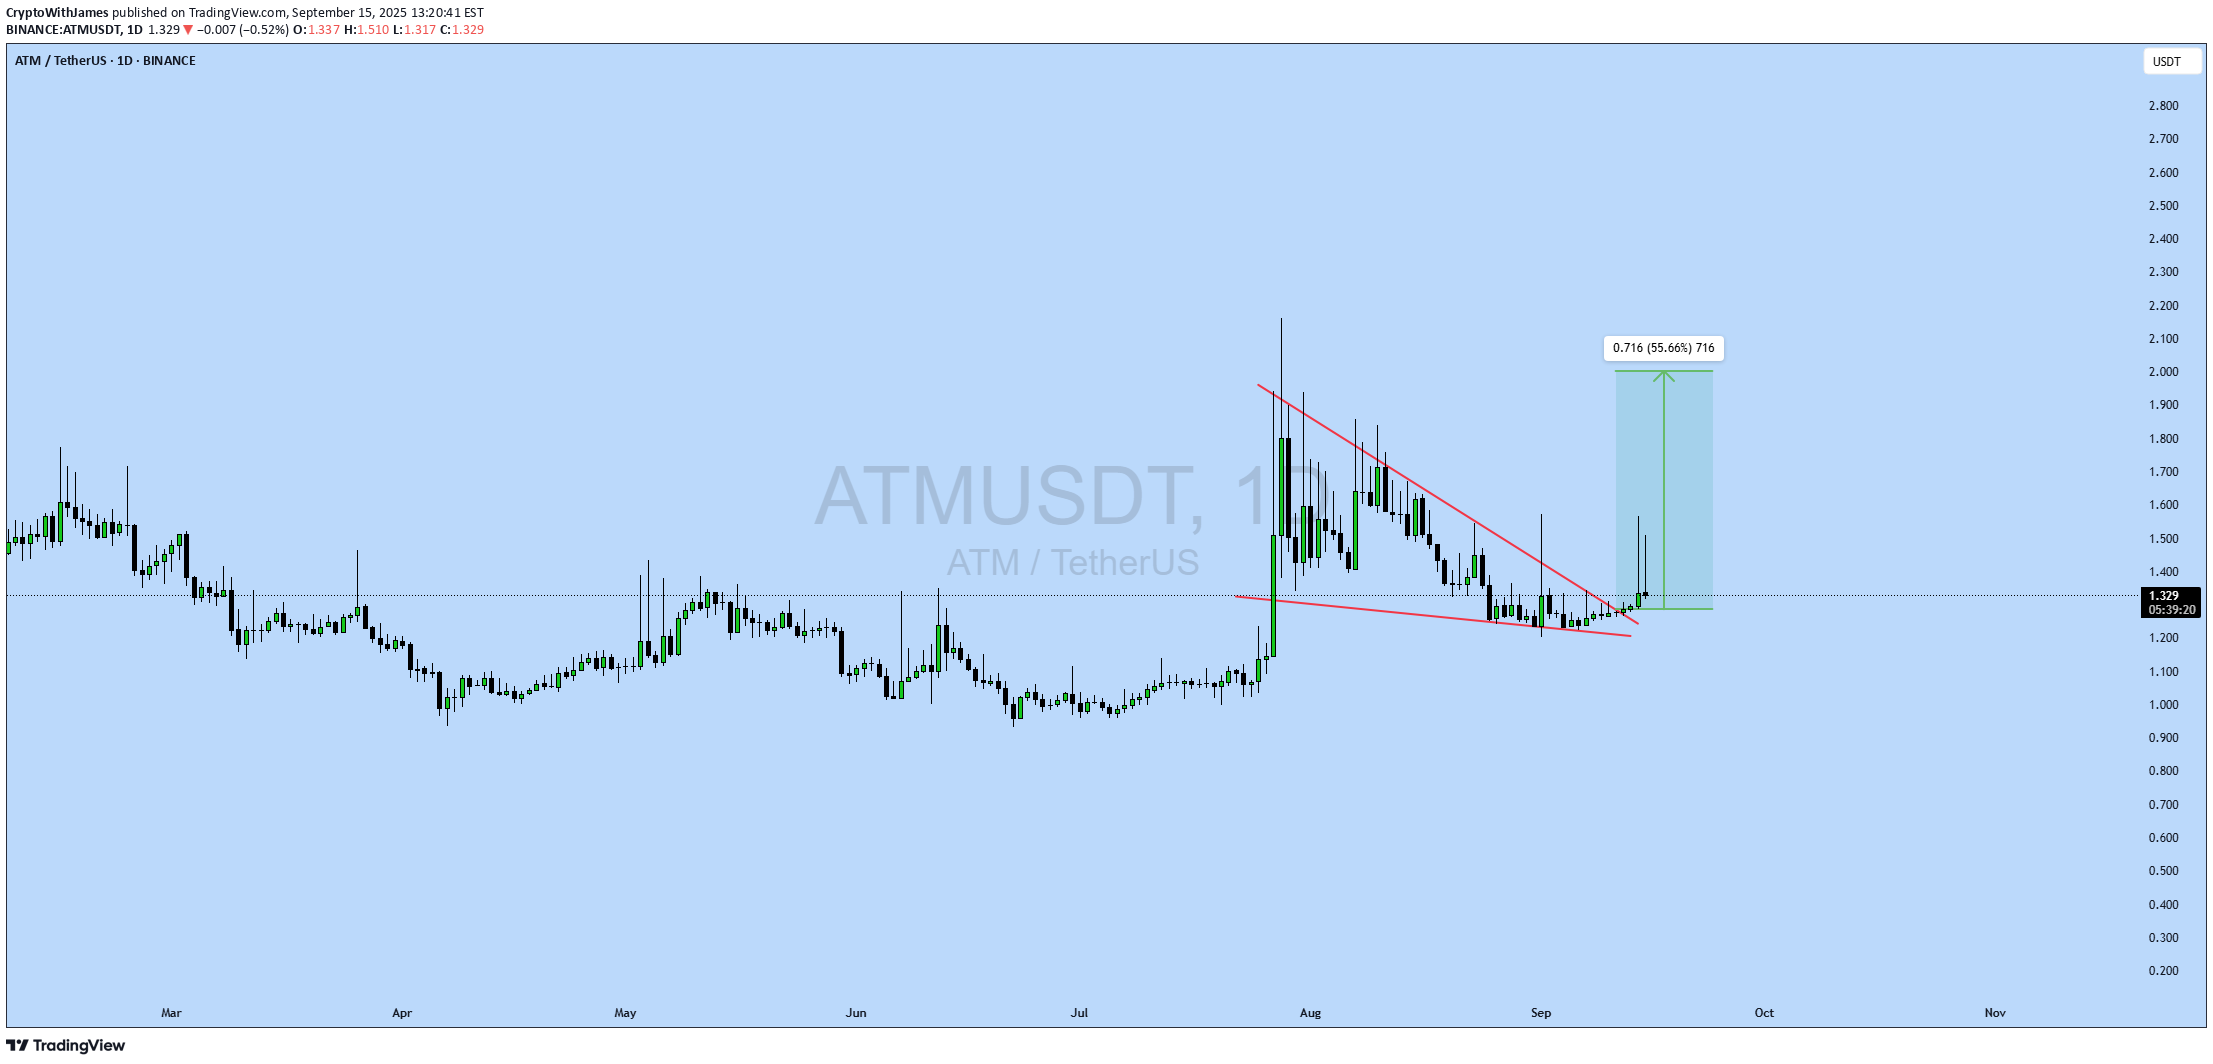
#ATM UPDATE ATM Technical Setup Pattern: Bullish Falling Wedge Pattern Current Price: $1.325 Target Price: $2.04 Target % Gain: 55.66% ATM is breaking out of a falling wedge on the 1D timeframe. Current price is $1.325 with a target near $2.04, showing over 55% potential upside. The breakout confirms bullish momentum and continuation is favored if support holds. Always use proper risk management. Time Frame: 1D Risk Management Tip: Always use proper risk management.
Alpha-GoldFX
ATMUSDT Forming Falling Wedge
ATMUSDT is showing a classic falling wedge pattern, which is widely considered a strong bullish reversal signal in technical analysis. After a sustained downtrend, the price action is narrowing within a wedge, and this often leads to an explosive breakout to the upside. With good trading volume accompanying this formation, the conditions are aligning well for a potential sharp move higher once the breakout is confirmed. The projection suggests a possible gain of 90% to 100%+, making this setup highly attractive for traders looking for strong risk-to-reward opportunities. Falling wedges often mark the end of bearish pressure and the beginning of a new bullish phase, and the current price structure of ATMUSDT is reflecting this shift. Investor interest is growing around this project, further strengthening the bullish outlook. If the wedge breakout is sustained with solid momentum, it could open the door to a powerful rally and attract even more market participants. This makes ATMUSDT a pair worth close attention in the coming sessions. ✅ Show your support by hitting the like button and ✅ Leaving a comment below! (What is You opinion about this Coin) Your feedback and engagement keep me inspired to share more insightful market analysis with you!
Alpha-GoldFX
ATMUSDT Forming Falling Wedge

ATMUSDT is currently forming a classic falling wedge pattern, which is widely recognized as a strong bullish reversal signal in technical analysis. After a prolonged corrective phase, the price has started showing signs of accumulation within this wedge formation, and the breakout potential looks increasingly favorable. With good trading volume supporting the structure, the probability of a powerful upside rally has significantly increased, matching the expected gain range of 80% to 90%+. The falling wedge setup suggests that selling pressure is weakening while buyers are gradually stepping back into the market. This compression of price action often precedes a breakout rally, where momentum can accelerate quickly once resistance is broken. If confirmed, ATMUSDT could initiate a strong upward surge, attracting both short-term traders and long-term investors who are looking for high-risk, high-reward setups. Investor sentiment toward this project has been improving as well, with increasing market activity indicating growing confidence in its upside potential. The combination of technical strength, good liquidity, and rising investor interest creates a favorable environment for a strong bullish move. Traders should watch closely for breakout confirmation as it could mark the beginning of a sharp trend reversal. ✅ Show your support by hitting the like button and ✅ Leaving a comment below! (What is You opinion about this Coin) Your feedback and engagement keep me inspired to share more insightful market analysis with you!

Zorroreny
ATM - meme coins in accumulation range
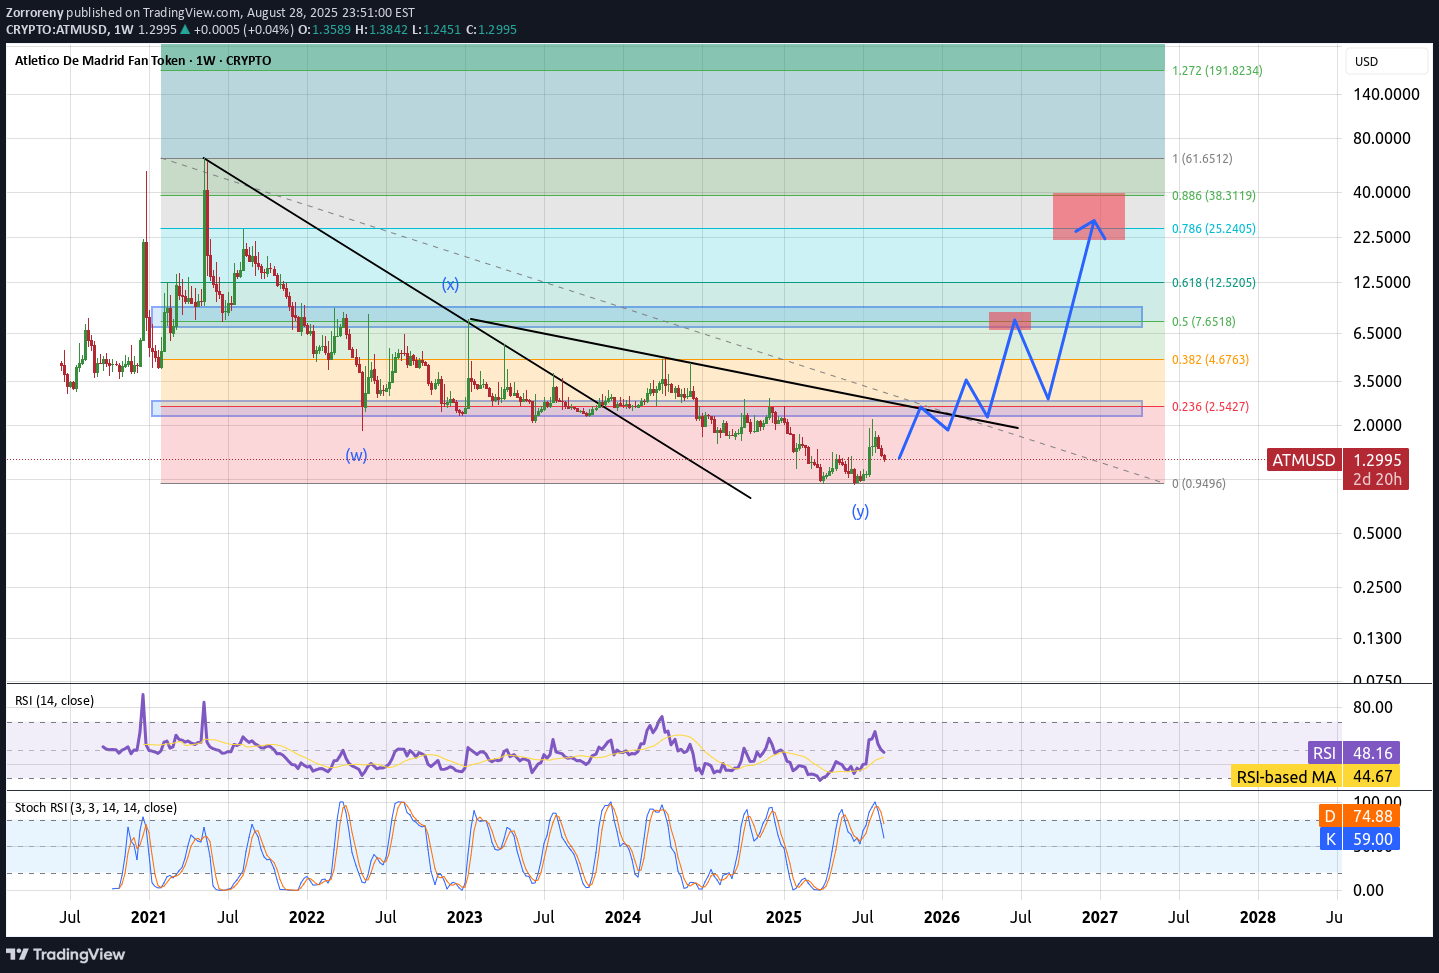
ATM doing what it seems like rounded bottom (accumulatoin pattern). Meme coins run last (1st BTC, 2nd ETH, 3rd major alts, 4th everything...). We can also see makings of C-Fork pattern. If we bounce here I expect breakout of 2nd diag line to test X-wave pivot and later test of fibb 0,786/0,886 range.
CryptoWithJames
ATMUSDT UPDATE
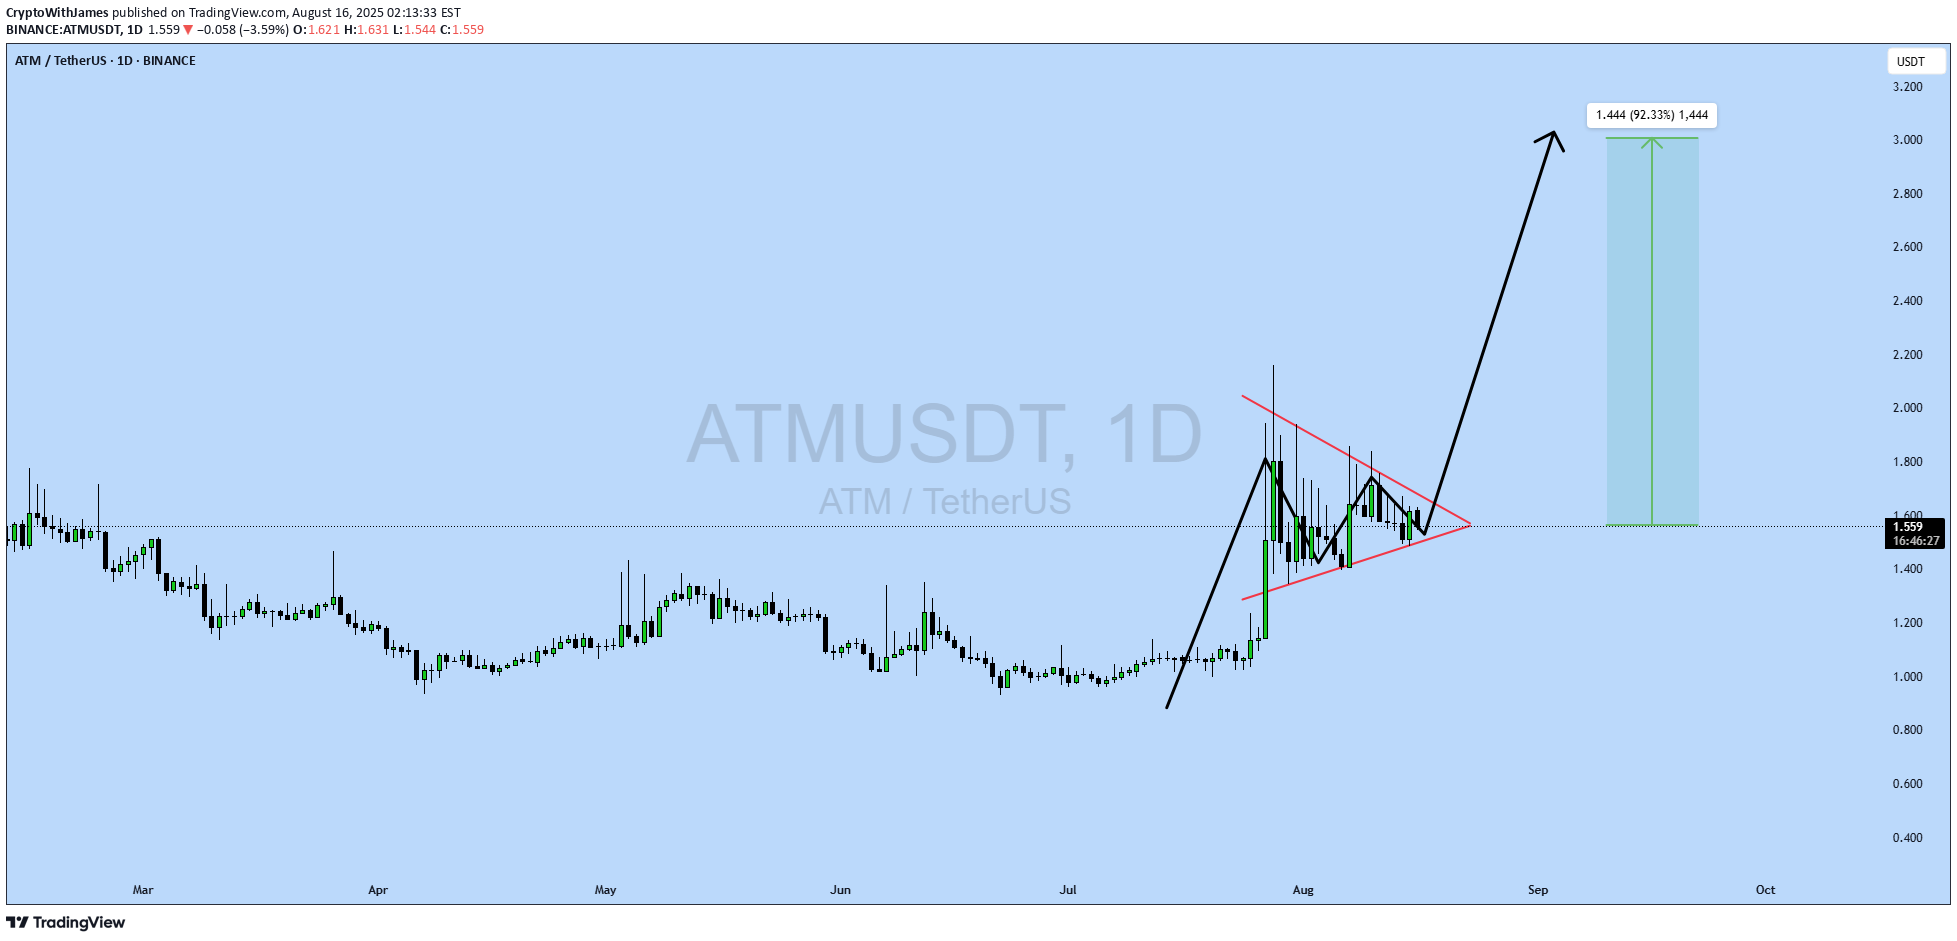
#ATM UPDATE ATM Technical Setup Pattern: Bullish Pennant pattern Current Price: $1.565 Target Price: $3.00 Target % Gain: 92.33% Technical Analysis: ATM is forming a bullish pennant on the 1D chart. After a strong impulse move, the price is consolidating within a narrowing range. A breakout from this structure backed by a strong trend continuation is likely, with volume supporting momentum. Time Frame: 1D Risk Management Tip: Always use proper risk management.
Alpha-GoldFX
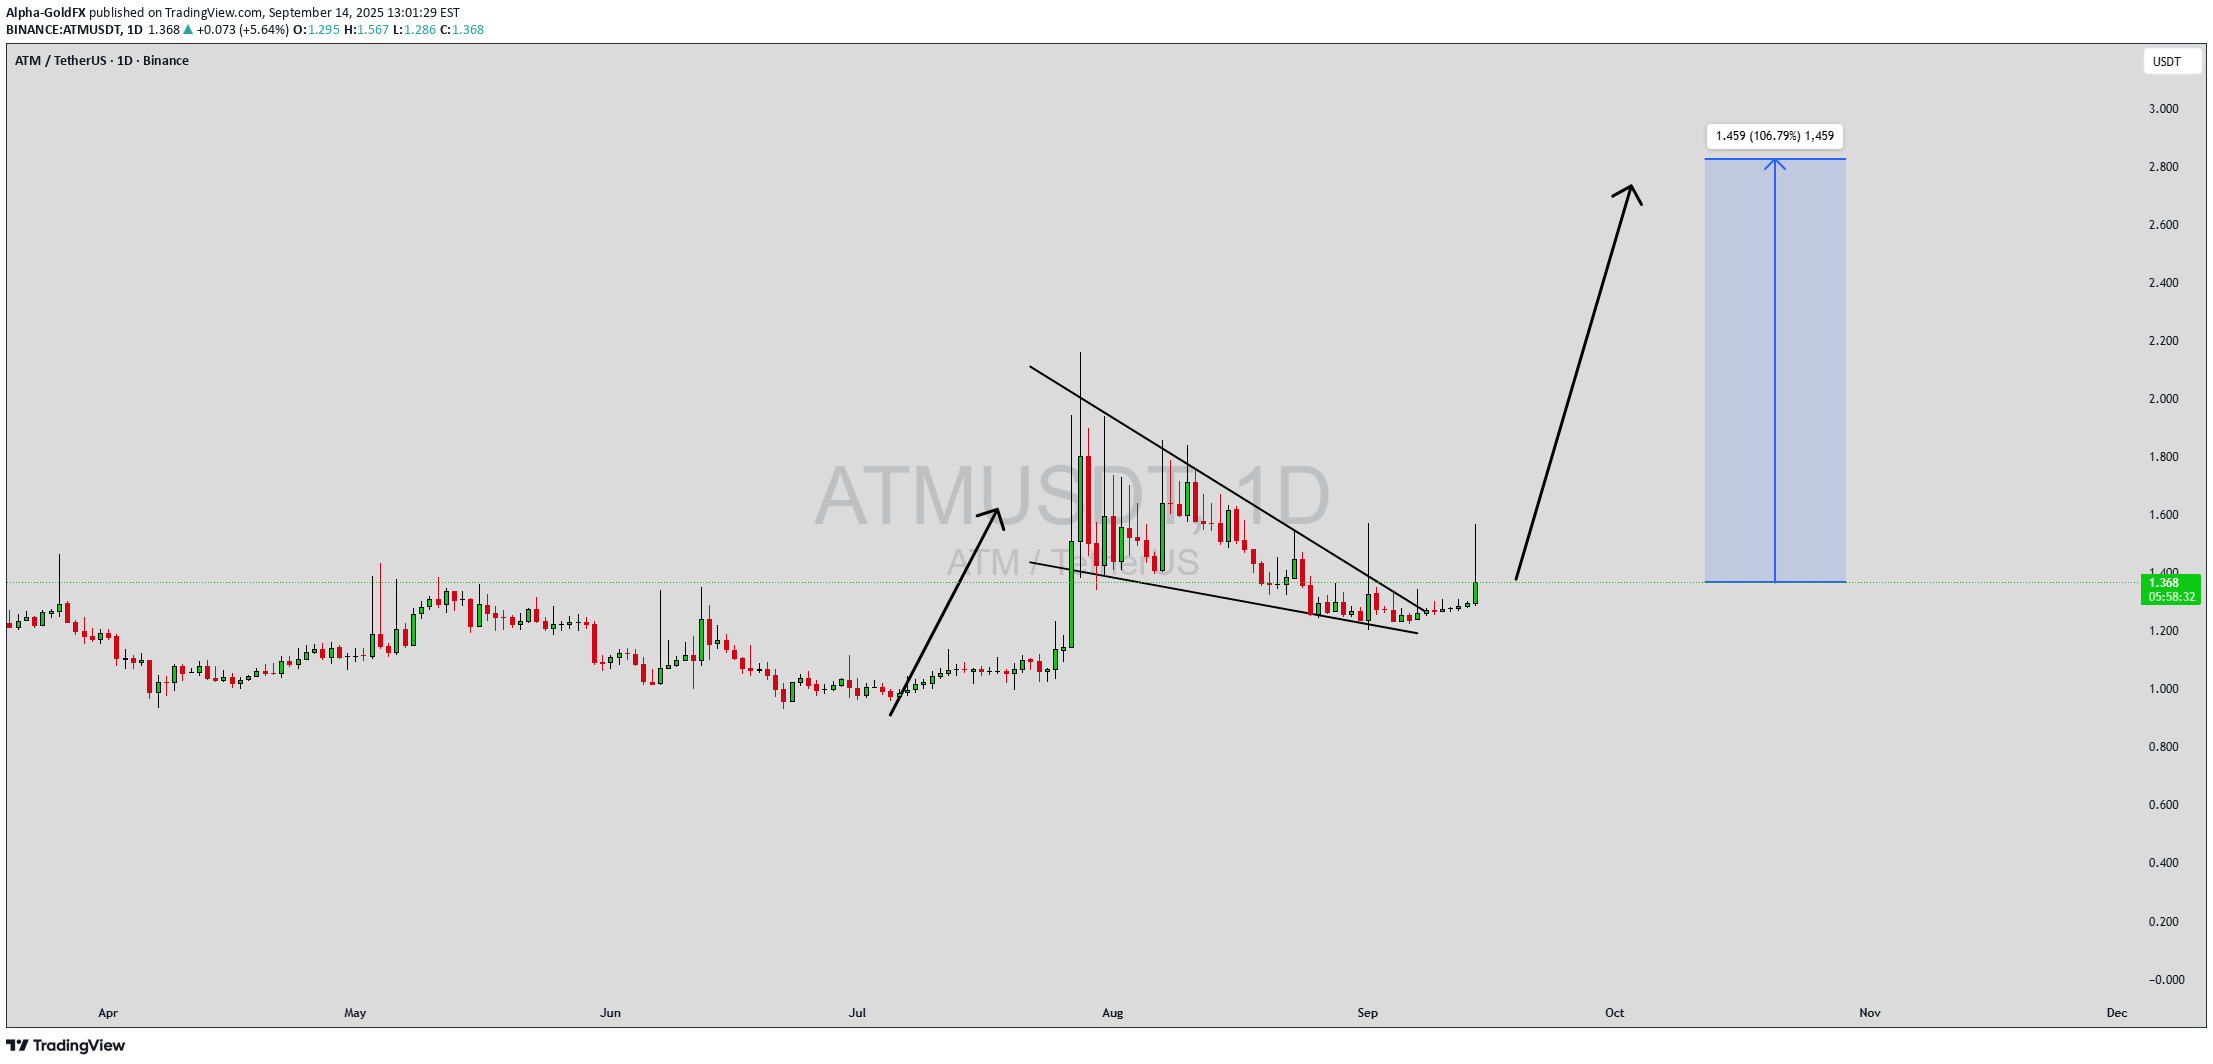
ATMUSDT Forming Descending Triangle

ATMUSDT is currently tracing a descending triangle pattern, typically viewed as a bearish continuation formation—but it can also flip into a bullish reversal when occurring at market lows or consolidation zones. This chart structure features a series of lower highs pushing into a flat support level, indicating that bullish interest is holding firm despite weakening upside momentum. A breakout above the upper trendline, particularly backed by strong volume, would signal a trend shift. Volume has stayed solid throughout the pattern's formation, suggesting accumulation near support. If ATM can convincingly break upward through the upper boundary, we could see a robust rally in the range of 90% to 100%+—a substantial opportunity for swing traders. Investor focus is heating up, with technical setups like symmetrical triangles and ABCD formations hinting at upside potential. Such pattern recognition, combined with rising volume and sentiment, makes this a high-probability trade setup. Watch for a breakout above resistance with confirming volume and consider it a possible entry zone. Proper risk control around the support area will be key in capitalizing on this potential rally. ✅ Show your support by hitting the like button and ✅ Leaving a comment below! (What is your opinion about this Coin) Your feedback and engagement keep me inspired to share more insightful market analysis with you!
Disclaimer
Any content and materials included in Sahmeto's website and official communication channels are a compilation of personal opinions and analyses and are not binding. They do not constitute any recommendation for buying, selling, entering or exiting the stock market and cryptocurrency market. Also, all news and analyses included in the website and channels are merely republished information from official and unofficial domestic and foreign sources, and it is obvious that users of the said content are responsible for following up and ensuring the authenticity and accuracy of the materials. Therefore, while disclaiming responsibility, it is declared that the responsibility for any decision-making, action, and potential profit and loss in the capital market and cryptocurrency market lies with the trader.