
ATH
Aethir
| تریدر | نوع سیگنال | حد سود/ضرر | زمان انتشار | مشاهده پیام |
|---|---|---|---|---|
No results found. | ||||
Price Chart of Aethir
سود 3 Months :
سیگنالهای Aethir
Filter
Sort messages by
Trader Type
Time Frame

CryptoAnalystSignal
رمز ارز ATH: آیا آماده جهش بزرگ از منطقه طلایی است یا سقوط عمیق در راه است؟
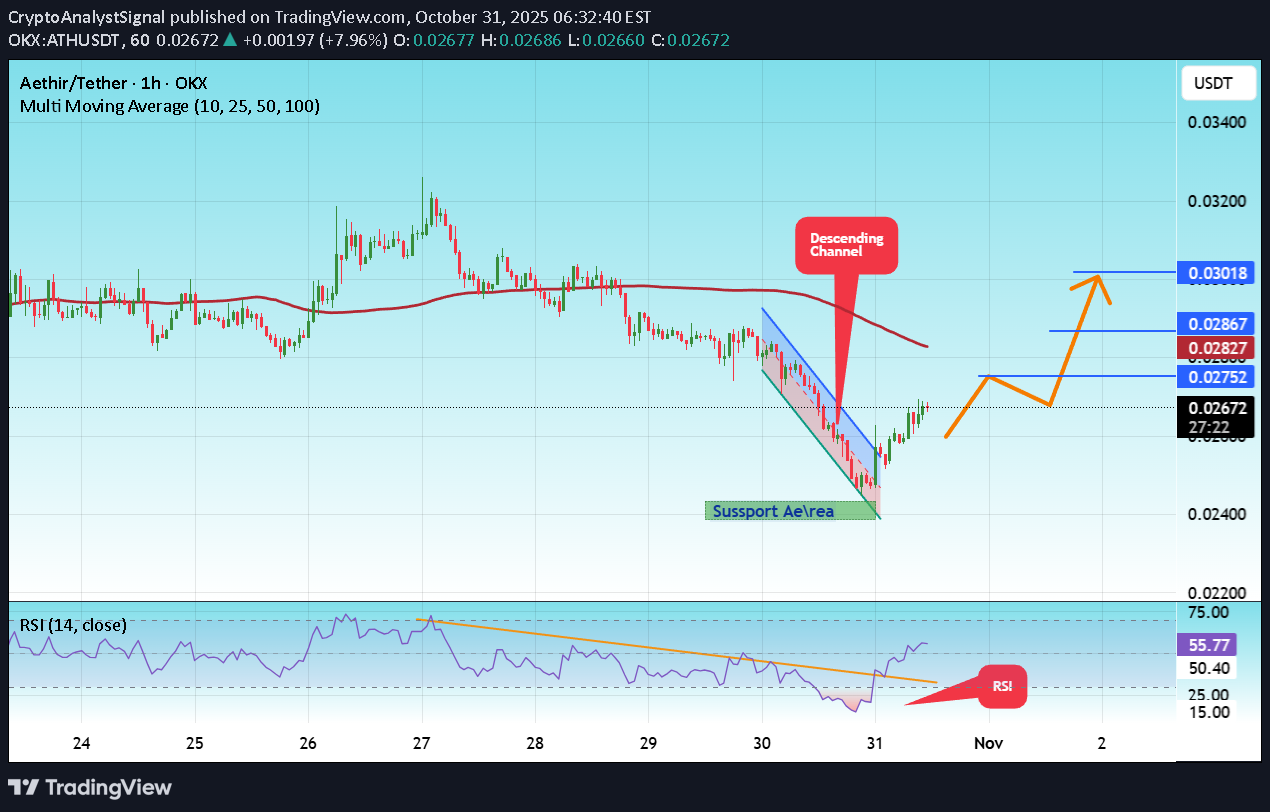
#ATH The price is moving in a descending channel on the 1-hour timeframe and is expected to break out and continue upwards. We have a trend to stabilize above the 100-period moving average again. We have a downtrend on the RSI indicator, which supports an upward move if it breaks above it. We have a key support zone in green that pushed the price higher at 0.02400. Entry price: 0.02650 First target: 0.02752 Second target: 0.02860 Third target: 0.03018 For risk management, don't forget your stop-loss and money management. The stop-loss is below the support zone in green. Upon reaching the first target, take some profit and then change your stop-loss order to an entry order. For any questions, please comment. Thank you.#ATH First target: 0.02752 Reached Second target: 0.02860 Reached Third target: 0.03018 Reached

CryptoNuclear
ATH در منطقه طلایی: انفجار صعودی یا سقوط بزرگ؟ معامله حیاتی پیش رو!
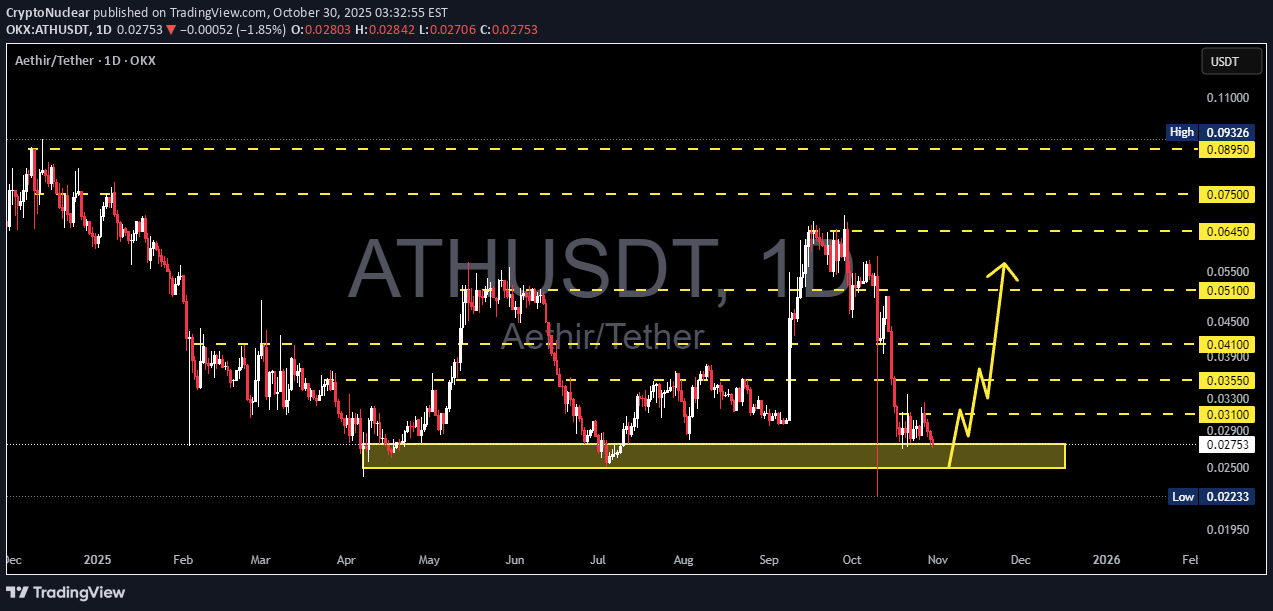
ATH has once again returned to the golden demand zone between 0.0275–0.025, a historically critical area that has triggered multiple price reversals in the past. This is not just another support level — it’s the last stronghold of buyers on the daily timeframe. Each time price revisited this region, we saw strong reactions, suggesting institutional accumulation and heavy buying pressure. However, this time the bearish momentum remains dominant, and sellers are still in control on the higher structure. Interestingly, there’s a long lower wick indicating a liquidity sweep — meaning stop losses were taken below the zone before price quickly recovered. This often signals the beginning of a potential reversal phase. --- Technical Structure & Key Observations Overall trend: Still bearish (series of lower highs and lower lows). Critical zone: 0.0275–0.025 (highlighted yellow box) — major demand area. Candle structure: Multiple long lower wicks suggesting demand absorption. Current formation: Sideways consolidation between 0.025–0.031 — breakout on either side will define the next major move. Key levels to watch: Immediate resistance: 0.031 – 0.033 Mid resistance: 0.0355 – 0.041 Strong resistance: 0.051 – 0.0645 Next support: 0.0223 --- Bullish Scenario – “Rebound From the Abyss” A bullish setup will form if price successfully holds above 0.0275–0.025 and prints a strong bullish engulfing candle on the daily close. That would confirm renewed buyer strength within the major demand area. 🎯 Upside targets: Target 1: 0.031 (minor breakout confirmation) Target 2: 0.0355 Target 3: 0.041 — potential trend reversal zone 📉 Invalidation: Daily close below 0.025. 👉 Note: If volume rises along with a solid green candle above 0.031, expect a swift move toward 0.041. --- Bearish Scenario – “Breakdown Into the Abyss” If buyers fail to defend the golden zone, a confirmed daily close below 0.025 with strong volume would signal a continuation of the downtrend. This could trigger another wave of distribution and deeper correction. 🎯 Downside targets: Target 1: 0.0223 (major local low) Target 2: Below 0.020 — potential capitulation zone 📈 Invalidation: Strong rebound and daily close back above 0.031. --- Technical Conclusion ATH is standing at a make-or-break level that will define its next trend direction. If the golden demand zone holds, we could see a powerful technical rebound and possible short squeeze. But if this level gives way, expect a deeper move toward the 0.022 range. This is the “do or die” moment for ATH bulls. --- #ATH #ATHUSDT #CryptoAnalysis #TechnicalAnalysis #PriceAction #SupportZone #BreakoutOrBreakdown #CryptoTrading #SmartMoney #LiquiditySweep #SwingTrading

zainmain
چرا این ارز دیجیتال را با تمام توان میخرم؟ راز فشار خریدهای روزانه ATH فاش شد!
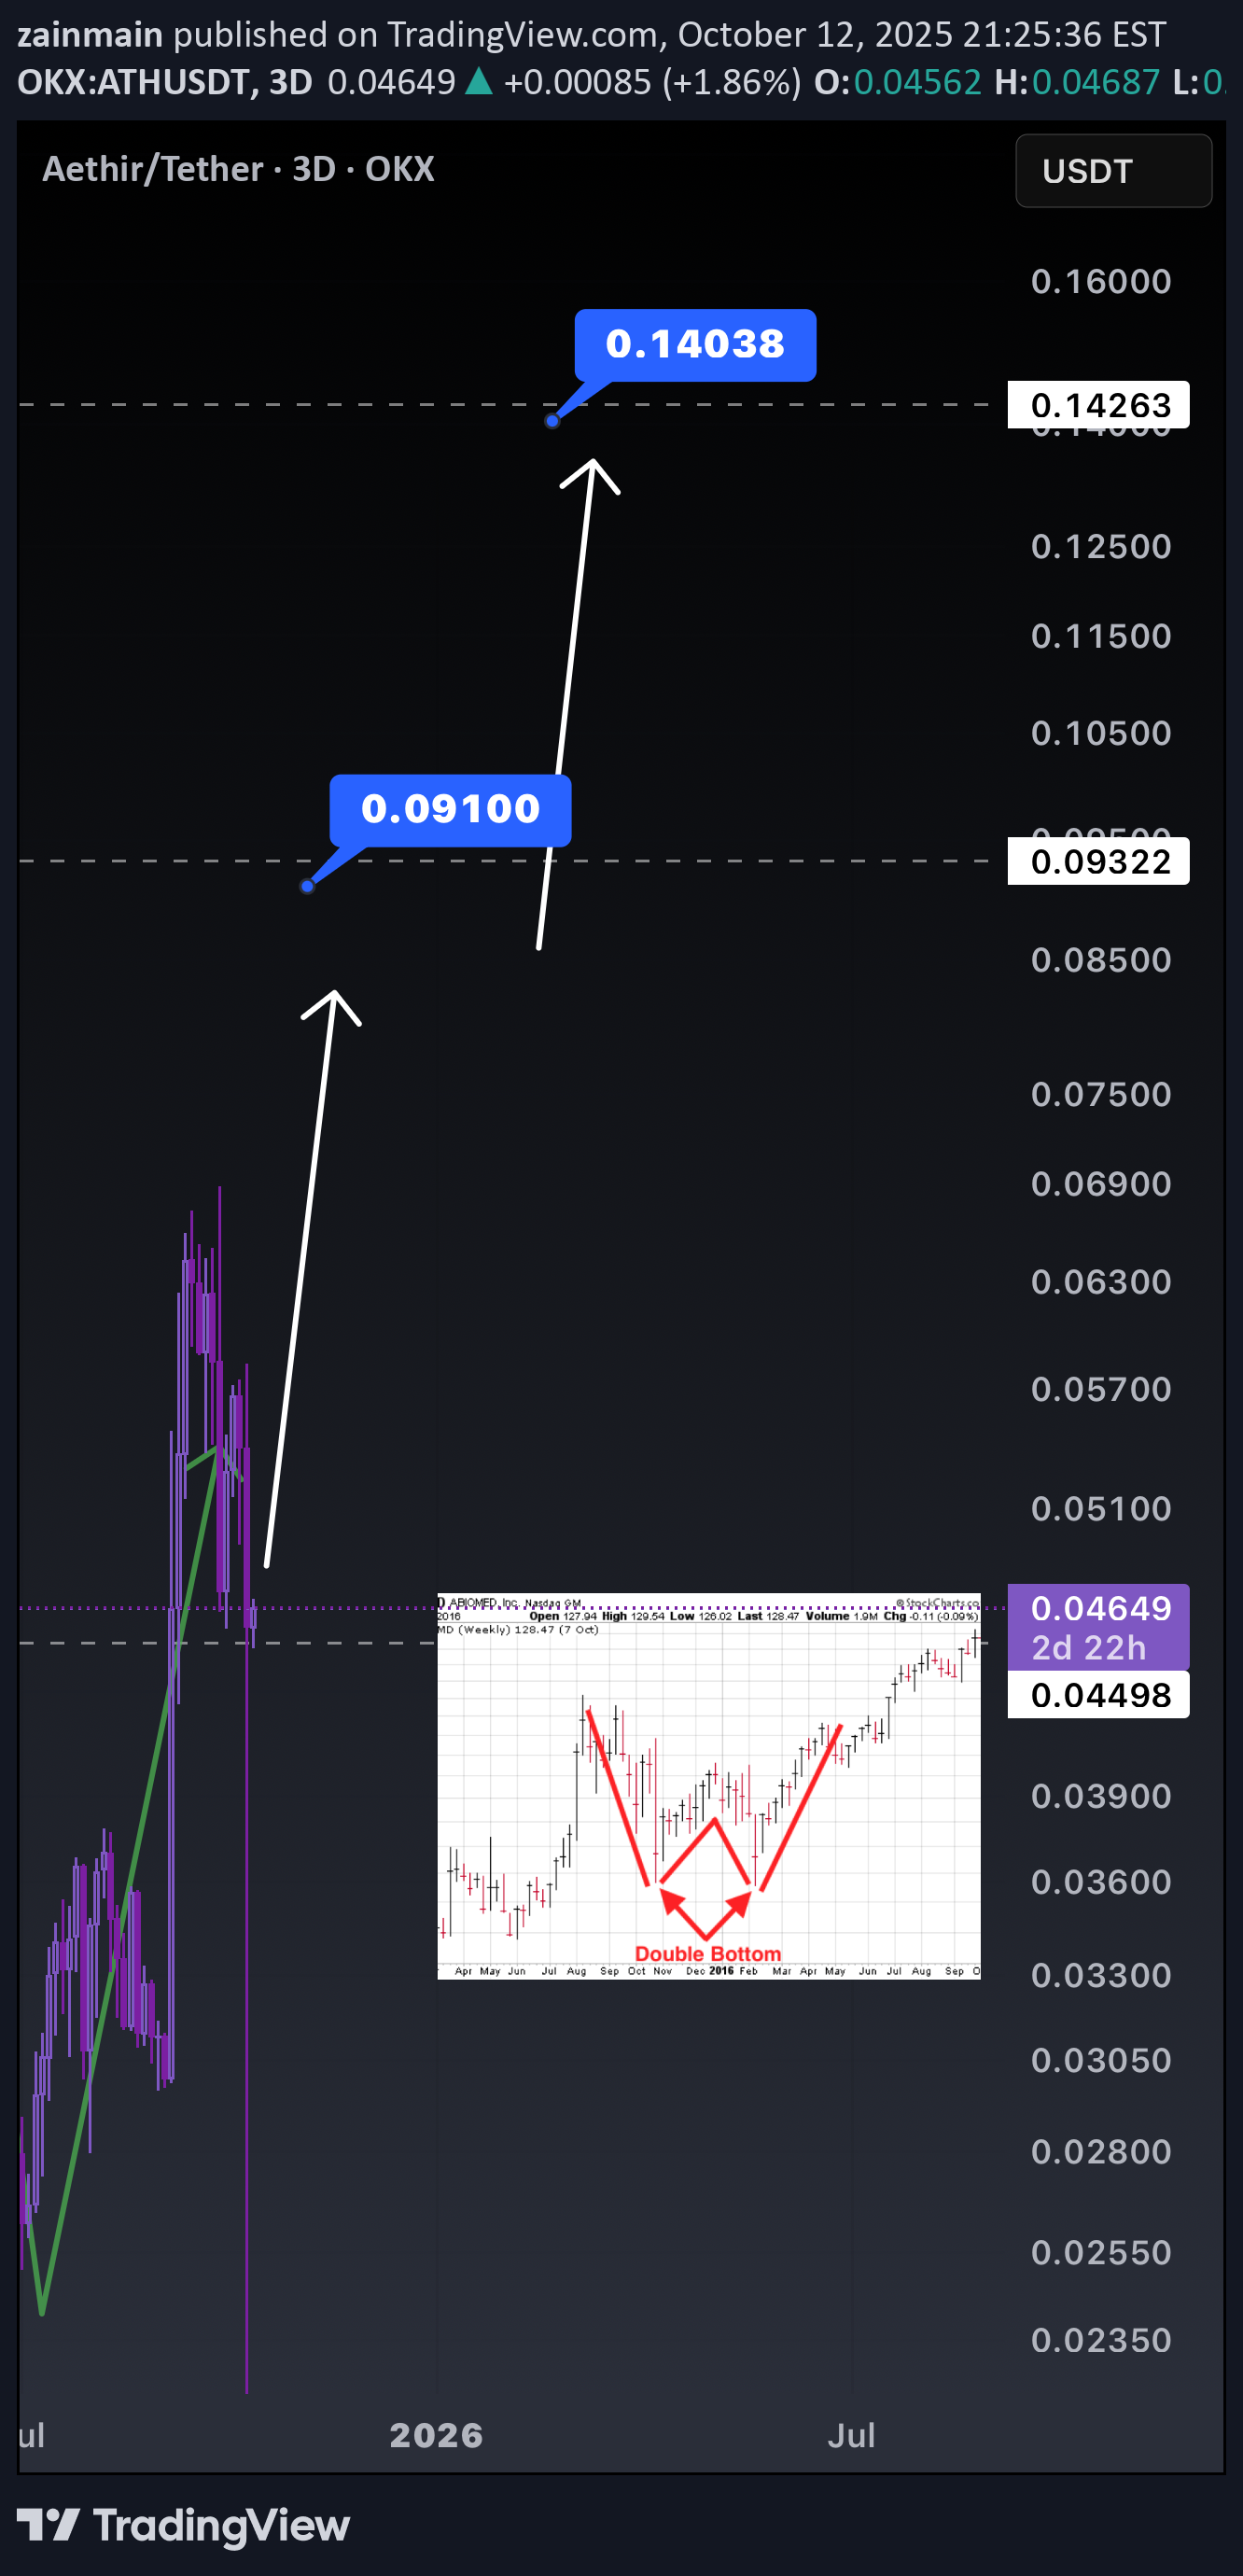
🚀 After the recent market crash, I’ve become a lot more careful about what I buy. I’m done chasing random pumps and focusing only on projects with real revenue, real buy pressure, and institutional alignment. HyperLiquid showed what consistent buybacks can do. They used 97% of all platform revenue to buy back HYPE every day, roughly $1–2M daily. The result? HYPE climbed from $1 to over $60 and the market cap passed $20B, all driven by organic buy pressure. Now Aethir looks positioned for something similar but with real business fundamentals behind it. Aethir’s new Digital Asset Treasury (DAT), connected to the NASDAQ-listed Predictive Oncology ( POAI ), is designed to accumulate ATH directly from the open market as part of its Strategic Compute Reserve. According to Aethir’s CEO, the DAT plans to deploy around $45M over 45 days to buy ATH , roughly $1M per day in steady accumulation. That alone creates consistent buy pressure, but the bigger story is how the DAT actually makes money. Unlike most digital asset treasuries, Aethir DAT generates real revenue. It uses ATH tokens to reserve GPU compute power on the Aethir network, rents that compute to AI companies for dollars, and then uses every dollar earned to buy back ATH on the open market again. Each of those buybacks also triggers a 20% matching grant from the Aethir Foundation, creating a powerful loop: 1️⃣ DAT buys ATH on the market 2️⃣ The Foundation adds 20% more tokens 3️⃣ DAT rents GPU compute to AI clients 4️⃣ Clients pay in USD revenue 5️⃣ DAT uses that revenue to buy even more ATH 6️⃣ The loop repeats, creating a self-reinforcing cycle of revenue and token demand That is the DAT advantage. It connects real-world revenue to on-chain buy pressure, aligning token growth with actual business success. On top of that, Aethir reported $166M in annual revenue, which is massive for any crypto project and one of the highest in the industry’s history. Now think about this. If a $1–2 million daily buyback pressure could move a $20B FDV token like HYPE from $1 to $60, imagine what that level of buying power could do for a token with a $600M market cap like $ATH. I chose ATH because it’s not a meme, not vaporware, and not a promise. It’s an operational business with active revenue, institutional backing, and built-in buying support at least through this initial phase. The institutionalization of decentralized infrastructure has begun. 💎 ATH could represent the next “daily buyback” narrative, this time powered by real cash flow. Not financial advice. Just sharing why I’m focusing on real revenue and real demand after this crash.

Amjad4Ali


WaveRiders2


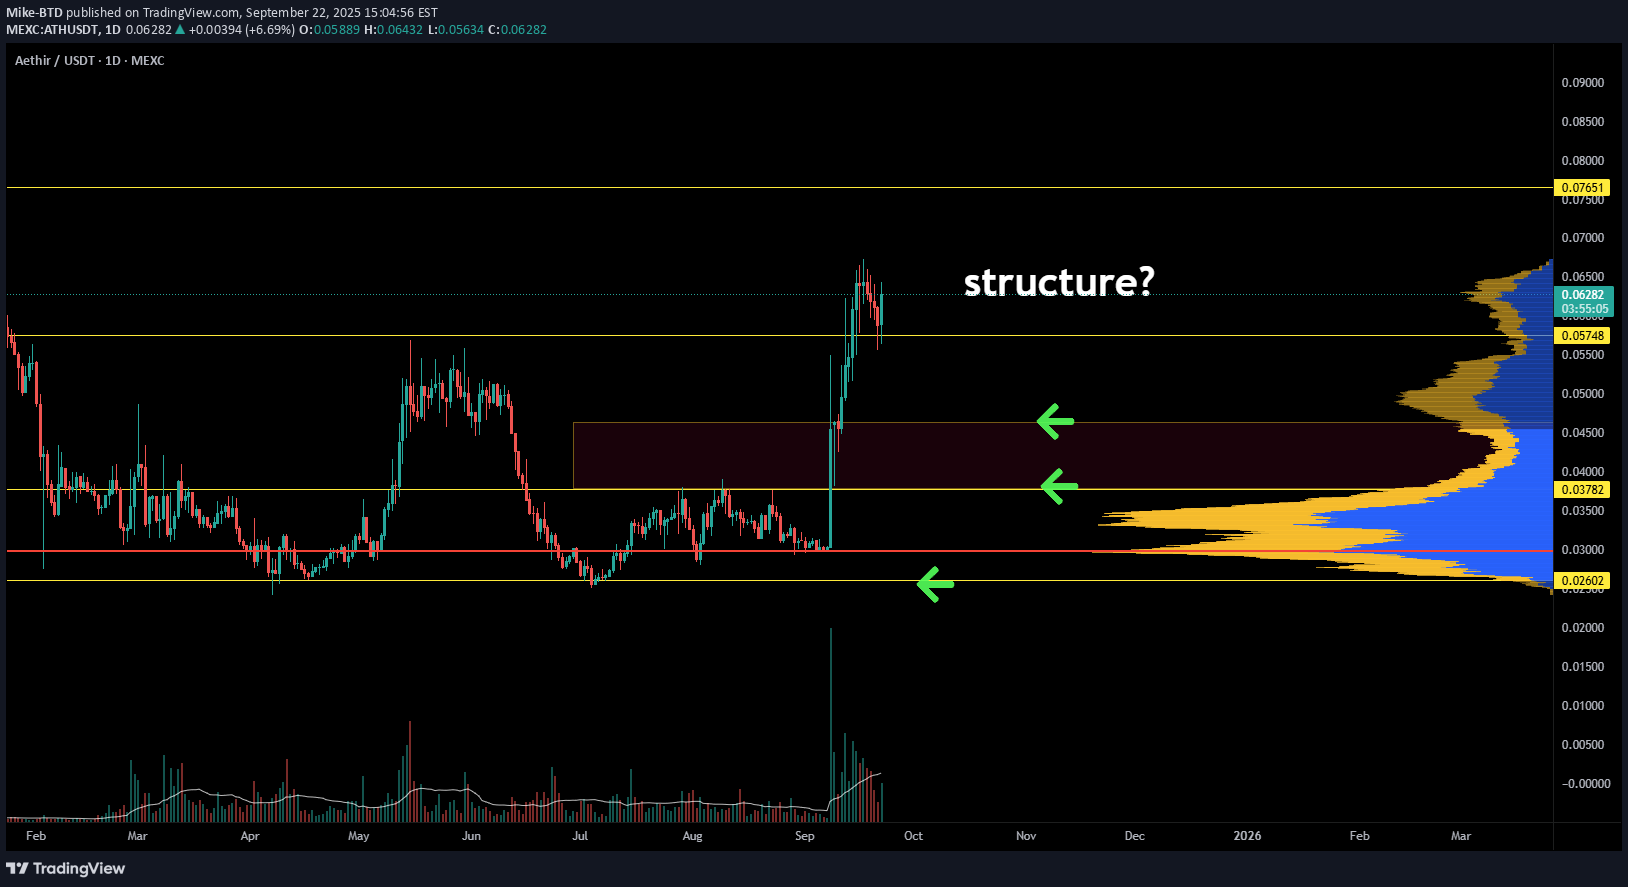
Mike-BTD

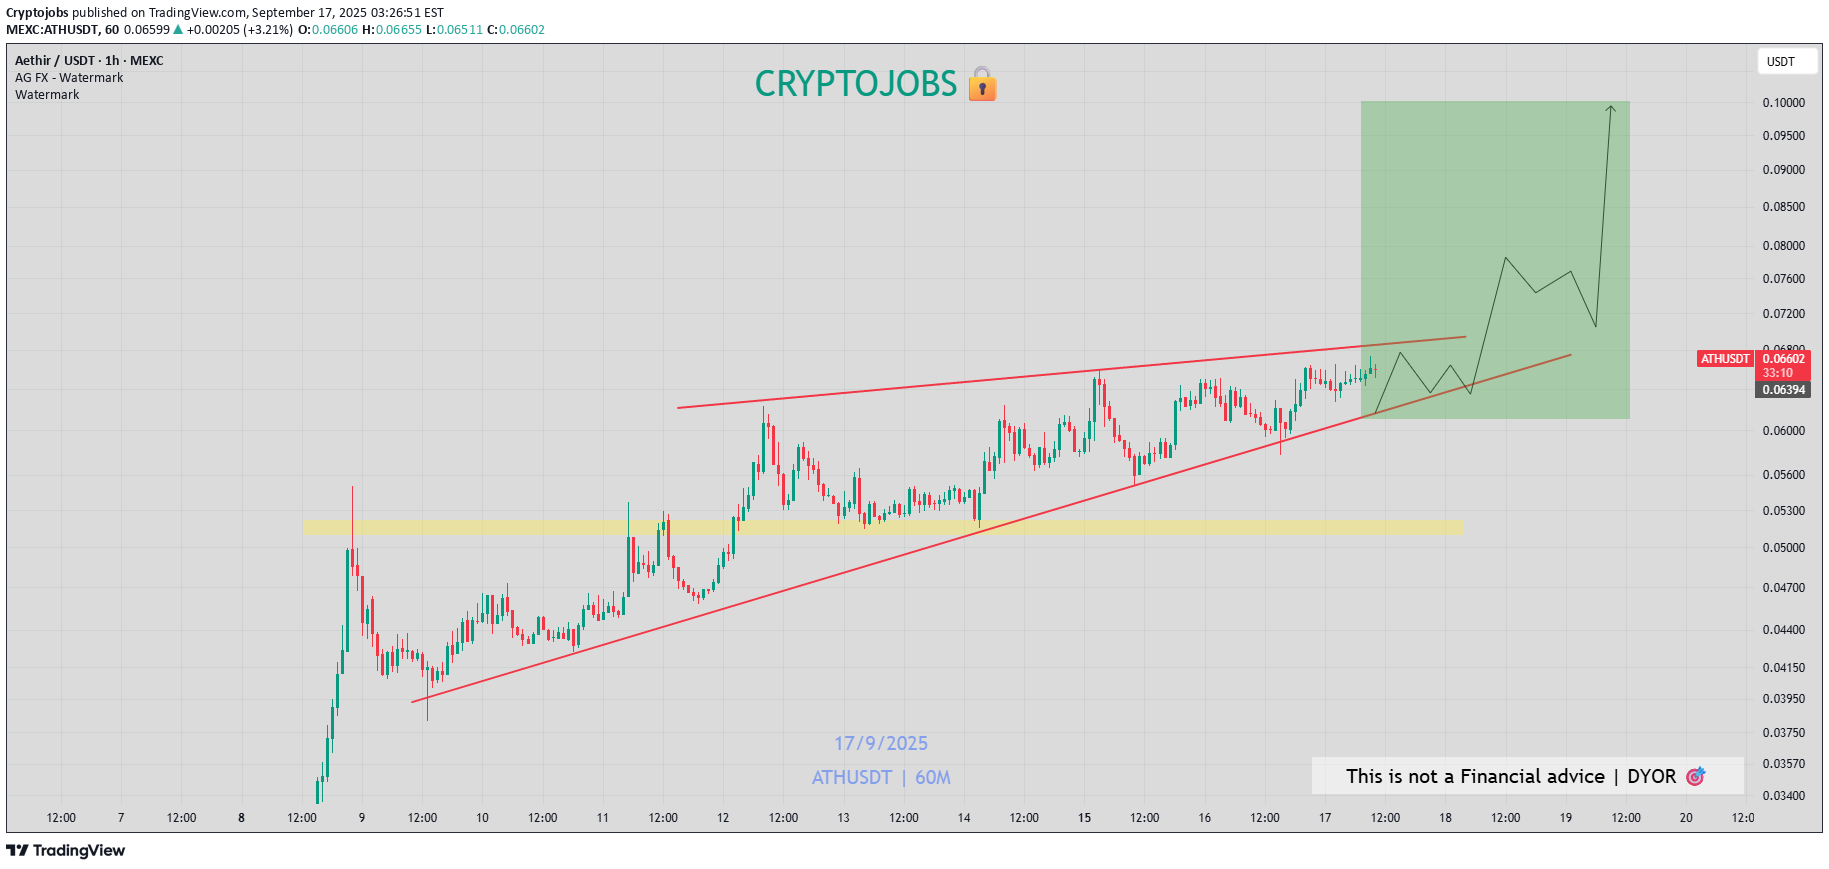
Cryptojobs
Amjad4Ali
Ath usdt long
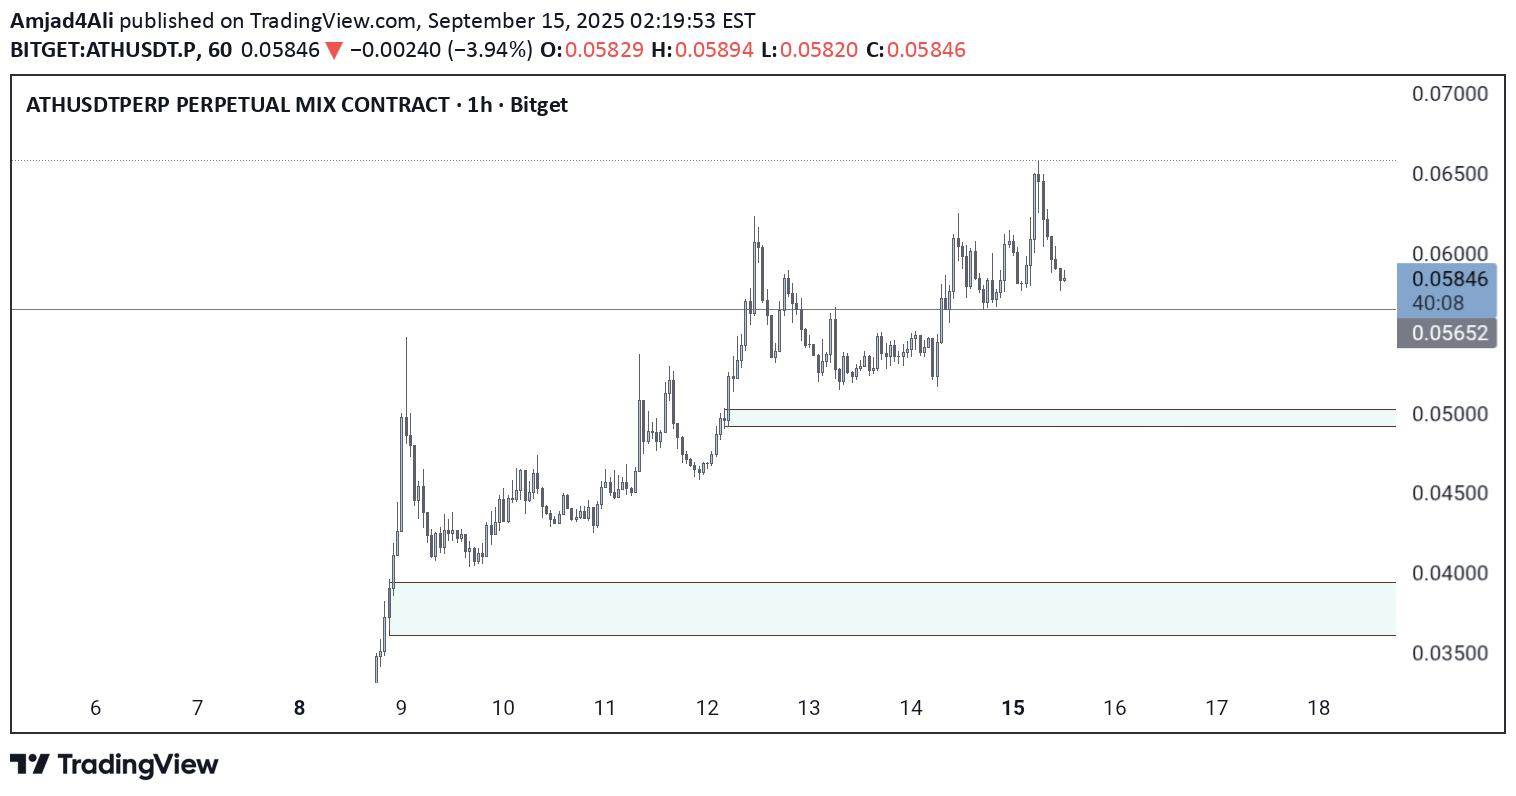
You can buy Ath USDT from here; these are two buy levels. Thank you

MoonTradingForecast
ATH Technical Outlook
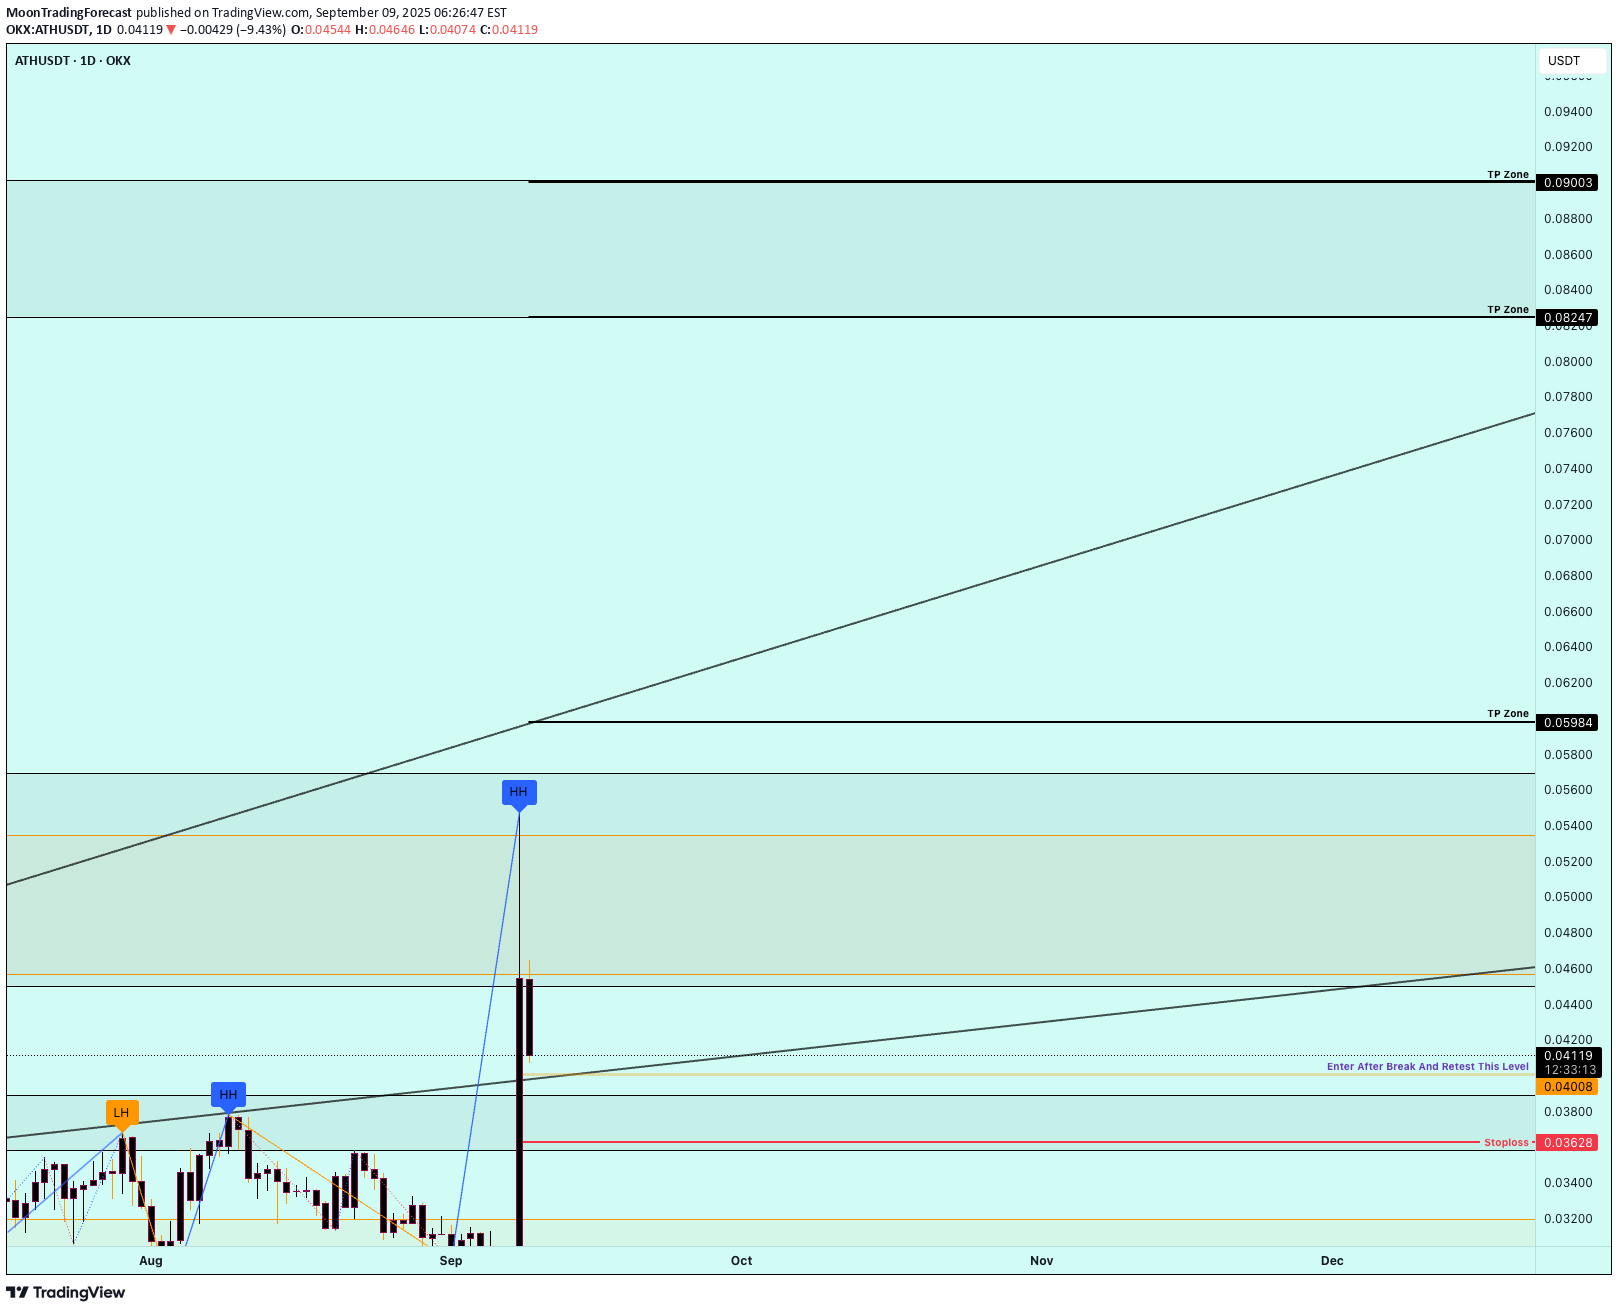
Description: ATH has recently reached an All-Time High (ATH), attracting strong market attention. The price action shows increased volatility near resistance levels, while support zones are being tested by traders watching for potential continuation or retracement. From a fundamental perspective, ATH benefits from growing adoption and market interest, supported by positive sentiment in the sector. Key factors to monitor include trading volume, liquidity flows, and broader market sentiment, which may influence whether the trend sustains above ATH or consolidates before the next move. ⚠️ Disclaimer: This is not financial advice. The content is for educational and informational purposes only. Please do your own research before making investment decisions. #TradingView #ATH #TechnicalAnalysis #PriceAction #Crypto #Stocks #ChartAnalysis #Trading #MarketTrends #Investing #Fundamentals

GoldenRule365
ATH - High Plotted target hit!
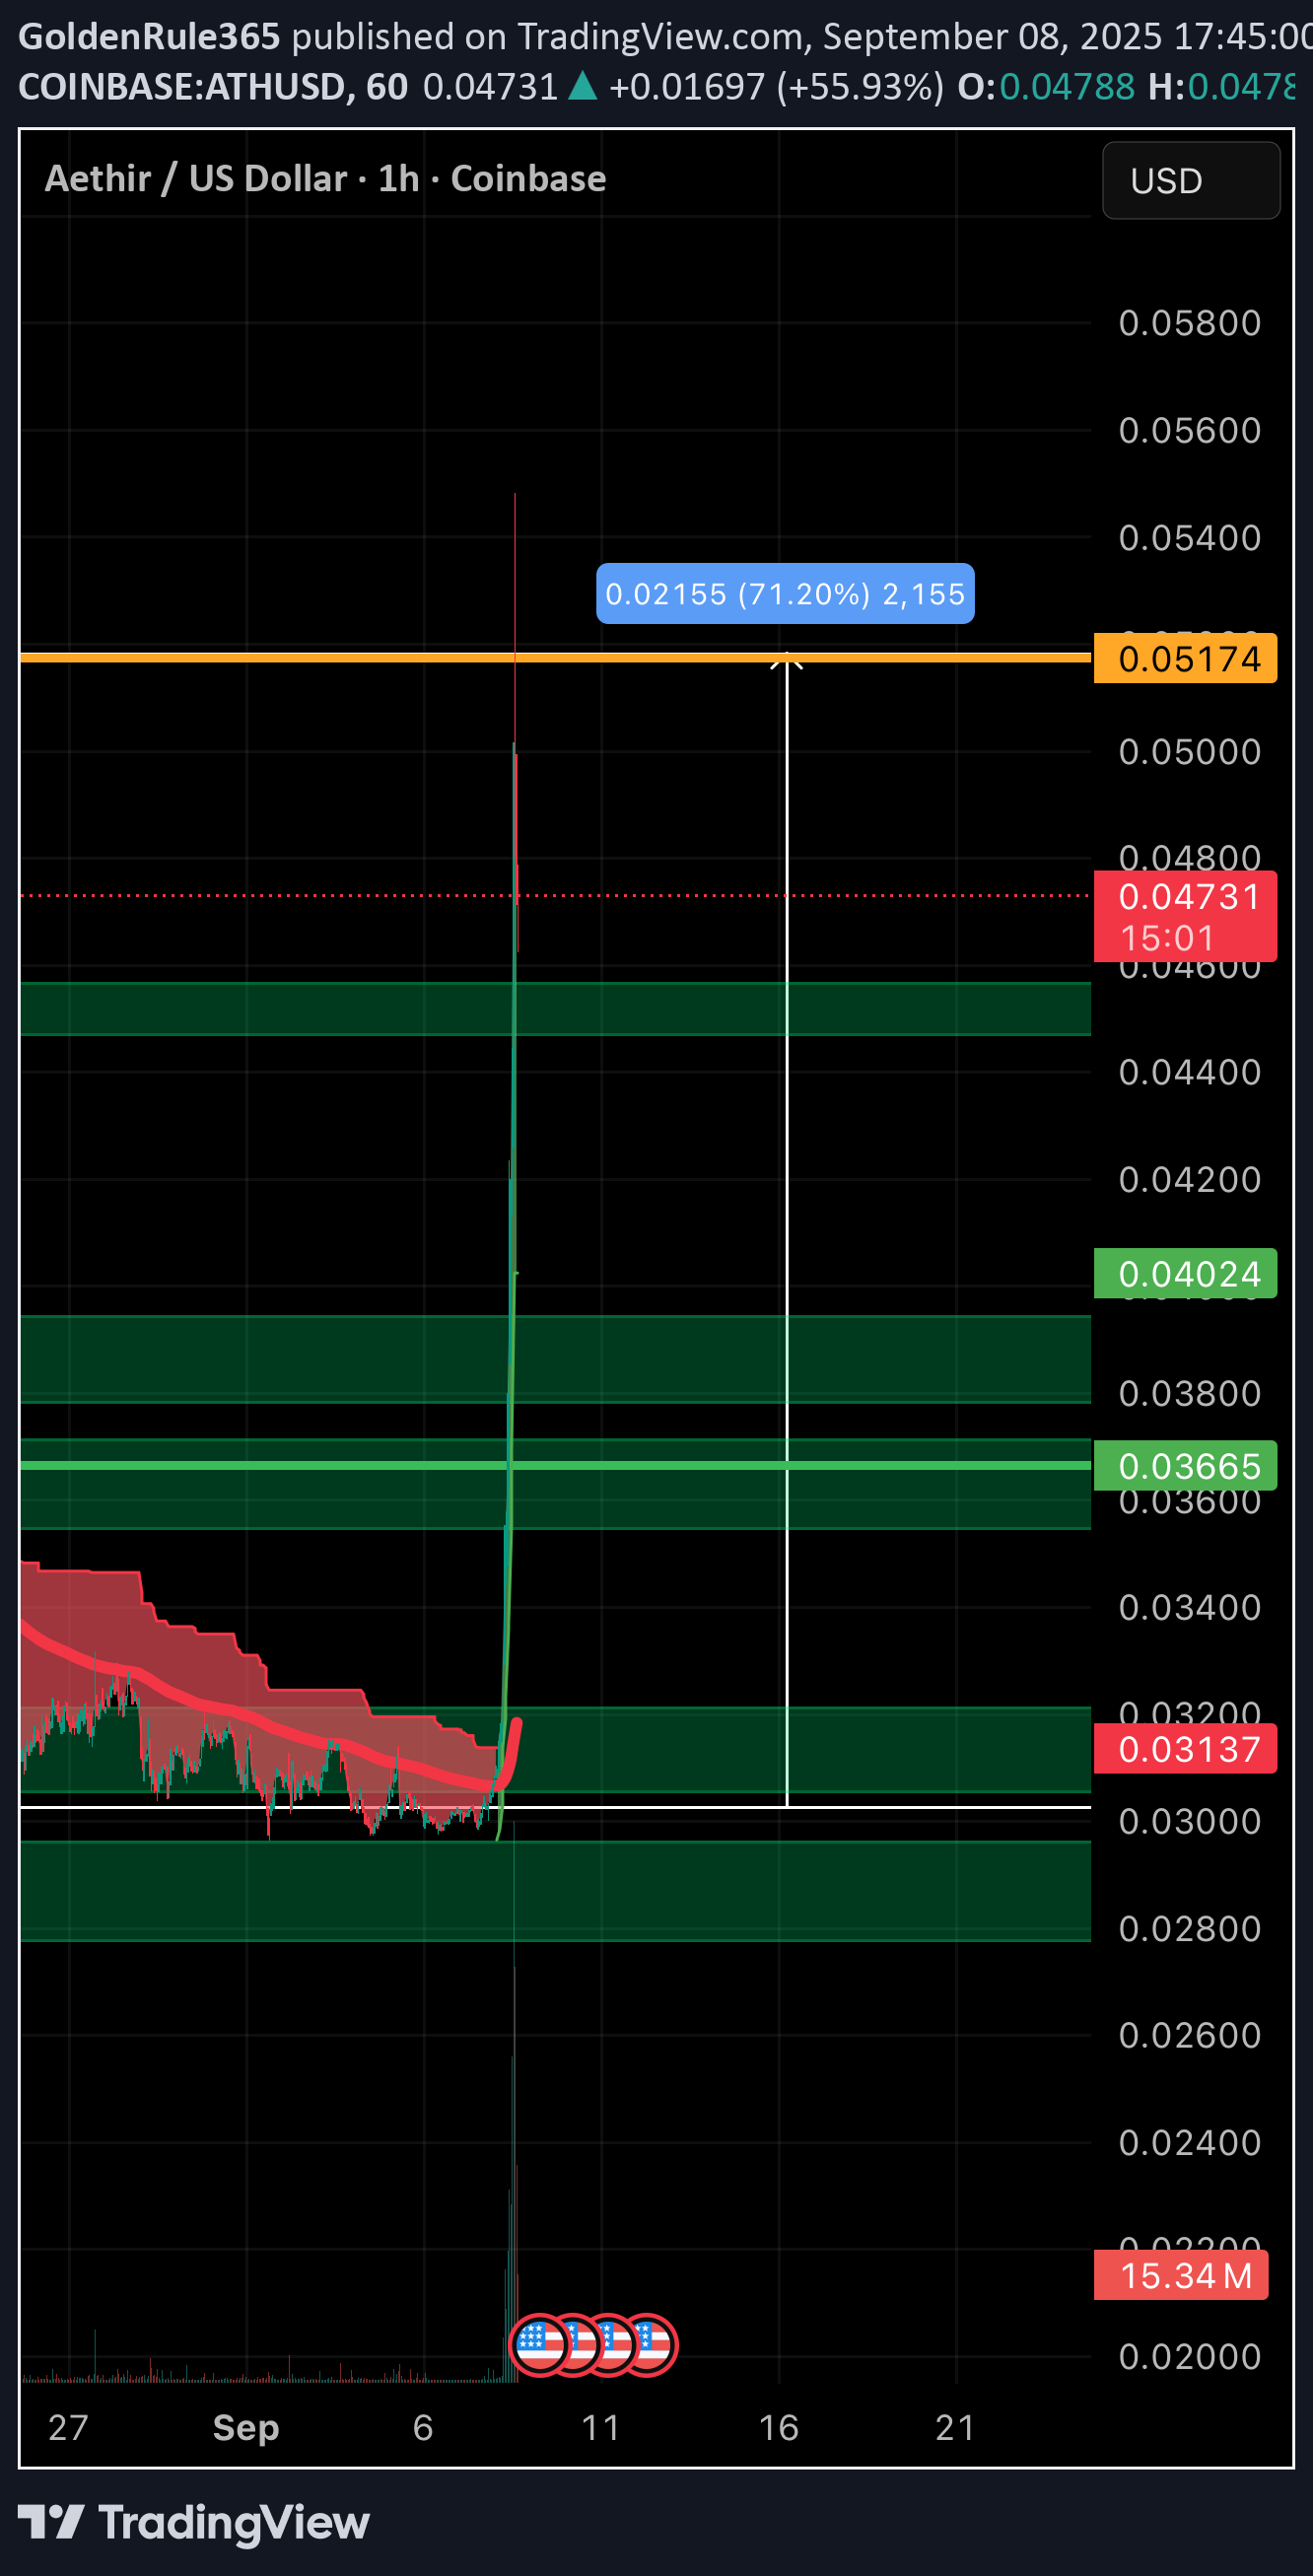
Thats over a 70% gain that took just barely 2 months of patiently waiting! Congratulations to all that followed!
Disclaimer
Any content and materials included in Sahmeto's website and official communication channels are a compilation of personal opinions and analyses and are not binding. They do not constitute any recommendation for buying, selling, entering or exiting the stock market and cryptocurrency market. Also, all news and analyses included in the website and channels are merely republished information from official and unofficial domestic and foreign sources, and it is obvious that users of the said content are responsible for following up and ensuring the authenticity and accuracy of the materials. Therefore, while disclaiming responsibility, it is declared that the responsibility for any decision-making, action, and potential profit and loss in the capital market and cryptocurrency market lies with the trader.