
ASR
AS Roma Fan Token
| تریدر | نوع سیگنال | حد سود/ضرر | زمان انتشار | مشاهده پیام |
|---|---|---|---|---|
No results found. | ||||
Price Chart of AS Roma Fan Token
سود 3 Months :
سیگنالهای AS Roma Fan Token
Filter
Sort messages by
Trader Type
Time Frame

Alpha-GoldFX
سیگنال انفجار بزرگ ASRUSDT: پتانسیل سود 100 درصدی در الگوی گوه نزولی!
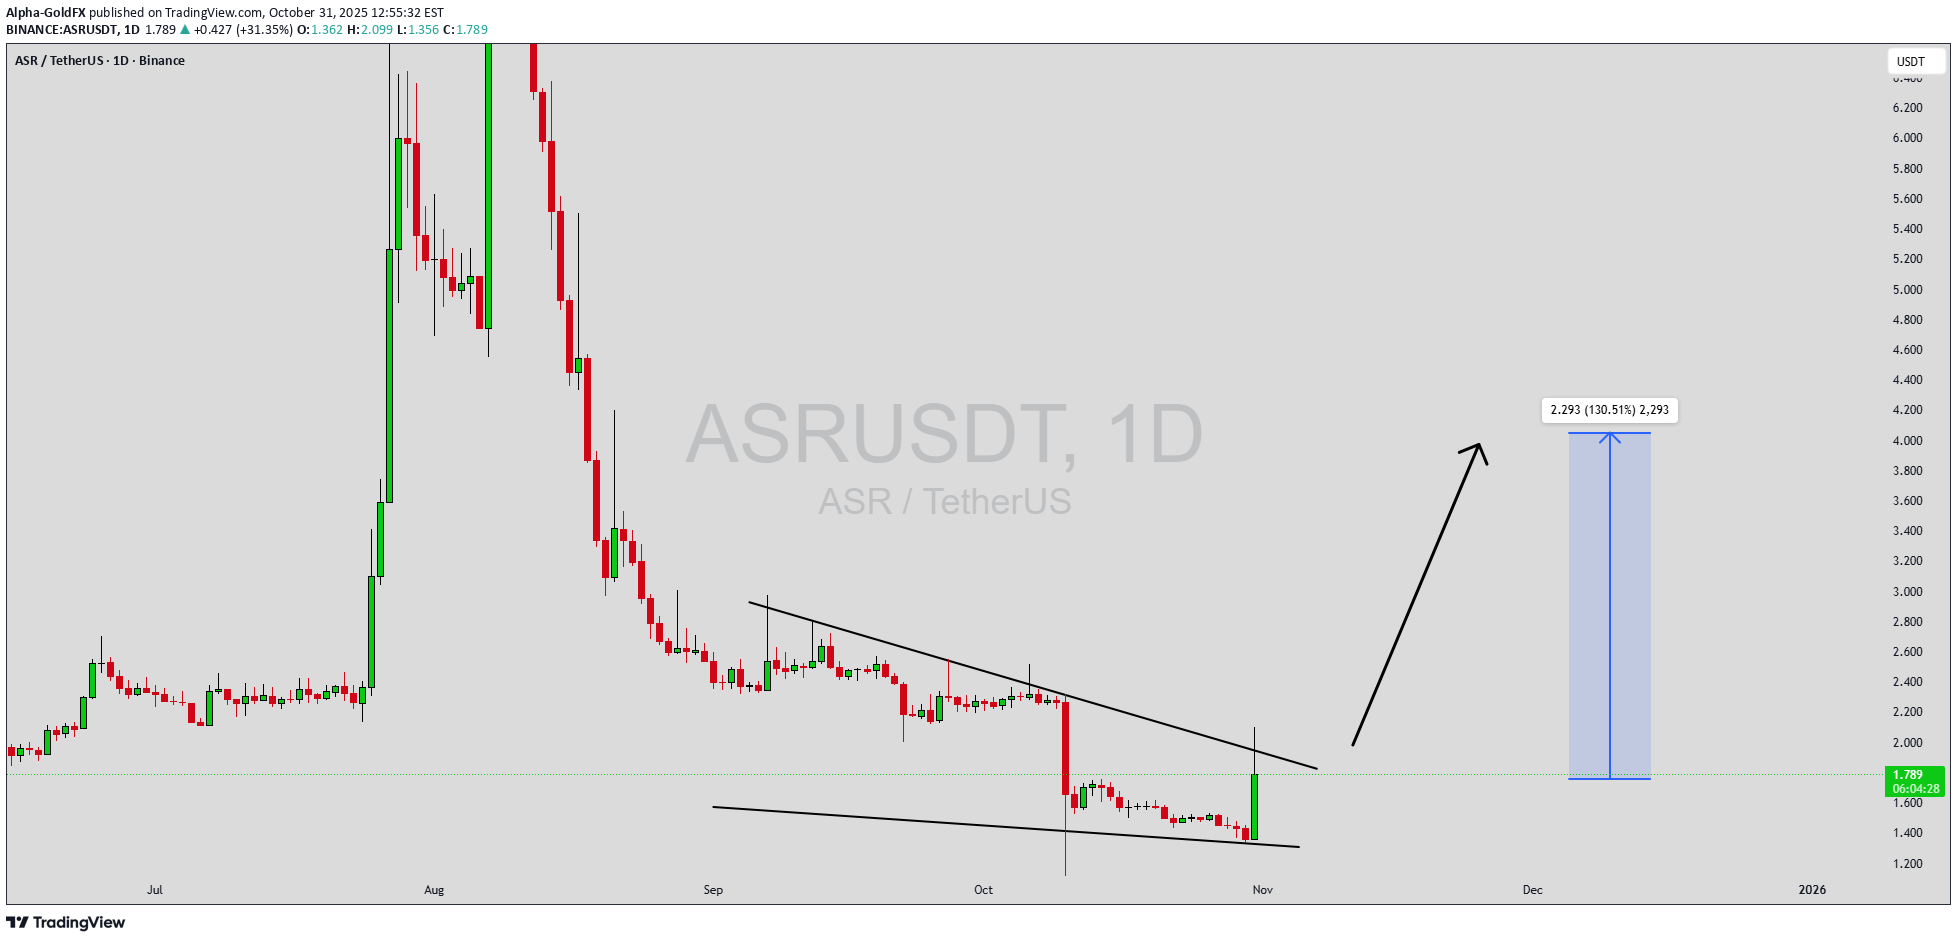
ASRUSDT is currently forming a classic falling wedge pattern, which is typically considered a strong bullish reversal signal. This pattern indicates that selling pressure is gradually weakening as the price consolidates within a narrowing range. Once the breakout occurs above the wedge resistance, it often leads to a sharp upward rally. Based on the technical setup, ASRUSDT could potentially deliver gains of 90% to 100%+, offering traders a compelling opportunity in the coming sessions. The volume behind ASRUSDT remains solid, confirming consistent interest from market participants. The combination of decreasing volatility within the wedge and stable volume suggests that accumulation is taking place. This behavior often precedes a strong breakout phase as traders and investors position themselves early for the next big move. Investor sentiment toward ASRUSDT is turning increasingly positive, as attention grows around its market structure and potential upside. The recent pattern development aligns well with broader bullish momentum across altcoins, making this setup particularly interesting. If momentum continues to build and the breakout confirms with volume, ASRUSDT could see a substantial rally, marking an exciting phase for short-term and medium-term traders alike. ✅ Show your support by hitting the like button and ✅ Leaving a comment below! (What is You opinion about this Coin) Your feedback and engagement keep me inspired to share more insightful market analysis with you!

FortuneAI
معکوس شدن بزرگ ASR: سیگنال خرید قوی و نکات مدیریت ریسک حیاتی
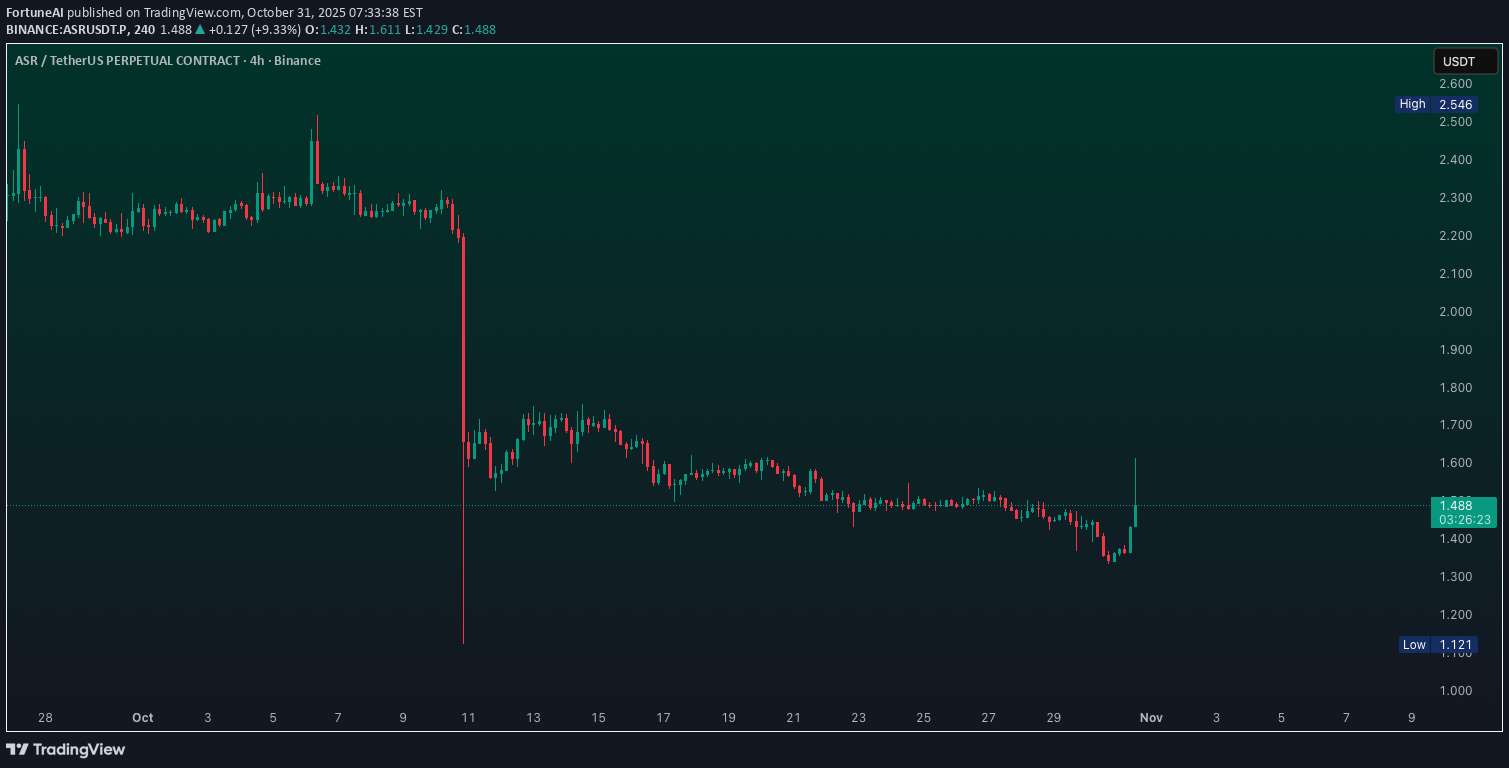
Keep an eye on ASR, Technicals highly bullish Use Proper Risk ManagementASR PUMPING HARDTARGET HIT, ENJOY

Bithereum_io
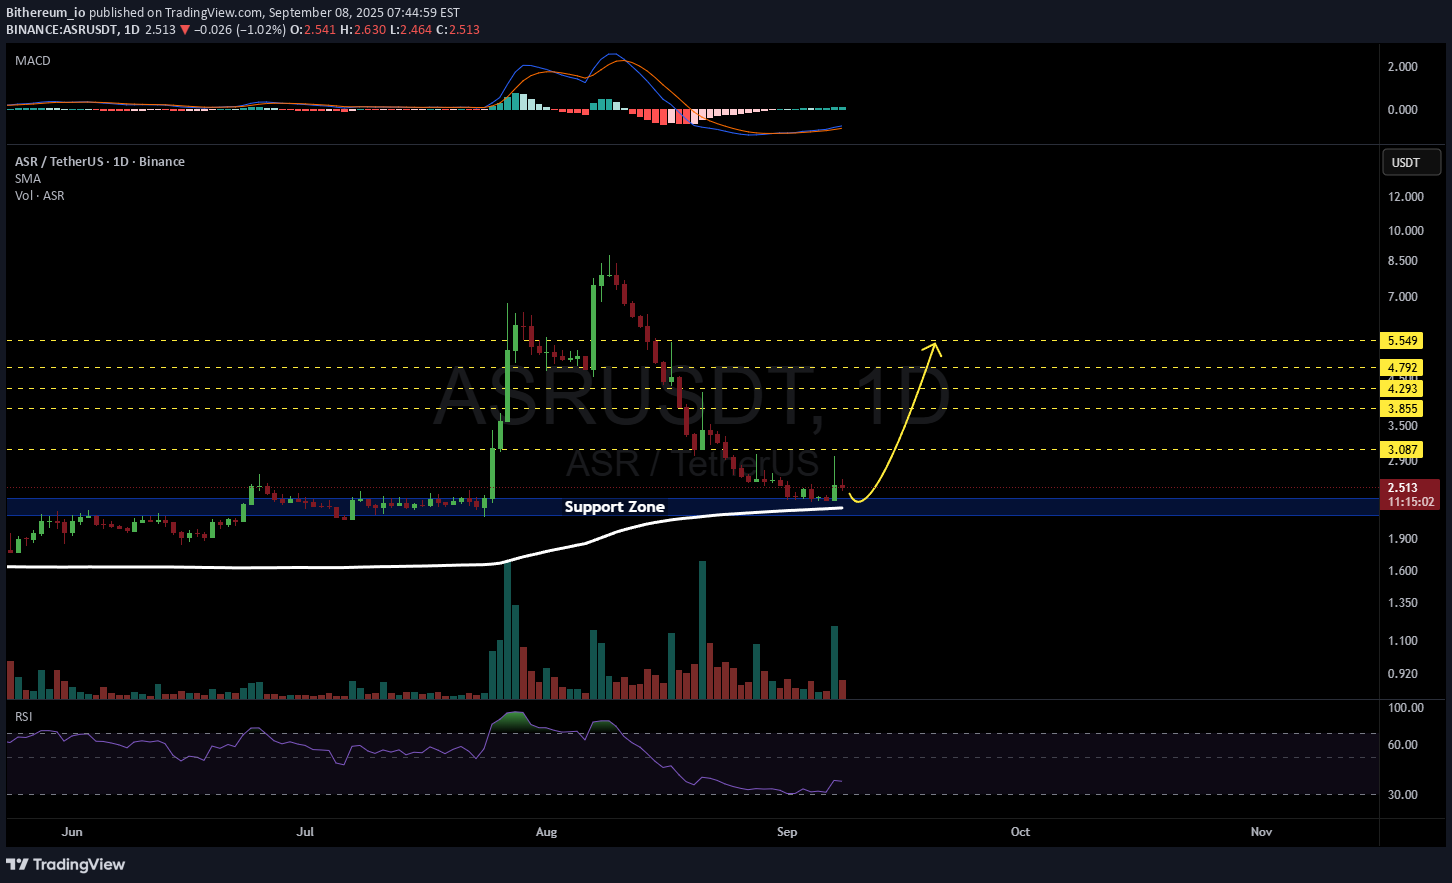
asr görünüşe göre iyi gidiyor gibi beni takipte kalın lütfen.
asr Apparently stay like going well, please follow me. Stay is not an investment advice %century price2.500
Alpha-GoldFX
ASTUSDT Forming Bullish Momentum
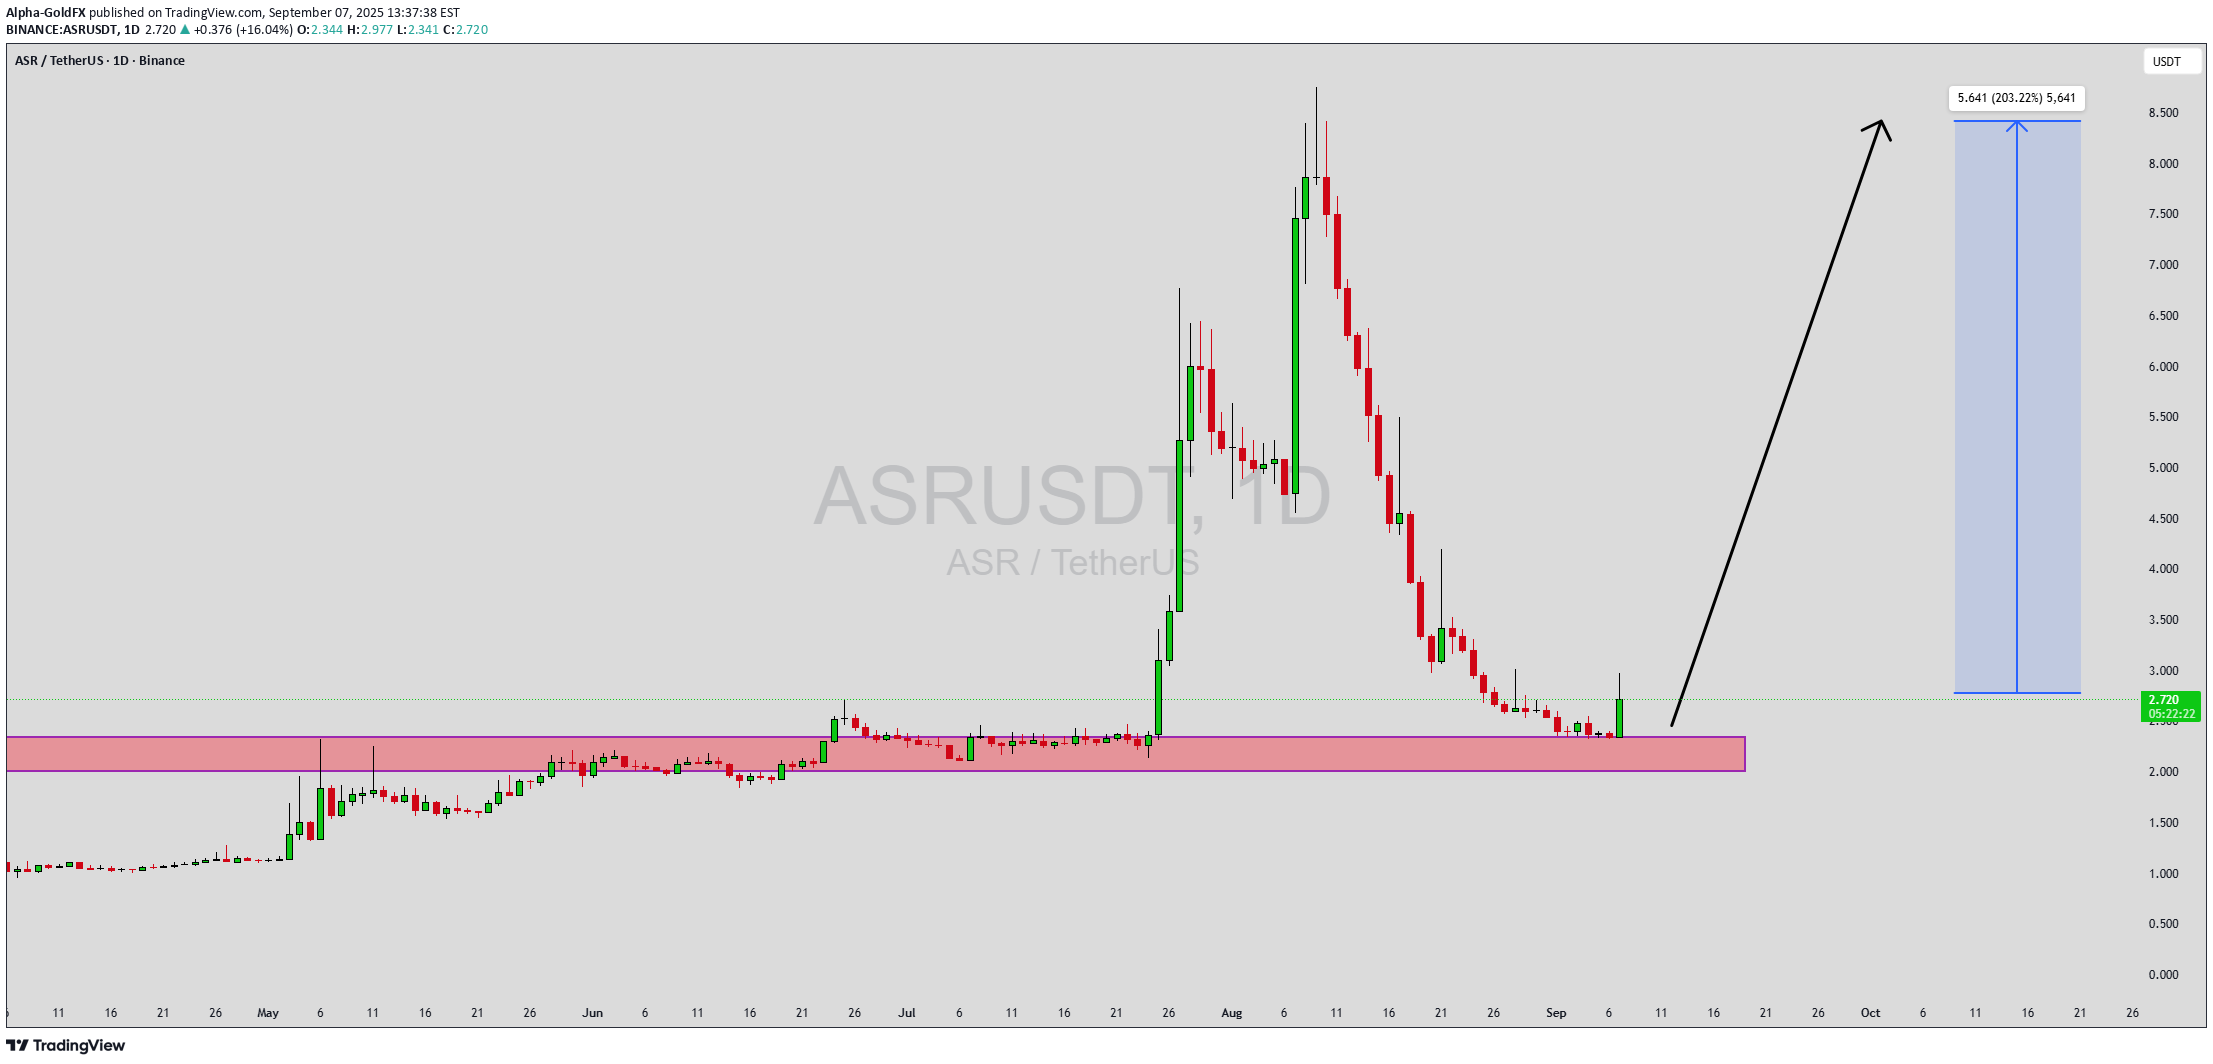
ASRUSDT is showing a powerful bullish momentum pattern that signals the possibility of a strong rally ahead. The price action is gaining traction with consistent buying volume, indicating growing confidence among traders and investors. This setup suggests that the pair could deliver a substantial upside move, with projections pointing toward gains of 190% to 200%+. Such patterns are often seen at the start of major bullish phases, making ASRUSDT a coin to watch closely. The strong momentum combined with healthy market participation highlights the potential for a breakout that could drive the price into higher levels rapidly. Investors are increasingly taking interest in this project, as reflected in the steady growth of volume and accumulation near key levels. If this momentum continues, ASRUSDT could see a parabolic rally, offering significant opportunities for both short-term traders and long-term holders. Technical indicators and price action suggest that the current trend is supported by market strength rather than short-lived speculation. A breakout confirmation could open the path to new highs, with strong buying pressure sustaining the rally. This reinforces the bullish bias and increases the probability of achieving the projected targets. In summary, ASRUSDT is positioning itself for a potential explosive move fueled by bullish momentum, strong volume, and rising investor interest. With an expected gain of nearly 200%, this setup is one of the most promising opportunities in the current market landscape. ✅ Show your support by hitting the like button and ✅ Leaving a comment below! (What is You opinion about this Coin) Your feedback and engagement keep me inspired to share more insightful market analysis with you!

AminAli7007
ASR/USDT technical analysis

Current Market Overview Current Price: $3.30 First Target (Resistance 1): $4.40 Second Target (Resistance 2): $6.80 Trend Context: The coin seems to be consolidating near the lows, with potential for a breakout if buying volume increases. 🔎 Step-by-Step Analysis Identify Support & Resistance Support Zone: $3.00 – $3.20 (psychological and historical level). Resistance Zone 1: $4.20 – $4.40. Resistance Zone 2: $6.50 – $6.80. Trend Direction If the price holds above $3.00 support and breaks $3.50 – $3.60, it confirms bullish momentum. A clean breakout above $4.40 opens the path toward $6.80. Entry Strategy Aggressive Entry: Buy near $3.20 – $3.30 with a stop loss at $2.90. Conservative Entry: Wait for breakout above $3.60 with volume confirmation. Take-Profit Strategy First Take Profit: $4.40 → secure partial profits (30–40%). Second Take Profit: $6.80 → hold the rest for bigger gains. Risk Management: Recommended stop loss: below $2.90 (major support break). Risk/reward ratio from $3.30 entry to $6.80 target = 1:5+ (very favorable). 📈 Conclusion ASR/USDT is currently in an accumulation zone around $3.30. Breaking $3.60–$4.00 resistance will likely accelerate the move to $4.40. Sustained bullish momentum beyond $4.40 gives a clear path to $6.80. 👉 Strategy: Enter between $3.20–$3.30 with SL at $2.90, aim for $4.40, then $6.80. ⚽ AS Roma Analysis – 2025 Season Outlook Pre-Season Performance AS Roma delivered a strong showing in their club-friendly matches, displaying sharp attacking transitions and solid defensive organization. The team looked cohesive, and new signings adapted quickly, which is a positive signal for the upcoming season. Squad Strength Attack: Dynamic forwards with the ability to break down defenses; wide players created consistent chances. Midfield: Improved ball control and pressing, helping Roma dominate possession in most friendlies. Defense: More compact compared to last season, reducing unnecessary gaps. Tactical Growth The manager emphasized quick passing, higher pressing, and tactical discipline. This has made the team more dangerous against stronger opponents. Season Prediction Given the improvements and pre-season form, Roma is well-positioned to be among the Top 4 teams in Serie A this season, securing a Champions League qualification spot. ✅ Conclusion: AS Roma impressed in friendlies with strong performances across all lines. If they maintain consistency, they are likely to finish inside the top four this season, making them a serious contender in Serie A.

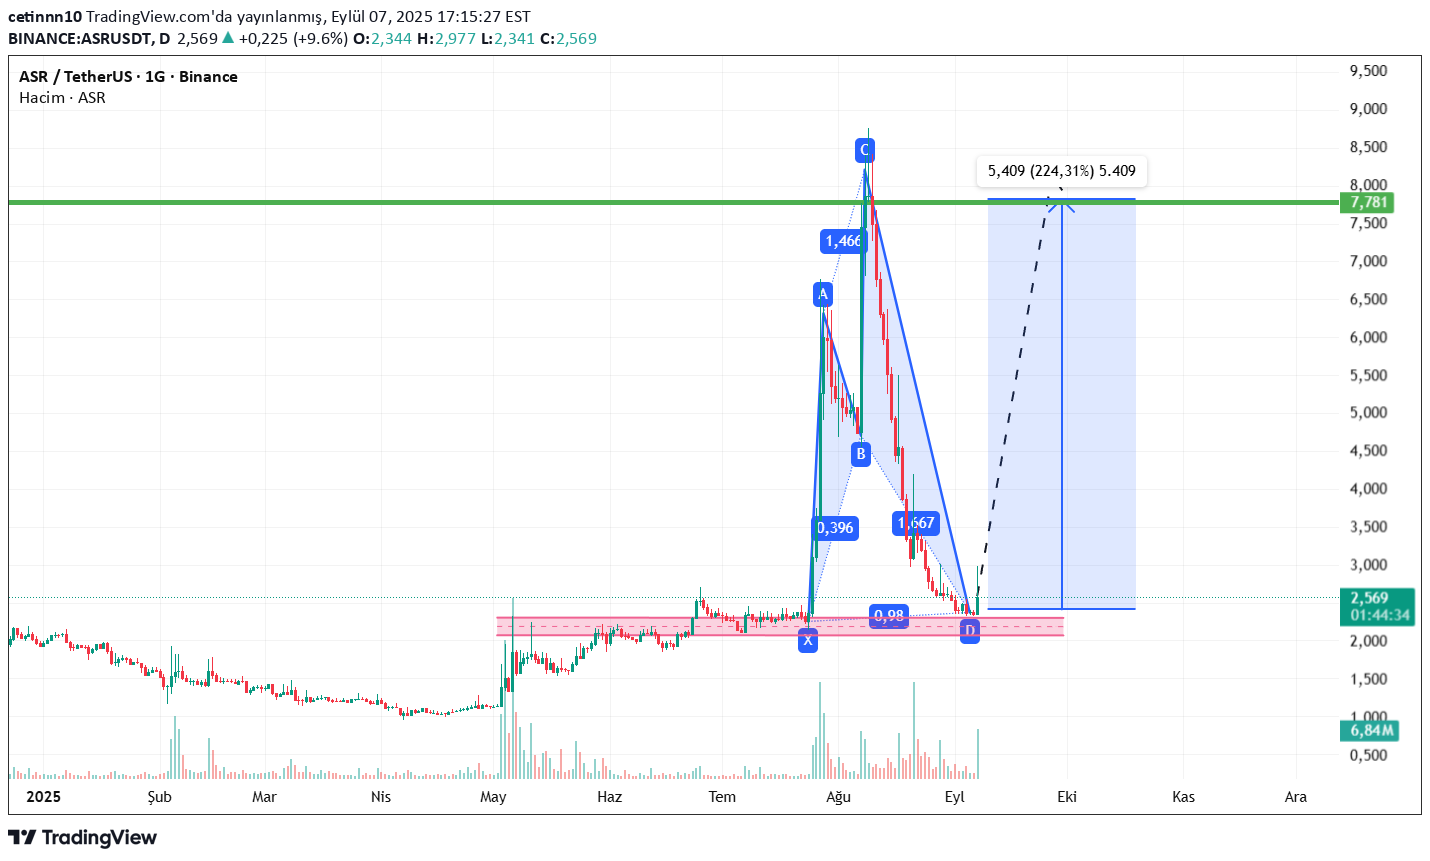
ASRUSD Gann Analizi

The goals have been found with the gann analysis method. The price may not return from the targets. However, the main scheme will be close to this. If the process is to be taken, you should give priority to your own strategy.

AltcoinPiooners
$ASR Bottom Bounce: 4H Trading Plan with Oversold RSI
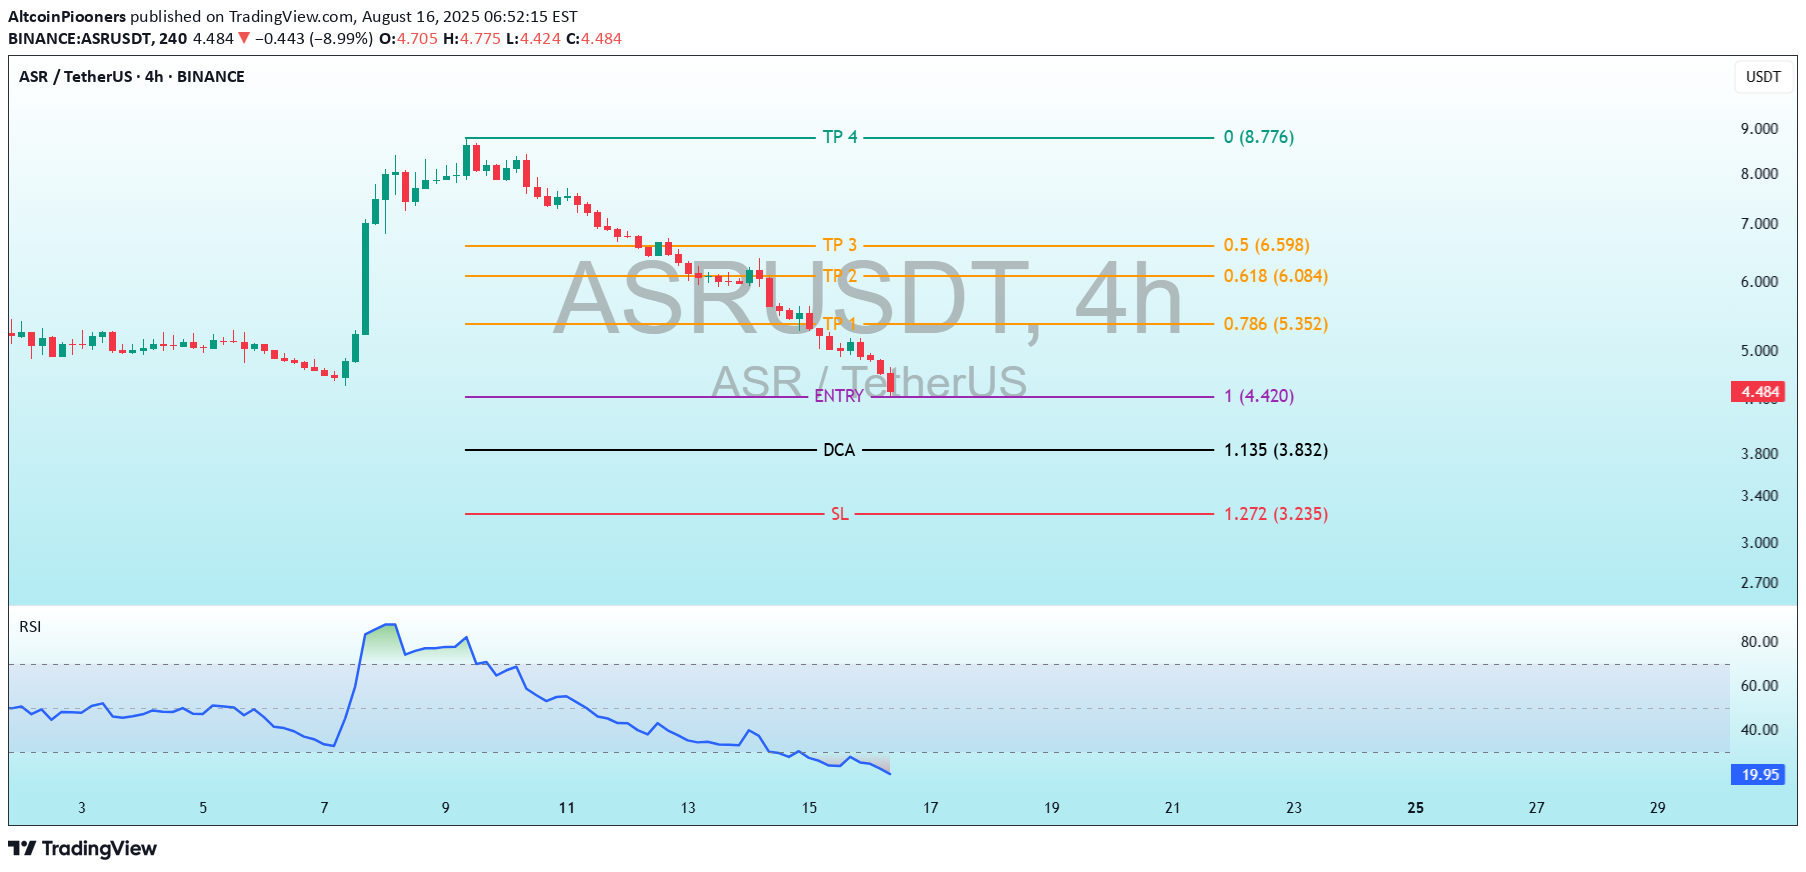
ASRUSDT Trading Levels: Entry: 1.00 (4.420 USDT) - The level where the initial purchase is planned. DCA (Dollar-Cost Averaging): 1.135 (3.832 USDT) - An additional buying point if the price declines. SL (Stop Loss): 1.272 (3.235 USDT) - The level where the loss would be limited. TP (Take Profit):TP1: 0.786 (5.352 USDT) TP2: 0.618 (6.084 USDT) TP3: 0.5 (6.598 USDT) TP4: 0 (8.776 USDT) - A significantly lower target, likely an error or long-term goal. RSI (Relative Strength Index) Indicator: The current RSI value is 19.55, which is in the oversold territory (below 30). This suggests the price may be undervalued, potentially indicating a buying opportunity or an upcoming rebound. Analysis and Interpretation: Strategy: The chart uses Fibonacci levels to determine entry, exit, and loss points. The entry is set at 4.420 USDT, with a DCA at 3.832 USDT if the price drops further, and a stop loss at 4.735 USDT to protect capital. Profit Targets: TP1 to TP3 are based on Fibonacci extension levels (0.786, 0.618, 0.5), indicating a technical approach to taking profits as the price rises. TP4 at 0.776 USDT seems unrealistically low and is likely a mistake. RSI: The low RSI value (19.55) indicates an oversold condition. This could suggest a potential reversal or upward movement, especially if buying pressure increases following the recent decline. Recommendation: Monitor the price closely around the entry level (4.420 USDT) and DCA (3.832 USDT). The oversold RSI suggests a possible buying opportunity, but caution is advised due to the recent sharp drop.TP 1 ✅ +22.38% PROFIT 🏆 You don’t have to be great to start, but you have to start to be great. Interested for Premium 👉 t.me/Altcoin_Piooners Follow for signals! 🔥 #Crypto #Stablecoin Follow for signals! 🔥 #Crypto #Stablecoin

mohamed_yousef_elziny
BTC يحاول التصحيح و ASR تستعد لانفجار من الـFVG نحو %30

📊 Asr/USDT - SMC (educational) 🔹 Al -Farim: an hour 🔹 Strategy: Smart Money Concepts - entering from Fair Value Gap 🔹 Expected profit rate: about 34% The price after an extended landing wave is close to (FVG), which is the price void resulting from the previous explosive movement. The FVG areas usually represent the price attractions to fill liquidity, which makes them strong institutional demands under the SMC methodology. 📍 The purchase area (Buy), which is the FVG area 🟢 Entry Plan ✅ Enter as soon as the FVG region comes into contact with a counteractive behavior (Reject). 🎯 target (TP) TP: 6.293 The Supply Show is a precedent, the first level in which purchasing centers were discharged in the last wave. ➡️ The profit ratio from the entry area Tới target = approximately 34% 📌 Educational notes The (FVG) is a sign of the Smart Money, so re -testing the region is often for the purpose of re -accumulation. It is best to wait for the PA Confirmation when contacting the area before entering. The deal is suitable with strict risk management. ⚠️ Important note: This analysis is for educational purposes only and is not considered a direct recommendation for sale or purchase. ⚠️ Elimination responsibility: This content is for educational purposes and clarifying trading ideas only, and is not considered an investment advice or a direct recommendation for purchase or sale. Trading in financial markets, especially the chipo, involves high risks that may completely lose capital. Always perform your own search and wisely manage trading risk. 💬 Share your opinion on the comments, do you see the deal logical from your perspective? 📊 For additional technical analyzes, entry signals and direct discussions: Telegram: @Elzinyterad #Highusdt #cryptotrading #smartMoneyconcepts #smc #cryptosignals #PRICEAEACTION #Orderblock #Cryptosetup #riskreward #supplydemand
Disclaimer
Any content and materials included in Sahmeto's website and official communication channels are a compilation of personal opinions and analyses and are not binding. They do not constitute any recommendation for buying, selling, entering or exiting the stock market and cryptocurrency market. Also, all news and analyses included in the website and channels are merely republished information from official and unofficial domestic and foreign sources, and it is obvious that users of the said content are responsible for following up and ensuring the authenticity and accuracy of the materials. Therefore, while disclaiming responsibility, it is declared that the responsibility for any decision-making, action, and potential profit and loss in the capital market and cryptocurrency market lies with the trader.