
mohamed_yousef_elziny
@t_mohamed_yousef_elziny

What symbols does the trader recommend buying?
Purchase History
پیام های تریدر
Filter
mohamed_yousef_elziny
BTC يحاول التصحيح و ASR تستعد لانفجار من الـFVG نحو %30

📊 Asr/USDT - SMC (educational) 🔹 Al -Farim: an hour 🔹 Strategy: Smart Money Concepts - entering from Fair Value Gap 🔹 Expected profit rate: about 34% The price after an extended landing wave is close to (FVG), which is the price void resulting from the previous explosive movement. The FVG areas usually represent the price attractions to fill liquidity, which makes them strong institutional demands under the SMC methodology. 📍 The purchase area (Buy), which is the FVG area 🟢 Entry Plan ✅ Enter as soon as the FVG region comes into contact with a counteractive behavior (Reject). 🎯 target (TP) TP: 6.293 The Supply Show is a precedent, the first level in which purchasing centers were discharged in the last wave. ➡️ The profit ratio from the entry area Tới target = approximately 34% 📌 Educational notes The (FVG) is a sign of the Smart Money, so re -testing the region is often for the purpose of re -accumulation. It is best to wait for the PA Confirmation when contacting the area before entering. The deal is suitable with strict risk management. ⚠️ Important note: This analysis is for educational purposes only and is not considered a direct recommendation for sale or purchase. ⚠️ Elimination responsibility: This content is for educational purposes and clarifying trading ideas only, and is not considered an investment advice or a direct recommendation for purchase or sale. Trading in financial markets, especially the chipo, involves high risks that may completely lose capital. Always perform your own search and wisely manage trading risk. 💬 Share your opinion on the comments, do you see the deal logical from your perspective? 📊 For additional technical analyzes, entry signals and direct discussions: Telegram: @Elzinyterad #Highusdt #cryptotrading #smartMoneyconcepts #smc #cryptosignals #PRICEAEACTION #Orderblock #Cryptosetup #riskreward #supplydemand
mohamed_yousef_elziny
BTC يحافظ على الزخم.. وصفقة EDU تترقب انطلاقة سريعة نحو الهدف
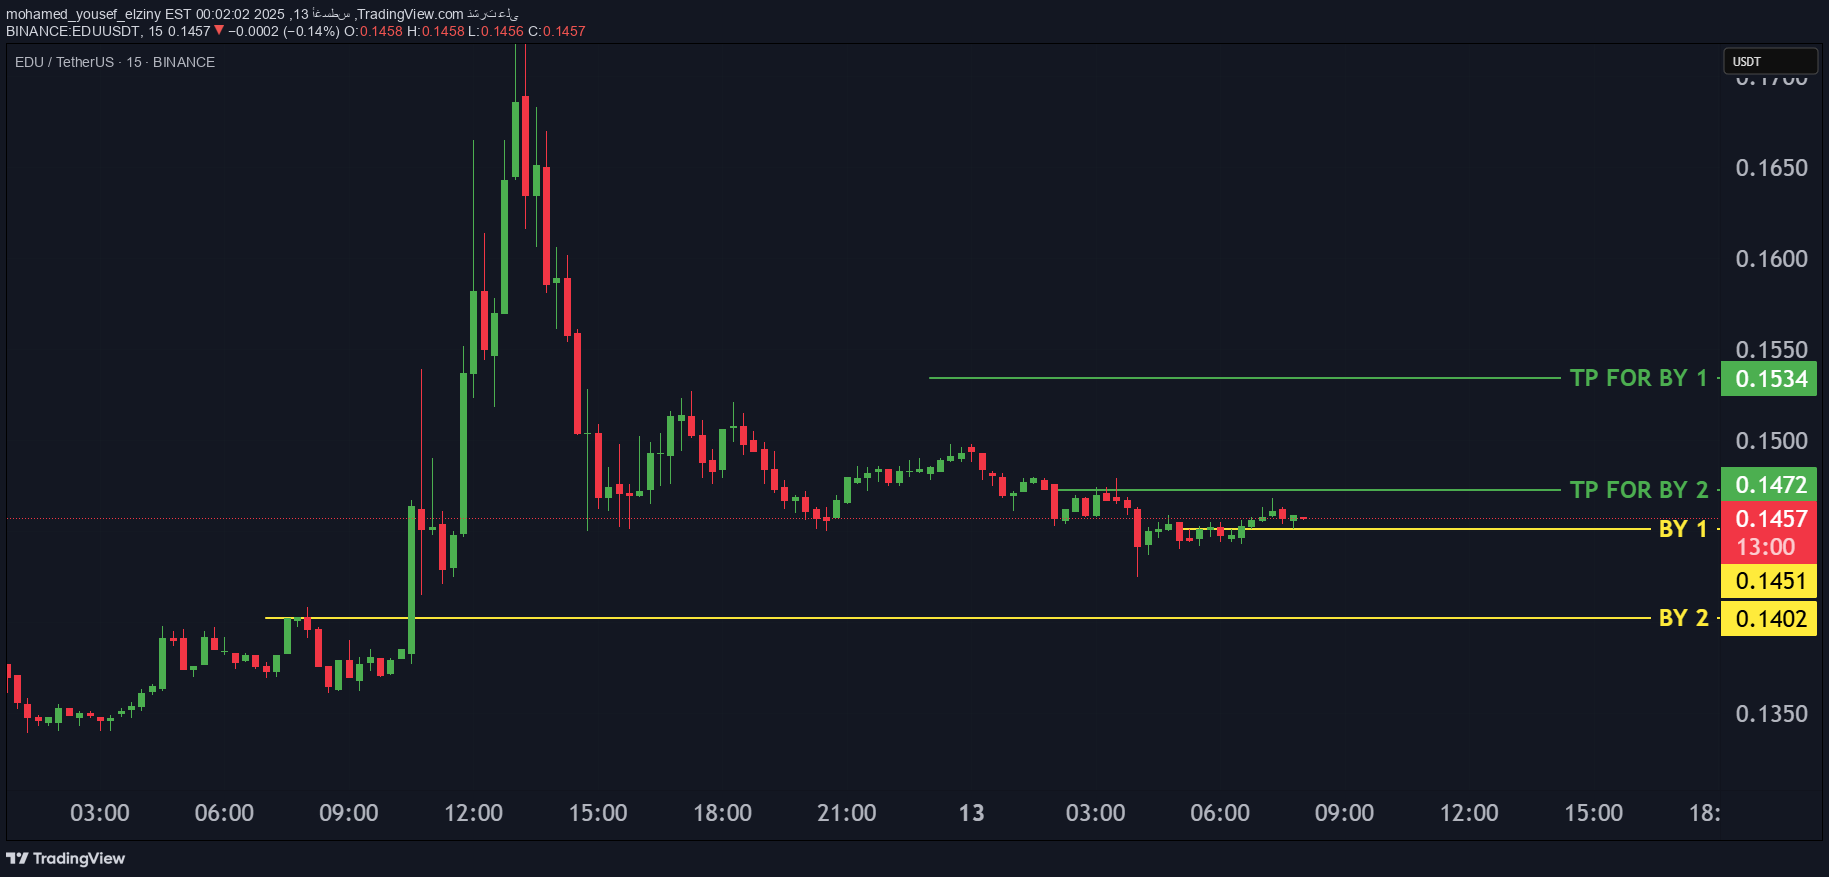
📊 EDU/USDT - SMC style 🔹 Al -Farim time: 15 minutes 🔹 Strategy: demand and supply + price confirmation (Pa Confirmation) The expected profit rate: about 6% 💡 Analytical idea (SMC) After a strong landing, the price entered a short -term demand area previously witnessed a strong intervention of buyers. Two regions were identified for purchase with the aim of distributing risk and achieving the best average entry: Buy 1: 0.1451 - the upper limit of the area. Buy 2: 0.1402 - The lower and safer border. 🎯 Goal plan In case of purchase from Buy 1 only: Objective: 0.1534 → expected profit about 6% In the case of purchase from Buy 2: Objective: 0.1472 → expected profit about 5% 📌 Academic scenario Entry when contacting any of the areas of demand with the price of the PA Confirmation through reflex candles or high purchasing volume. Graduated entry reduces risk and improves average purchase. 💡 Conclusion: A short -term deal depends on SMC with a profit rate of about 6%, with clarity of goals depending on the place of purchase to increase safety and achieve the best return. It has already been entered from by1 ⚠️ Elimination responsibility: This content is for educational purposes and clarifying trading ideas only, and is not considered an investment advice or a direct recommendation for purchase or sale. Trading in financial markets, especially the chipo, involves high risks that may completely lose capital. Always perform your own search and wisely manage trading risk. 💬 Share your opinion on the comments, do you see the deal logical from your perspective? 📊 For additional technical analyzes, entry signals and direct discussions: Telegram: @Elzinyterad #Highusdt #cryptotrading #smartMoneyconcepts #smc #cryptosignals #PRICEAEACTION #Orderblock #Cryptosetup #riskreward #supplydemand
mohamed_yousef_elziny
BTC يثبت قوته.. وGMX على موعد مع انطلاقة مزدوجة من مناطق الطلب

📊 Analysis of GMX/USDT - Offer and Request areas 🔹 Al -Farim: 1 hour 🔹 Strategy: Supply & Demand 1️⃣ DEMAND Zone Buy 1: At 17.53 → A short -term request area after the price falls and test it several times, which is the point from which buyers are expected to start defending the price. Buy 2: At 15.40 → It represents a deeper and stronger request area, which is the previous large emerging movement base, and often it has institutional purchase orders. 2️⃣ Display Zone (Supply Zone) TP for Buy 2: At 20.71 → A short -term display area resulting from a previous correction, which is the logical goal of the second purchase. TP for Buy 1: at 23.03 → a major and powerful display area, represents the summit of the previous launch. 3️⃣ Trading Plan 📍 The first entry: Buy from 17.53 Hard at 23.03 The expected profit rate ≈ 30% 📍 The second entry: Buy from 15.42 Hard at 20.7 The expected profit rate ≈ 35% In the case of the second purchase, you have a quantity by selling the full quantity at the second purchase goal TP for 2 4️⃣ Educational concept The demand area is the place of strong purchase orders that pay the price to climb. The display area is the place of strong sale orders that pay the price to land or correction. The combination of two different regions of entry (Buy 1 & Buy 2) gives you multiple chances and reduces the risks if the first entry does not succeed. 💡 Note: The combination of the entrances with the commitment to the management of the capital achieves an excellent balance between the rate of risk and the return. ⚠️ Elimination responsibility: This content is for educational purposes and clarifying trading ideas only, and is not considered an investment advice or a direct recommendation for purchase or sale. Trading in financial markets, especially the chipo, involves high risks that may completely lose capital. Always perform your own search and wisely manage trading risk. 💬 Share your opinion on the comments, do you see the deal logical from your perspective? 📊 For additional technical analyzes, entry signals and direct discussions: Telegram: @Elzinyterad #Highusdt #cryptotrading #smartMoneyconcepts #smc #cryptosignals #PRICEAEACTION #Orderblock #Cryptosetup #riskreward #supplydemand
mohamed_yousef_elziny
ETC/USDT تحت المراقبة – فرصة فنية على إطار الساعة

🔥 Trading opportunity - Long Deal (Buy) 🔹 Currency: ETC/USDT ⏰ Time frame: 1 hour 🟢 Entry price: 21.0400🎯 Production goal: 21.7710❌ Stop loss: 20.8616 📈 Possible profit rate: +3.47% The deal is based on a short -term rising trend on the watch frame, where the price showed a bounce of a strong support level near 21.00, with an entry signal from a technical model/indicator (MGY) that supports continuing purchasing momentum. The goal is placed when previous resistance at 21.77, stopping a loss below the last support to reduce risks. ⚠️ Elimination responsibility: This content is for educational purposes and clarifying trading ideas only, and is not considered an investment advice or a direct recommendation for purchase or sale. Trading in financial markets, especially the chipo, involves high risks that may completely lose capital. Always perform your own search and wisely manage trading risk. 💬 Share your opinion on the comments, do you see the deal logical from your perspective? 📊 For additional technical analyzes, entry signals and direct discussions: Telegram: @Elzinyterad #Highusdt #cryptotrading #smartMoneyconcepts #smc #cryptosignals #PRICEAEACTION #Orderblock #Cryptosetup #riskreward #supplydemand
mohamed_yousef_elziny
CHZ/USDT – هل حان وقت دخول الحيتان؟ منطقة طلب قوية تنتظر الانفجا

🔍 تحلیل SMC (مفهوم پول هوشمند) – بازه زمانی 1 روزه در این تحلیل، تعامل قیمت با یک منطقه تقاضای قوی (Demand Zone) را مشاهده میکنیم که از 0.0465 تا 0.0436 امتداد دارد. این منطقه پس از شکست ساختار نزولی (Break of Structure - BOS) قبلی شکل گرفته است، که نشاندهنده ورود پول هوشمند (Smart Money) و وجود علاقه خرید نهادی است. ✅ جزئیات معامله احتمالی: قیمت ورود احتمالی: 0.04505 هدف: 0.049745 (بالاترین قله واضح قبل از شکست) حد ضرر: 0.043164 (زیر دم قویترین کندل داخل منطقه) قدرت خرید منطقه: 🔥 بالا (تطابق با حجم صعودی و رد قیمتی قوی) 📈 دلایل ورود: * قیمت در حال حاضر داخل منطقه تقاضا است. * شمعهای رد قیمتی وجود خریداران بزرگ را تأیید میکنند. * تطابق واضح با مفهوم Order Block + Liquidity Sweep. * منطقه تقاضا از زمان تشکیل شدن آزمایش نشده است، که شانس تعامل قوی را افزایش میدهد. 🧠 نکته برای معاملهگران: این یک توصیه مالی نیست، بلکه یک تحلیل فنی مبتنی بر ابزارهای SMC است. از مدیریت ریسک به طور جدی اطمینان حاصل کنید. 📊 برای تحلیلهای فنی بیشتر، سیگنالهای ورود و بحثهای مستقیم: تلگرام: @ELZINYTERAD #HIGHUSDT #CryptoTrading #SmartMoneyConcepts #SMC #CryptoSignals #PriceAction #OrderBlock #CryptoAnalysis #Binance #Altcoins #TradingView #TechnicalAnalysis #CryptoSetup #RiskReward #SupplyDemand
mohamed_yousef_elziny
تجميع مؤسساتي وفرصة ذكية على HIGHUSDT – لا تفوّت التحليل!

تحلیل جفت ارز HIGHUSDT با استفاده از روش SMC 🧠🚀یک فرصت خرید ویژه در جفت ارز HIGHUSDT بر اساس روش Smart Money شناسایی شده است، جایی که عوامل متعددی از ورود به معامله با اطمینان حمایت می کنند. 🔍 نگاهی به تحلیل تکنیکال:نقدینگی از یک کف اصلی جمع آوری شده است، که نشان دهنده حرکت موسسات مالی و جمع آوری موقعیت های خرید است.یک Order Block خرید واضح در تایم فریم مناسب تشکیل شده است و یک بار با یک کندل بازگشتی قوی آزمایش شده است.قیمت ساختار صعودی را حفظ کرده و ساختار صعودی قبلی شکسته نشده است، که روند را مثبت نگه می دارد.از سطح فیبوناچی دقیق برای ورود از یک منطقه واکنش بالا استفاده شده است.هدف در آخرین قله شکسته شده تعیین شده است، که یک منطقه منطقی برای تخلیه نقدینگی و کسب سود است.📍 جزئیات معامله:🟡 ورود (Entry): 0.501000🟢 هدف (TP): 0.568278🔴 حد ضرر (SL): 0.488072📊 نسبت ریسک به پاداش (RR): 1 : 5.20📈 درصد سود مورد انتظار: +13.43%⚠️ شرایط مدیریت معامله:❗️ فعال شدن حد ضرر فقط در صورتی محاسبه می شود که بدنه کندل ساعتی زیر سطح SL بسته شود.❌ اگر قبل از فعال شدن ورود، هدف زده شود، معامله به طور کامل لغو می شود.⚠️ تذکر مهم:این تحلیل توصیه مالی نیست. ورود به معامله مسئولیت شخصی شماست، و باید تحلیل را به خوبی بررسی کنید و به دیدگاه و برنامه مدیریت ریسک خود اعتماد کنید.💬 آیا این معامله را منطقی می دانید؟ نظر خود را در نظرات به اشتراک بگذارید!📊 برای تحلیل های فنی بیشتر، سیگنال های ورود و بحث های مستقیم:تلگرام: @ELZINYTERAD
mohamed_yousef_elziny
ETHUSDT

🧠 Analysis of the ETH/USDT🗓️ The time frame today's current price: about $ 1,790.10. The main points: General direction: The price moves in a cross range with a slight mile towards landing. Request and supply areas: demand zone: between 1,620 and 1,650 dollars, where the price witnessed a previous reversion. Display zone: between 1,850 and 1,900 dollars, which may constitute strong resistance in the case Price rise. Market structure: The price broke several peaks and previous bottoms, indicating fluctuation in the direction. Liquidity: There is liquidity accumulated above the previous peaks at $ 1,850, which may attract the price towards this region before any possible reflection. 1,500 and 1,550 dollars, which may constitute strong support in the event of continuing to drop. The show zone: between 2,000 and 2,100 dollars, which may constitute resistance in the event of a reflux. Liquidity: there is a similar liquidity under the previous bottoms at 1,500 dollars, which may pay the price to test this area. Recommendations and strategies for speculators (short term): monitoring the daily demand area between 1,620 And 1,650 dollars to enter short -term purchase deals, with a loss of a loss below $ 1,600. For investors (long term): wait until the weekly demand area test between 1,500 and $ 1,550 before making investment decisions, while monitoring price behavior in this region. Risk management: determining the stop loss points accurately, and not risk more than 2% of the capital in the one deal please note that this analysis is that this analysis is It is not considered an investment recommendation, and it is always recommended to conduct your analysis and consult a financial advisor before making any investment decisions. 📊 For additional technical analyzes and direct discussions: Telegram: @elzinyterad
mohamed_yousef_elziny
BTCUSDT

🔹 قیمت فعلی BTC/USDT: در حال حاضر، بیت کوین در برابر تتر (BTC/USDT) در حدود 95,356 دلار معامله میشود، با نوساناتی بین 92,867 و 95,516 دلار در طول روز. قیمت الگوی "گوه نزولی" را شکسته و بالاتر از میانگین متحرک 200 روزه تثبیت شده است، که نشاندهنده تغییر روند صعودی است. مناطق عرضه و تقاضا: منطقه تقاضا: حدود 85,000 دلار، جایی که آخرین شکست رخ داد. منطقه عرضه: حدود 100,000 دلار، که یک سطح روانی قوی است و ممکن است شاهد مقاومت باشد. نقدینگی (Liquidity): نقدینگی آشکاری بالاتر از سطح 95,000 دلار وجود دارد، که ممکن است قیمت را برای آزمایش سطوح بالاتر سوق دهد. شاخصهای فنی: شاخص قدرت نسبی (RSI): حدود 57، که نشاندهنده مومنتوم صعودی بدون رسیدن به منطقه اشباع خرید است. شاخص MACD: یک همگرایی صعودی را نشان میدهد، که از احتمال ادامه روند صعودی حمایت میکند. 📅 بازه زمانی هفتگی (Weekly): روند کلی: پس از اصلاح از اوج قبلی در 109,588 دلار، قیمت از منطقه 84,000 دلار برگشته است، که نشاندهنده حمایت قوی در این سطح است. میانگینهای متحرک: قیمت بالاتر از میانگینهای متحرک 7 و 25 هفتهای معامله میشود، که از دیدگاه صعودی حمایت میکند. مناطق حمایت و مقاومت: حمایت: 84,000 - 85,000 دلار. مقاومت: 100,000 دلار، و پس از آن 107,000 دلار به عنوان هدف احتمالی در صورت شکست. 🔮 پیشبینیهای آینده: سناریوی صعودی: اگر قیمت به معامله بالاتر از 95,000 دلار ادامه دهد و سطح 100,000 دلار را با ثبات بشکند، ممکن است 107,000 دلار را به عنوان هدف بعدی دنبال کند. سناریوی نزولی: در صورت عدم موفقیت قیمت در حفظ سطوح حمایت فعلی، ممکن است برای آزمایش مجدد منطقه 85,000 دلار بازگردد. ✅ خلاصه: تحلیلهای فنی با استفاده از متدولوژی SMC نشان میدهد که بیت کوین در مرحله صعودی در بازههای زمانی روزانه و هفتگی قرار دارد، با احتمال هدف قرار دادن سطوح بالاتر در صورت شکست مقاومت روانی در 100,000 دلار. با این حال، باید سطوح حمایت کلیدی در 85,000 دلار را به عنوان یک منطقه حیاتی برای حفظ روند صعودی زیر نظر داشت. 📊 برای تحلیلهای فنی بیشتر و بحثهای مستقیم: تلگرام: @ELZINYTERAD
mohamed_yousef_elziny
MLNUSDT SIGNLS

مناطق ورود به رنگ زرد را در نظر داشته باشید. اگر قبل از شکستن آخرین قله به این مناطق رسید، وارد معامله شوید. نقاط ورود و خروج در نمودار نشان داده شده است، با پتانسیل سود حدود 20 درصد. در صورت شکستن قله، حتی با یک سایه (ویک)، این توصیه باطل میشود. توجه داشته باشید که ورود به معامله مسئولیت شخصی شماست. قبل از ورود، حتماً تحلیل را بررسی کنید. استراتژی بر اساس ICT و SMC است.
mohamed_yousef_elziny
GHSTUSDT SIGNALS

اصلاح و آزمایش مجدد یکی از بهترین استراتژیهای معاملاتی است که با برداشت نقدینگی و اوردر بلاک ترکیب شده است. اگر قیمت قله را نشکند و به ناحیه خرید مشخص شده در نمودار برسد، در این صورت میتوانیم از فعال شدن دستورات خرید و فروش و همچنین حد ضرر (استاپ لاس) مشخص شده در نمودار اطمینان حاصل کنیم.
Disclaimer
Any content and materials included in Sahmeto's website and official communication channels are a compilation of personal opinions and analyses and are not binding. They do not constitute any recommendation for buying, selling, entering or exiting the stock market and cryptocurrency market. Also, all news and analyses included in the website and channels are merely republished information from official and unofficial domestic and foreign sources, and it is obvious that users of the said content are responsible for following up and ensuring the authenticity and accuracy of the materials. Therefore, while disclaiming responsibility, it is declared that the responsibility for any decision-making, action, and potential profit and loss in the capital market and cryptocurrency market lies with the trader.