
ARK
Ark
| تریدر | نوع سیگنال | حد سود/ضرر | زمان انتشار | مشاهده پیام |
|---|---|---|---|---|
No results found. | ||||
Price Chart of Ark
سود 3 Months :
سیگنالهای Ark
Filter
Sort messages by
Trader Type
Time Frame

FortuneAI
آرک (ARK) در آستانه جهش بزرگ؟ تقاضای قوی و سیگنالهای صعودی قدرتمند!
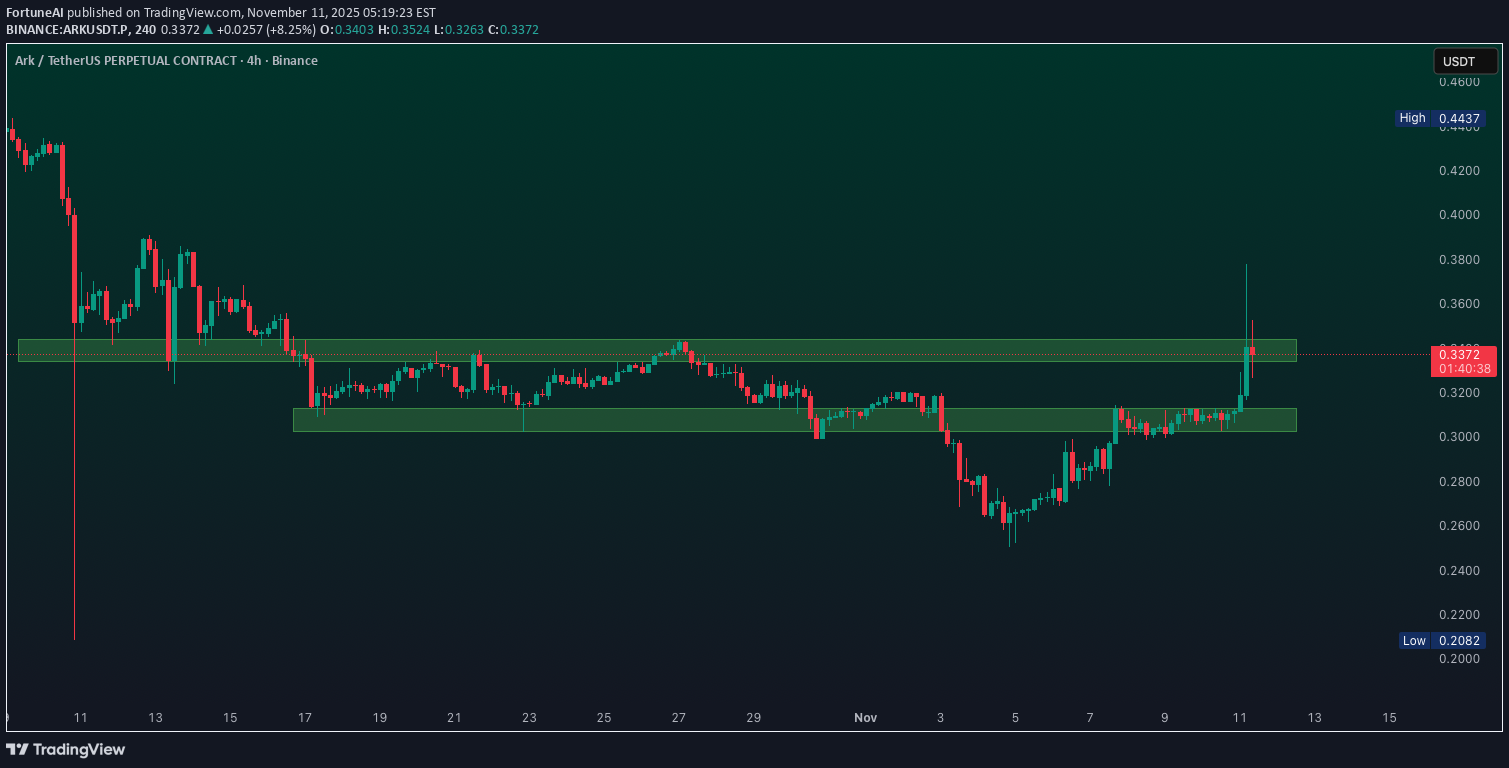
ARK Technicals looking Bullish and Price is sitting between strong liquidity zone. On 2 November, ARK’s DAO approved Proposal #003, adjusting staking cycles to reduce short-term volatility and reward long-term holders. Over 4.4M ARK ($1.5M) is now staked, locking supply. Use Proper Risk Management. ARK was added to Apple Stocks and Yahoo Finance on 10 November, broadening exposure to traditional investors.

yassoo-x2
آرکوسد در آستانه جهش بزرگ؟ تحلیل تکنیکال 4 ساعته و سطوح کلیدی قیمت
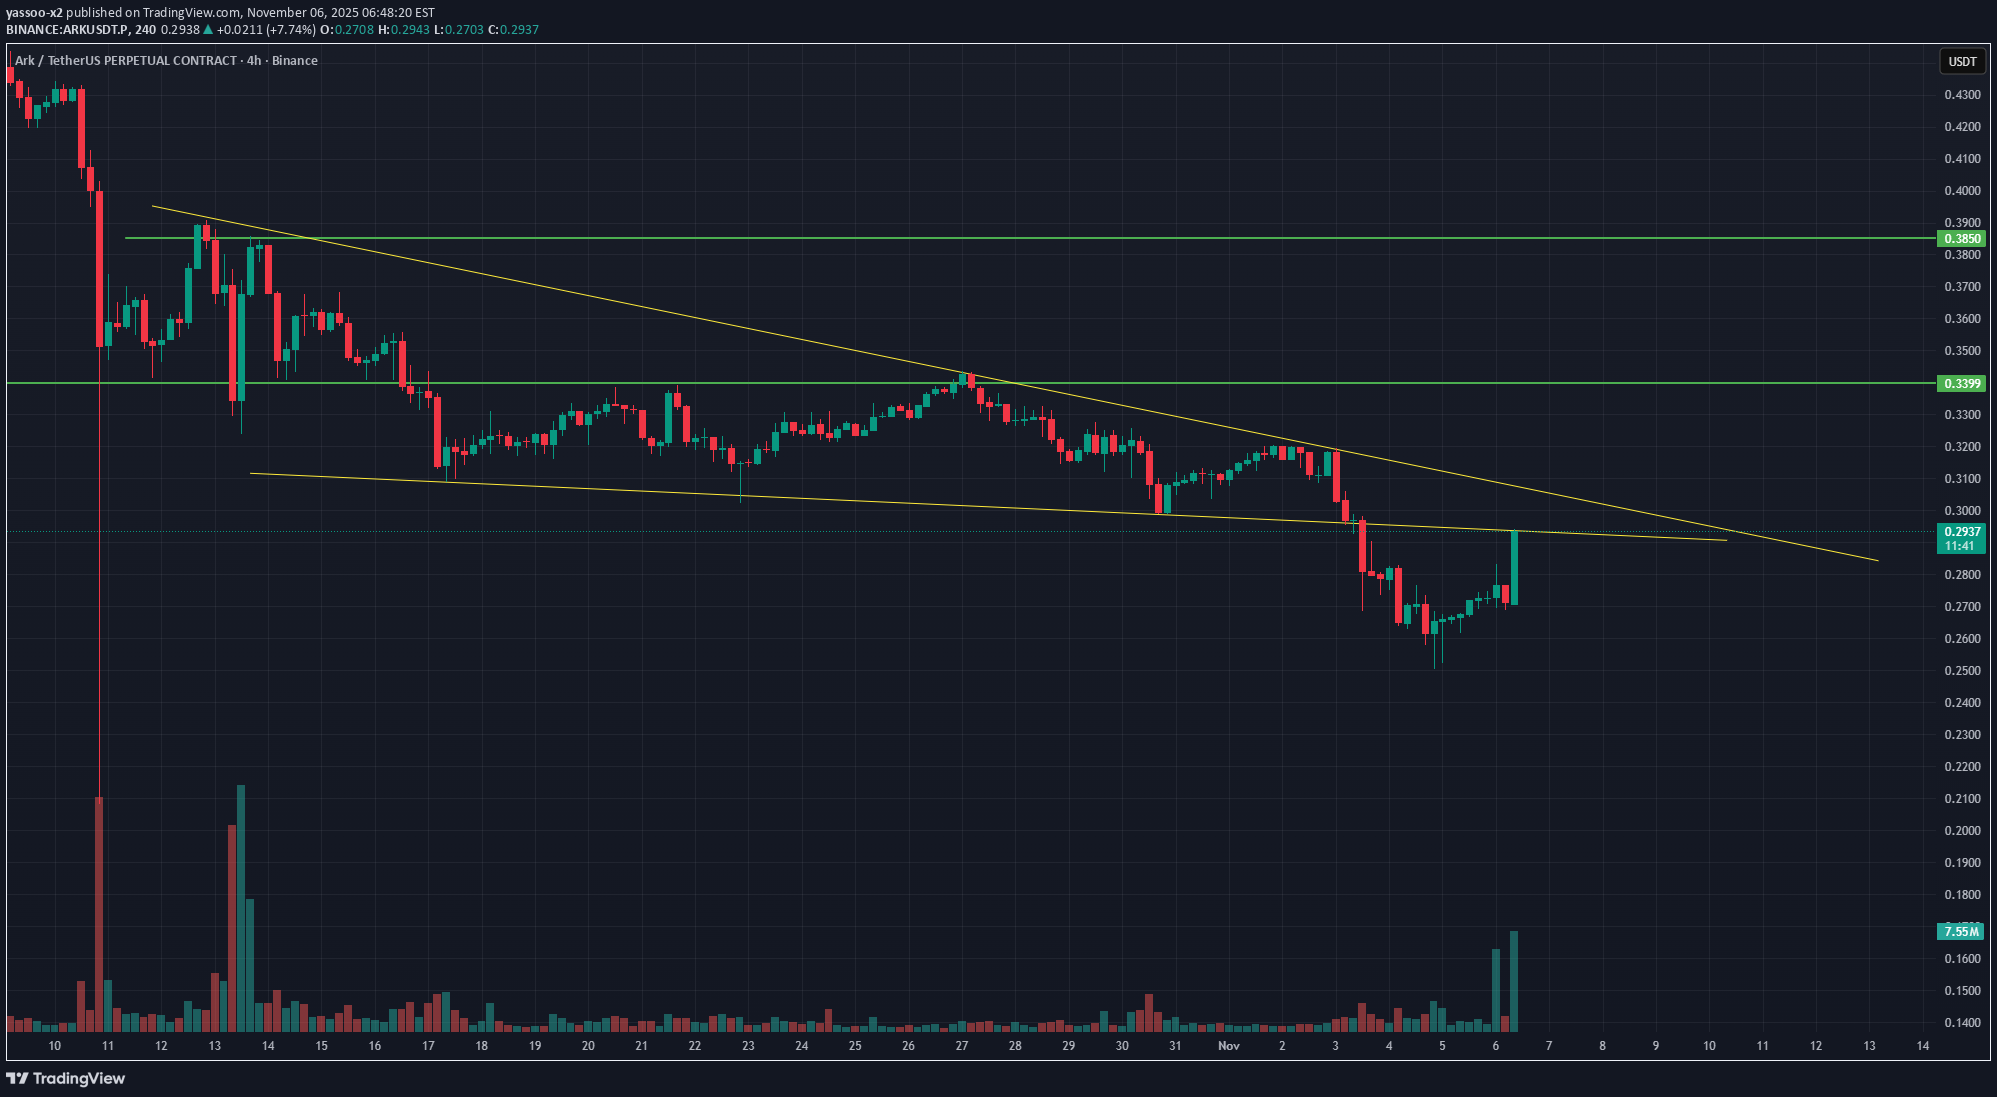
Price is approaching the downtrend resistance after forming a potential falling wedge pattern. A breakout above the yellow trendline could confirm bullish momentum with targets at 0.3399 and 0.385. Volume is increasing, which might support a breakout scenario. 📈 Watching closely for confirmation on the 4H close.

Kapitalist01
تحلیل ارز دیجیتال ARK: چرا این نمودار برای سرمایهگذاری (یا تماشا) مهم است؟
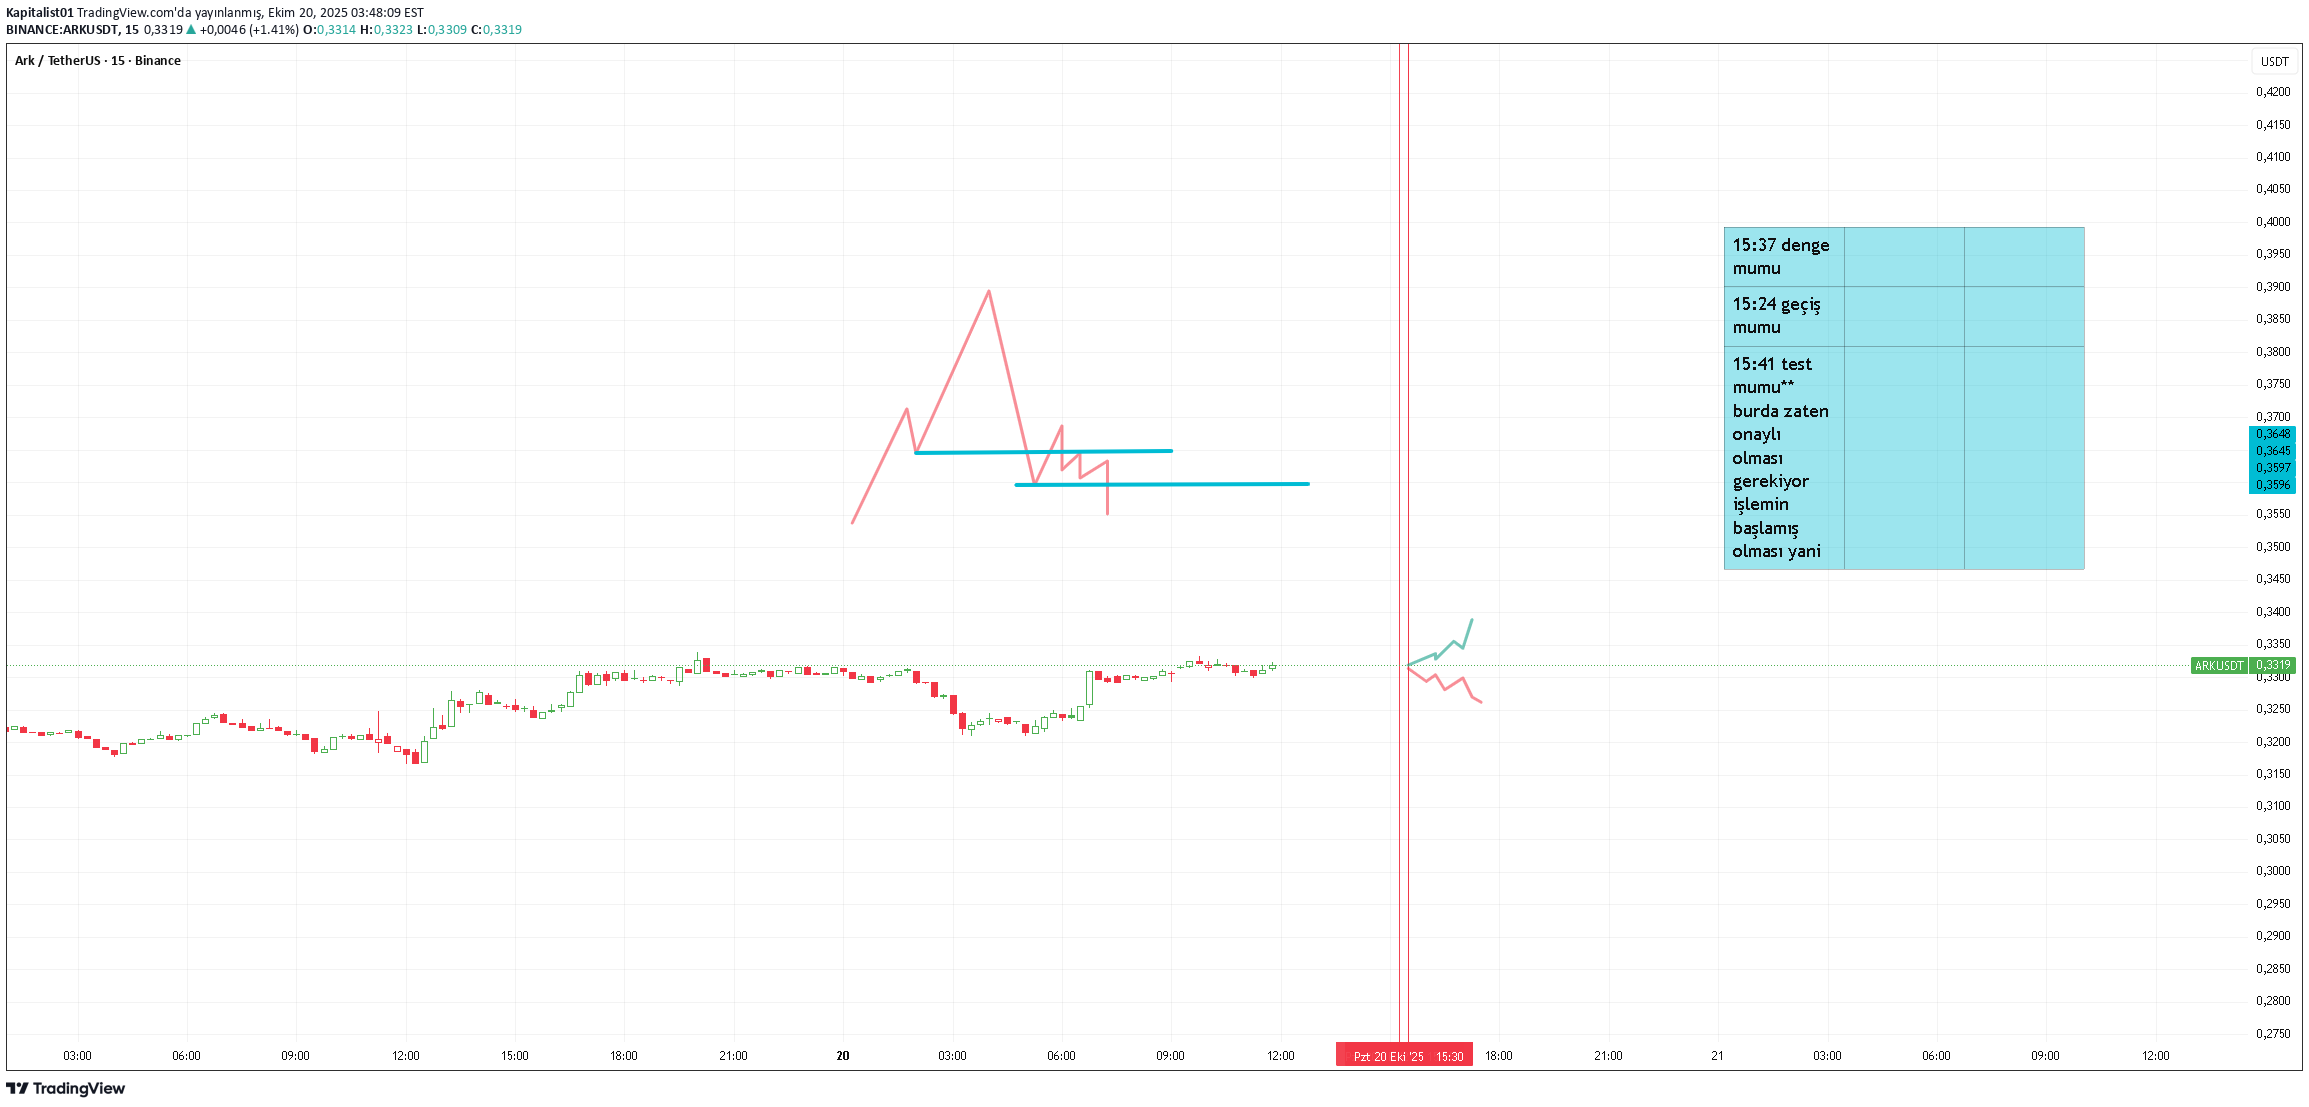
for monitoring purposes. It is not investment advice. The last of the three tenses is more meaningful note to self It is not a buy or sell tut recommendation. Working time for the short term hourly futures market is at 15:24, gradual note to self.

lschipdam
پیشبینی جذاب قیمت ارز دیجیتال آرک کوین (ARK): اهداف صعودی و استراتژی مدیریت ریسک

This setup looks hot, it moves so nice Put a lot of faith in this setup Now, about the projected targets: - The yellow lines are based on the assumption that the yellow triangle line is the real trend line. - The White line is based on the assumption that the low in triangles are in fact the low and therefore the trendline should be there. Still we would have to wait and see! Risk management is key

DaddyYow
ARKUSDT.P LONG
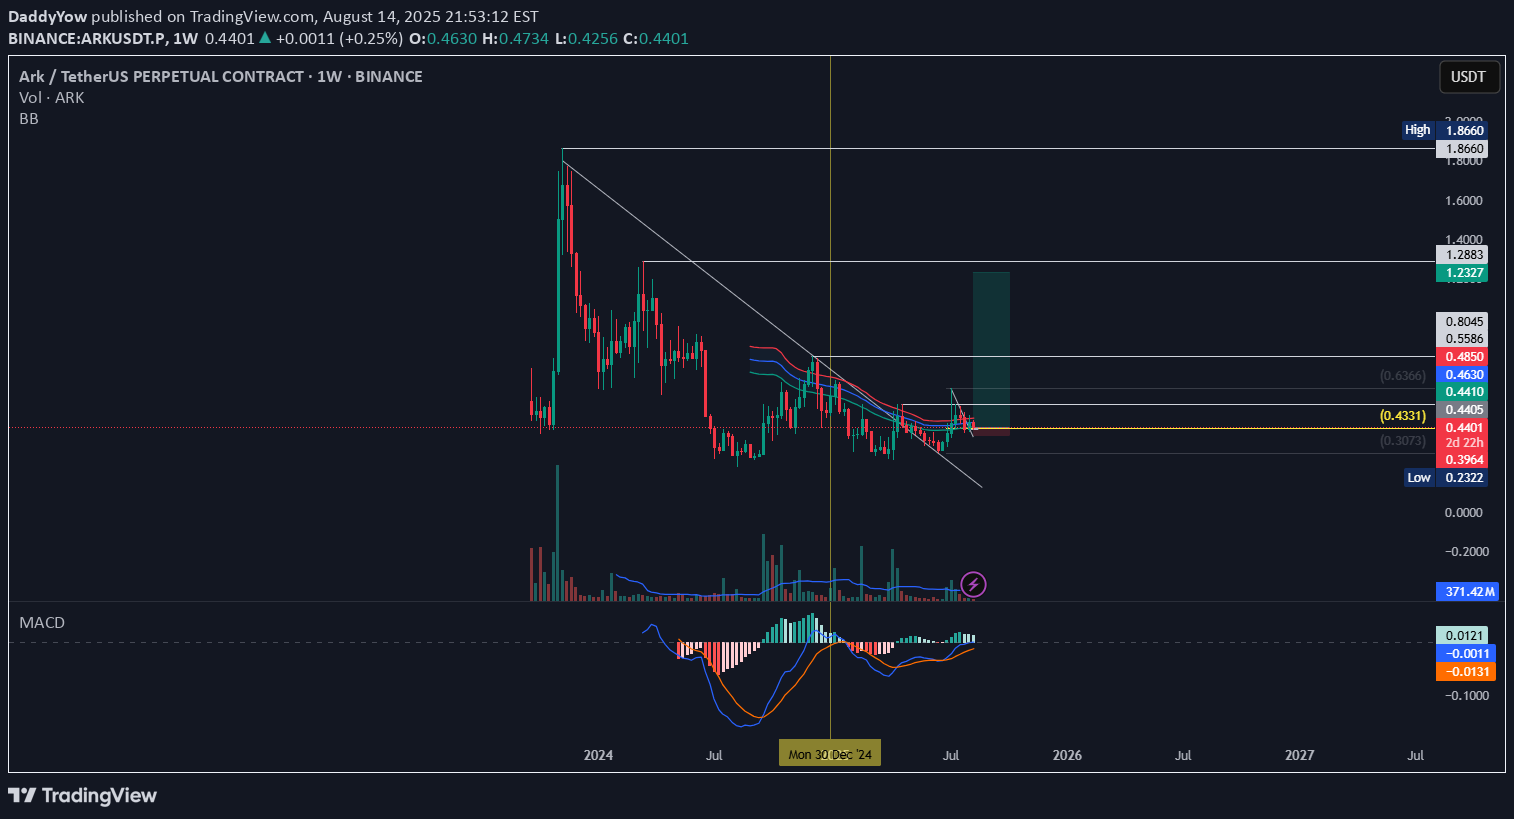
ARKUSDT.P LONG ARKUSDT has broken its long term trendline and now pump and take out our targets. ENTRY: -0.4405 SL: -10% Targets: -0.5586 -0.8045 -1.2883 *Personnaly I'm looking at 1.2327. #DYOR #TYOR #NOTAFINANCIALADVICE Happy trading! Use low Lev and Margin Only!

unichartz
Potential Breakout Setup on ARK/USDT
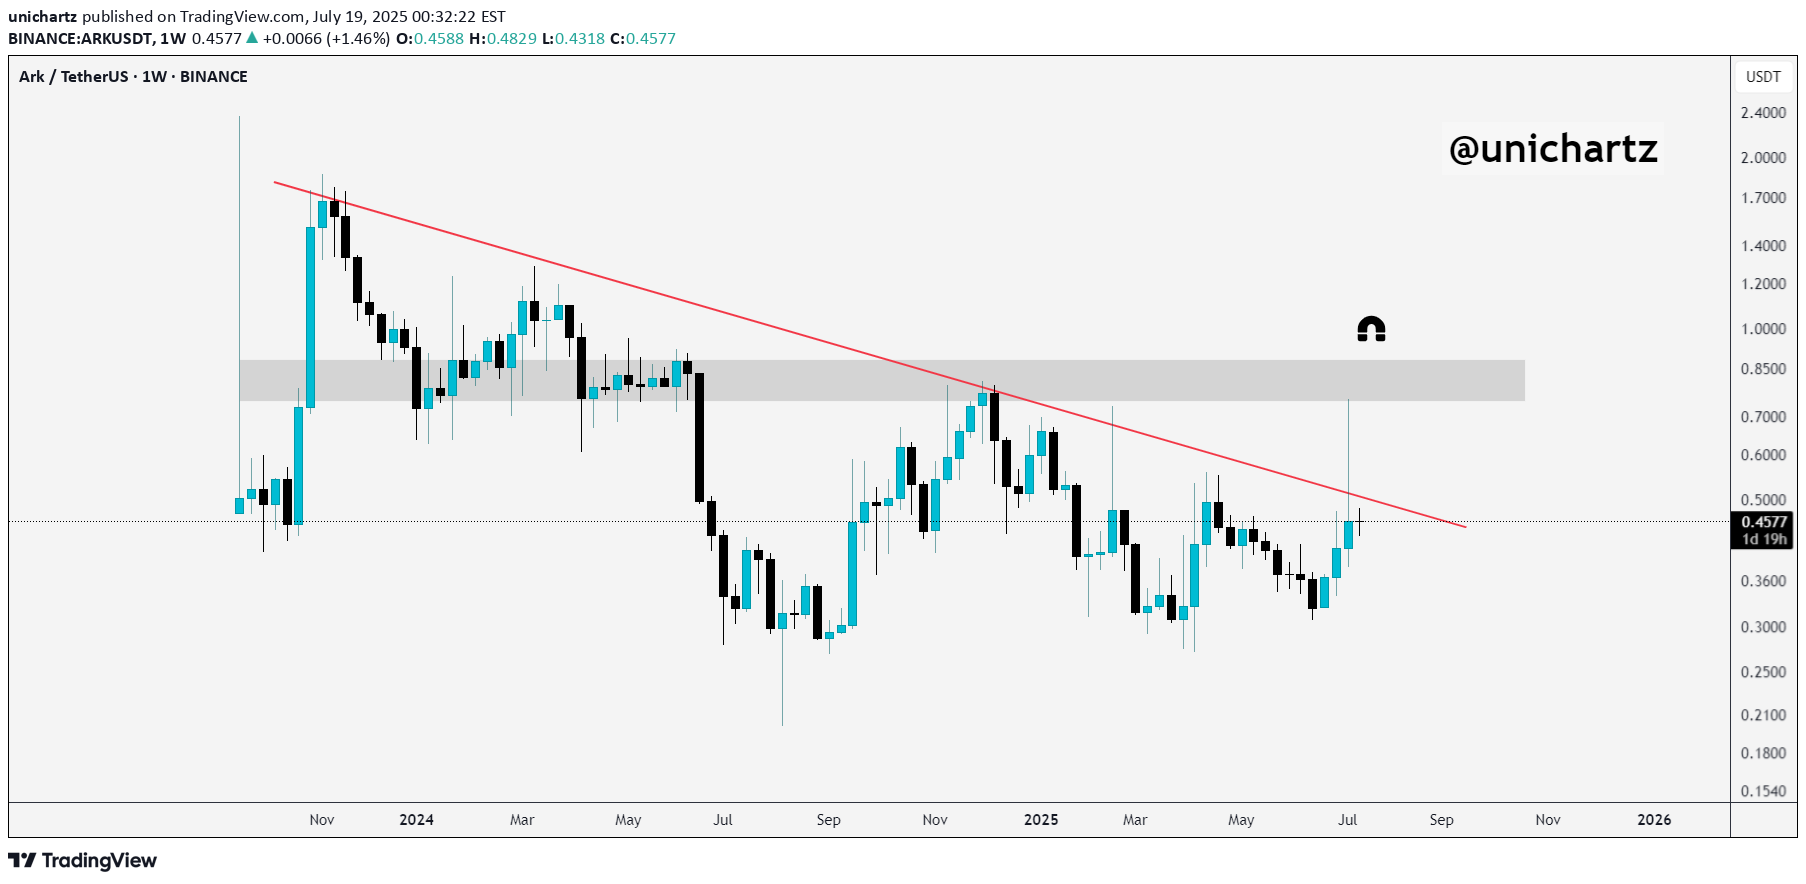
A ARK/USDT Weekly Outlook Price is currently trading just below the trendline resistance. If we get a clean breakout and weekly close above it, there’s a good chance we’ll see a move toward the marked resistance zone above. Add this one to your watchlist — it’s heating up. DYOR, NFA

TheTraderAndy
ARK: 100x in the making
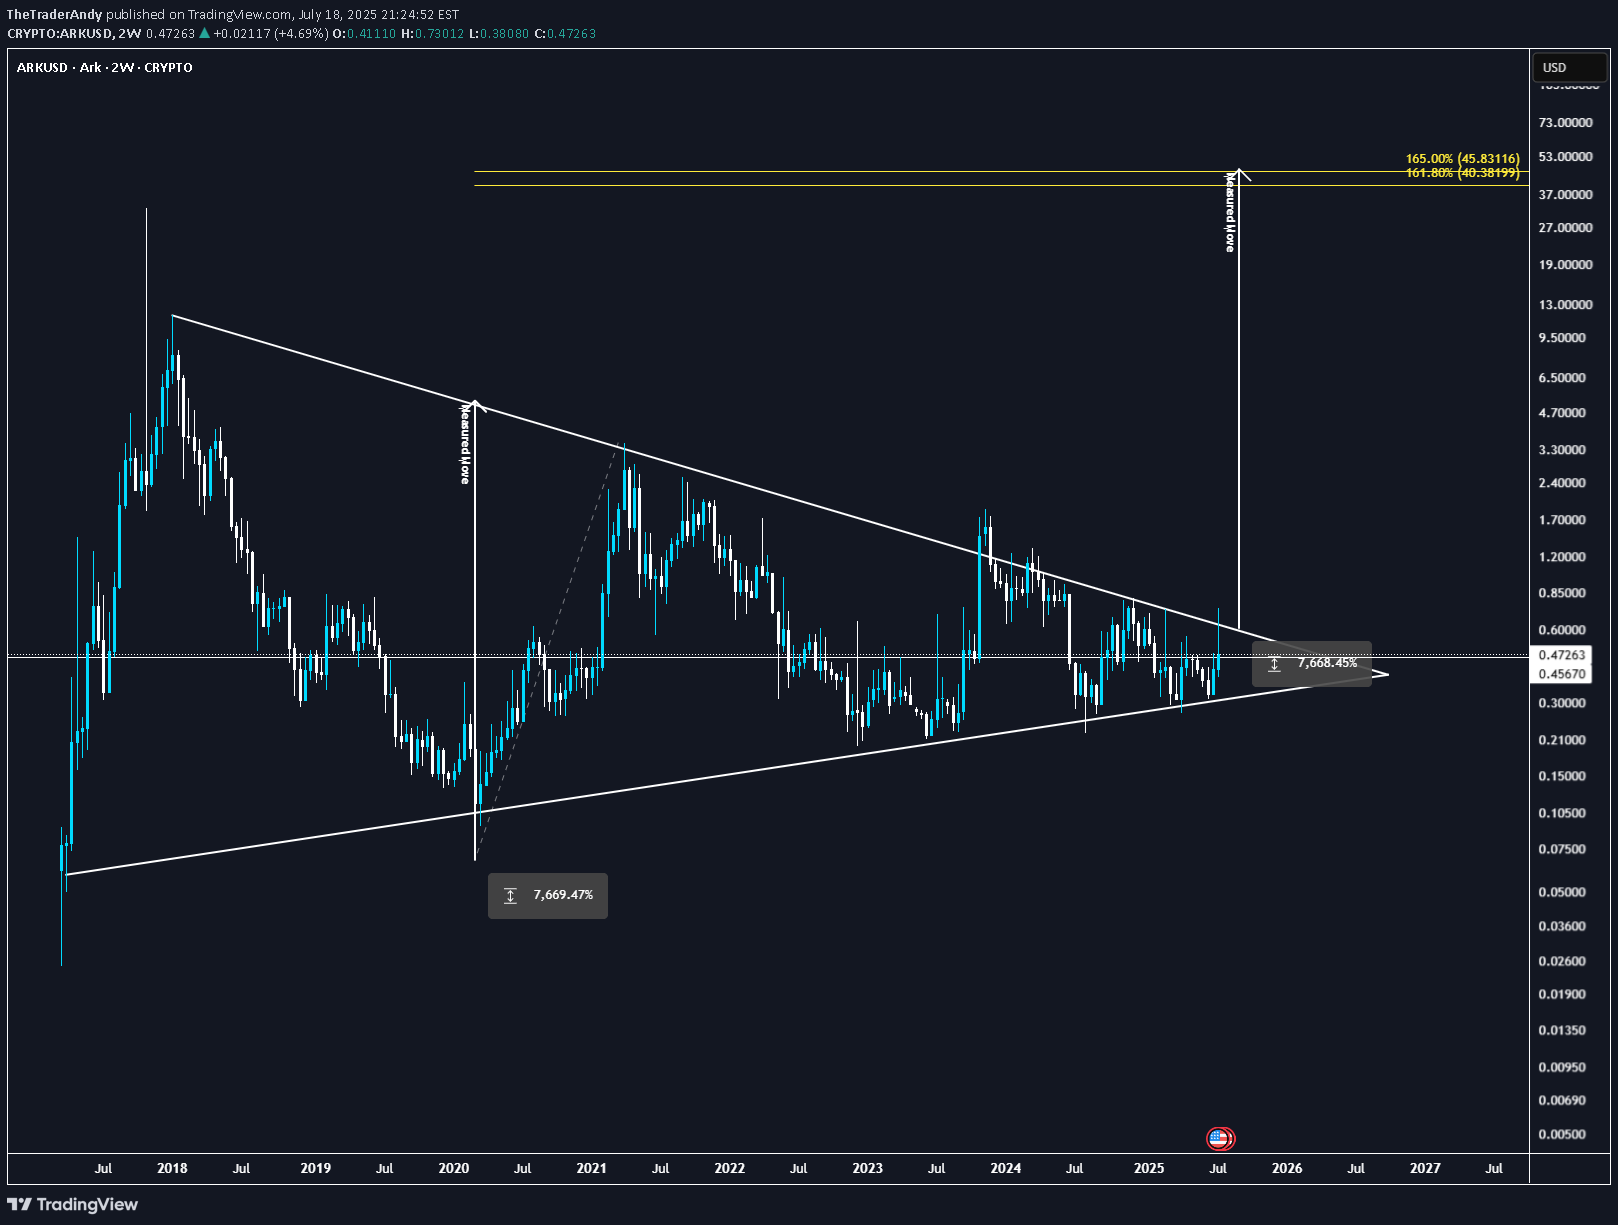
Multi year compression, this is simply one of the best set ups in crypto today. Heavy volume & sharp price moves ARK didn’t just move—it ripped ~75% in one swing, with daily volume pushing $6–7M. Weekly upside is outpacing the market, classic sign of real demand coming in. ARK’s more than a meme—it’s built on Delegated Proof of Stake (DPoS), with forging delegates, fast blocks, and governance on-chain. Utility’s there to support a legit move if adoption increases. Alt season is underway. ARK’s strength isn’t just tagging along—it’s showing independent bullish structure with real volume behind it. ARK’s showing proper strength—strong volume, clean technical structure, ecosystem fundamentals, and broad altcoin momentum.

Alpha-GoldFX
ARKUSDT Forming Bullish Pennant

ARKUSDT is beginning to attract significant attention from traders and investors as fresh buying momentum pushes this pair into the spotlight. With a strong base forming and a healthy increase in volume, ARKUSDT shows signs of strength that could translate into a substantial upside move. Technical traders are watching closely for a breakout above the recent consolidation range, which could easily set the stage for a 40% to 50%+ gain in the coming weeks. The growing interest in this project signals that more participants are positioning themselves for a potential bullish run. Market sentiment around ARKUSDT is improving as investors look for promising altcoins with solid fundamentals and an active community. The crypto market often rewards early movers, and ARK’s chart structure hints at a possible trend reversal. This pair has managed to hold key support levels with confidence, suggesting that buyers are stepping in to defend the zone and accumulate before the next leg higher. A clean breakout above resistance could invite new capital flows, pushing prices toward the projected target range. The volume profile for ARKUSDT is another encouraging factor, confirming that the recent price movements are backed by genuine market interest rather than just speculative spikes. This is crucial for sustainability and follow-through, as consistent volume can fuel a steady climb. As altcoins start to gain traction alongside major pairs like BTC and ETH, ARKUSDT stands out as one of the notable opportunities for traders seeking medium-term gains. ✅ Show your support by hitting the like button and ✅ Leaving a comment below! (What is You opinion about this Coin) Your feedback and engagement keep me inspired to share more insightful market analysis with you!

ARK - a POI

Here a POI (yellow mark) for possible Short.There are good confluences there. 2X Fib and loc-D.Previously those levels ( loc D and POC) gave us nice Long and Short opportunities.Here a higher TF : Follow for more ideas/Signals.💲Check out my previous TA/Signals which played out nicely. :)Just donate some of your profit to Animal rights or other charity :)✌️That marked yellow level (which is confluence of daily, fib and some vol levels) was EXACT Sniping entry level predicted days ago.BOOOOM ! over 5% and going ... 🎯 👌

REALTARDER
Long İşlem Fırsatı

پس از شکست مثلث و پولبک انجام شده، قدرت خود را جمع آوری کرده و پس از یک اصلاح جزئی، به سرعت به سمت بالا حرکت کرد.
Disclaimer
Any content and materials included in Sahmeto's website and official communication channels are a compilation of personal opinions and analyses and are not binding. They do not constitute any recommendation for buying, selling, entering or exiting the stock market and cryptocurrency market. Also, all news and analyses included in the website and channels are merely republished information from official and unofficial domestic and foreign sources, and it is obvious that users of the said content are responsible for following up and ensuring the authenticity and accuracy of the materials. Therefore, while disclaiming responsibility, it is declared that the responsibility for any decision-making, action, and potential profit and loss in the capital market and cryptocurrency market lies with the trader.