
ARDR
Ardor
| تریدر | نوع سیگنال | حد سود/ضرر | زمان انتشار | مشاهده پیام |
|---|---|---|---|---|
No results found. | ||||
Price Chart of Ardor
سود 3 Months :
سیگنالهای Ardor
Filter
Sort messages by
Trader Type
Time Frame

Alpha-GoldFX
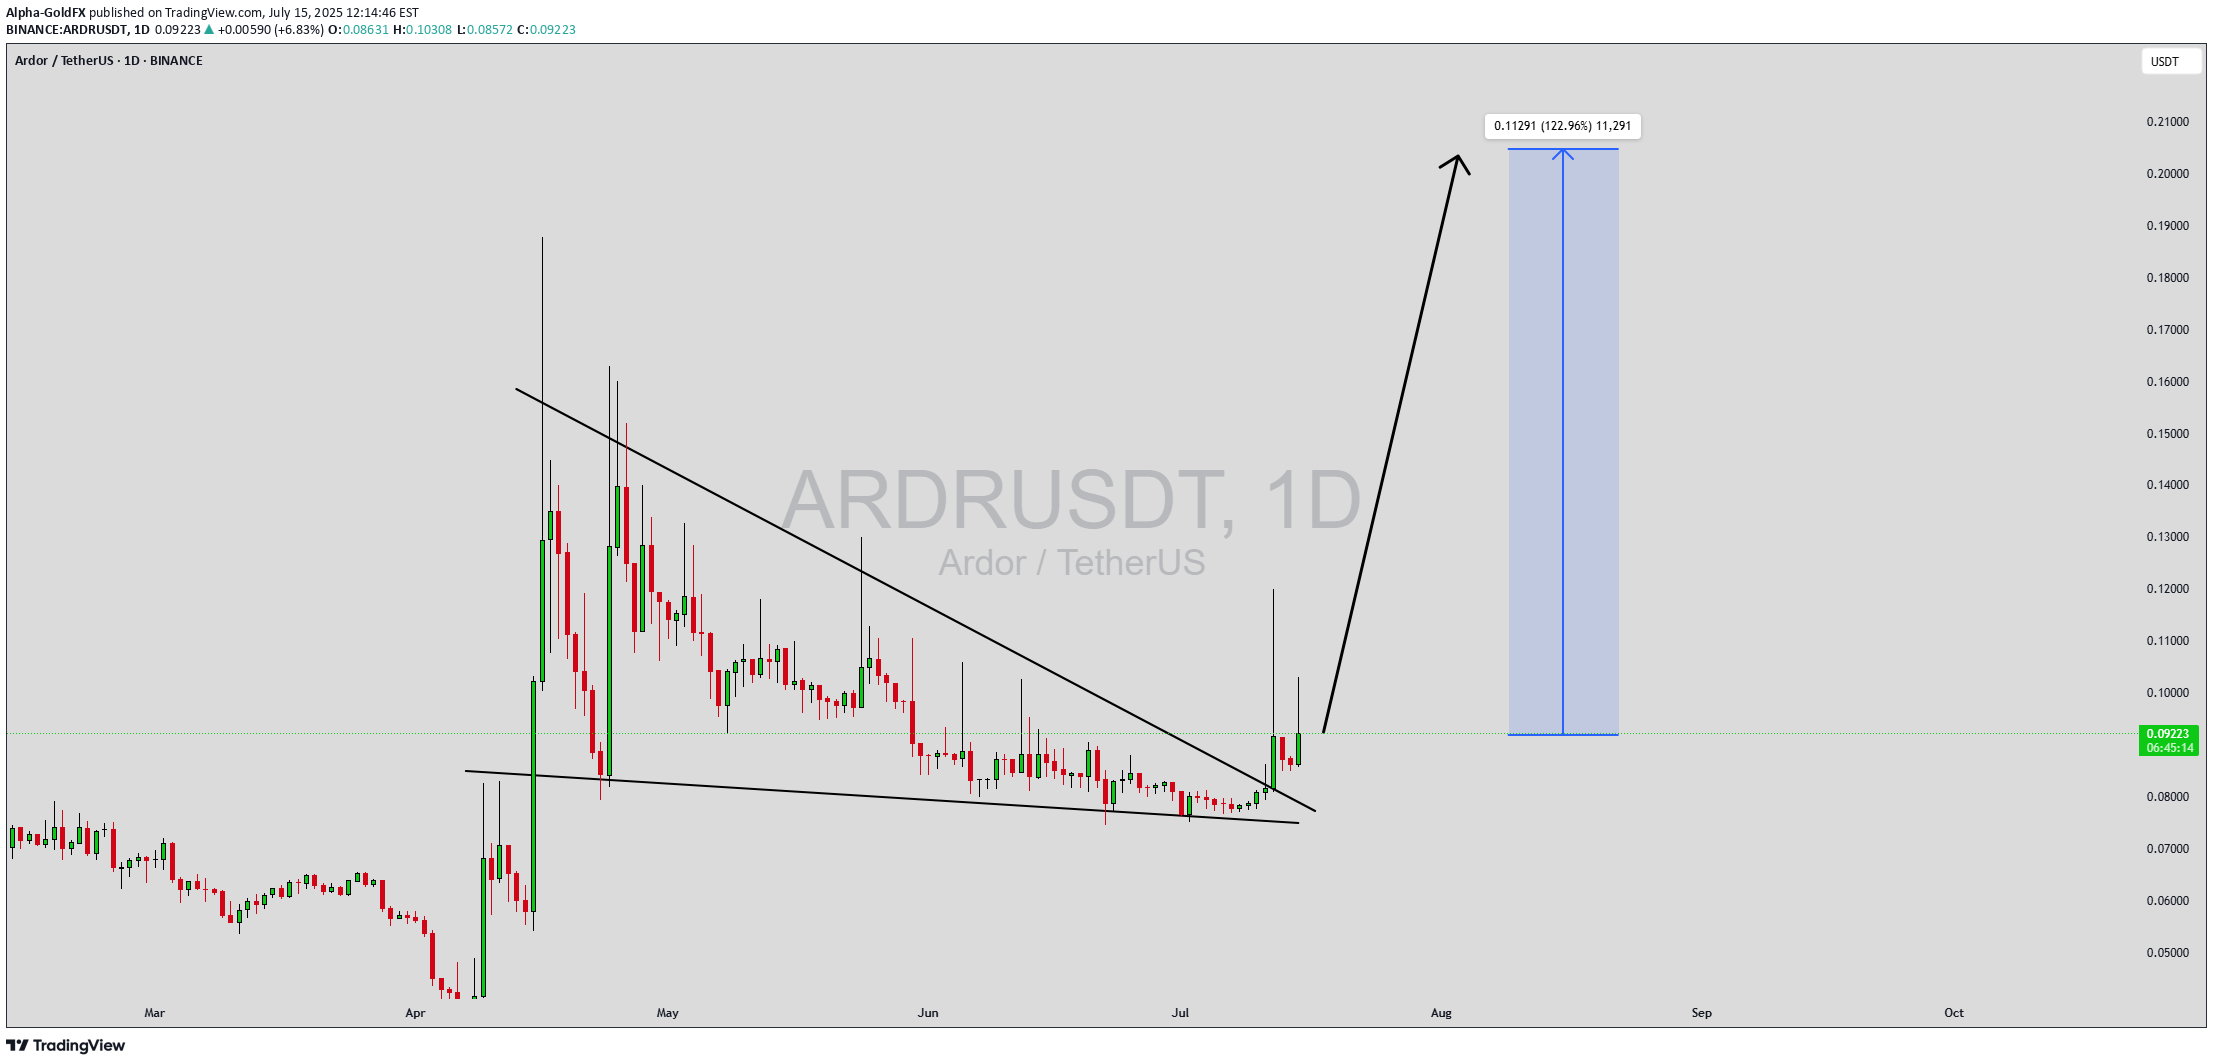
ARDRUSDT Forming Falling Wedge

ARDRUSDT is displaying a strong bullish technical structure following the successful breakout from a falling wedge pattern—a formation typically associated with trend reversals and substantial upside moves. This breakout is accompanied by solid volume, which further validates the move and hints at strong buying interest. Historically, falling wedge breakouts have produced impressive gains, and in this case, the chart is suggesting a potential rally in the range of 90% to 100%+. Ardor (ARDR) is gaining traction among traders and long-term investors due to its scalable blockchain infrastructure and real-world applications, especially in enterprise use cases. As the project continues to evolve, market participants are starting to take note of its utility and strong development backing. The recent price consolidation within the wedge and the explosive breakout is a textbook signal for bullish continuation, especially when it occurs after prolonged accumulation. The price target zones projected on the chart—up to the 0.1129 USDT level—highlight the bullish momentum that may follow. Technical indicators such as MACD crossover and RSI divergence also support this outlook. If the current trend persists and market sentiment remains supportive, ARDRUSDT could easily hit and even surpass these levels, delivering triple-digit percentage returns. This setup represents a classic high-reward scenario for both breakout traders and position holders aiming to capitalize on mid-term trends. Keep an eye on volume spikes, as they often precede or confirm large moves. With overall market sentiment leaning bullish and increasing social engagement, ARDR is shaping up to be a potential breakout performer in the coming weeks. ✅ Show your support by hitting the like button and ✅ Leaving a comment below! (What is You opinion about this Coin) Your feedback and engagement keep me inspired to share more insightful market analysis with you!
Alpha-GoldFX
ARDRUSDT Forming Bullish Wave

ARDRUSDT is currently demonstrating a strong bullish wave pattern, indicating a powerful shift in market momentum. After a period of accumulation, the price has begun to trend upward with higher highs and higher lows forming on the chart. This bullish structure, supported by healthy trading volume, points to increasing confidence among traders and investors. If the pattern continues to hold, we can expect a significant breakout, with potential gains estimated between 90% to 100% in the near term. The Ardor platform is gaining renewed attention in the blockchain space due to its unique multi-chain architecture and real-world applications, especially in enterprise solutions. As interest in scalable and interoperable blockchain ecosystems grows, ARDR is beginning to surface on more investors’ radars. The technical breakout is aligning well with this growing fundamental support, providing added conviction for bullish traders. From a trading perspective, the current breakout offers a solid entry opportunity, especially if the price consolidates above recent resistance levels. Traders should watch for volume surges and continuation candles as confirmation of the bullish trend. With strong technical indicators aligning with positive sentiment, ARDRUSDT could become one of the leading performers in the upcoming altcoin rally. ✅ Show your support by hitting the like button and ✅ Leaving a comment below! (What is You opinion about this Coin) Your feedback and engagement keep me inspired to share more insightful market analysis with you!
Alpha-GoldFX
ARDRUSDT Forming Bullish Breakout
ARDRUSDT is showing a highly promising setup that is catching the eyes of crypto traders looking for the next big breakout. The chart displays a clear structure that suggests a significant move could be imminent. With volume picking up steadily, the pair is indicating strong buyer interest, which supports the potential for a sharp upward surge. The current market sentiment combined with this technical formation points towards a likely bullish continuation that could deliver impressive gains for patient holders. What makes ARDRUSDT stand out right now is the clear consolidation phase it has been undergoing, which often precedes explosive price action. As traders search for undervalued altcoins, ARDR is increasingly appearing on their radar due to its history of strong price swings and its current attractive technical setup. The market is closely watching the resistance levels, and a confirmed breakout could attract even more momentum-driven buying pressure, potentially driving the price towards the projected gain of 90% to 100%+. Investors are showing renewed interest in ARDRUSDT because of its strong community support and its role within the blockchain ecosystem. With the broader crypto market stabilizing and altcoins regaining traction, ARDR could benefit from increased capital flow into smaller-cap projects that have room for growth. If the breakout holds with solid volume, this pair could easily outperform many peers in the coming weeks. ✅ Show your support by hitting the like button and ✅ Leaving a comment below! (What is You opinion about this Coin) Your feedback and engagement keep me inspired to share more insightful market analysis with you!
Alpha-GoldFX
ARDRUSDT Forming Descending Triangle

ARDRUSDT is showing a powerful breakout from a descending triangle pattern, indicating a strong bullish reversal in progress. The breakout candle is backed by solid volume, reinforcing the strength of the move and hinting at a potential trend shift. Historically, this pattern signals the end of consolidation and the start of a significant upward rally, especially when confirmed by a volume surge as seen here.With the price currently above key resistance levels, ARDR is now poised for a sharp move to the upside. The projected gain stands around 90% to 100%+, based on the height of the triangle formation and historical breakout behavior. This makes ARDRUSDT a high-reward setup for swing traders and mid-term holders who are looking for undervalued assets with upside potential in the altcoin space.The Ardor blockchain project has continued to evolve in the background, with real-world use cases and innovative multi-chain architecture. As the market begins to price in utility-driven growth, coins like ARDR tend to outperform during bullish cycles. Moreover, increased investor interest in lower-cap, fundamentally strong altcoins is starting to reflect in the current price momentum.Given the technical breakout and rising community engagement, ARDR could attract more attention in the coming days. Keep an eye on this pair as it potentially leads the next wave of altcoin rallies, especially if Bitcoin maintains stability or trends upward.✅ Show your support by hitting the like button and✅ Leaving a comment below! (What is You opinion about this Coin)Your feedback and engagement keep me inspired to share more insightful market analysis with you!

EkyFabyanto
Bullish Pennant in ARDR: A Pause Before Another Rally

After an aggressive surge marked by a big green candle, ARDRUSDT is now moving sideways. This sideways action represents a "voting phase" between buyers and sellers — a battle to decide who will take control next. Looking at the current price structure, this consolidation is setting up a potential continuation move toward the next target zone at 0.15199 – 0.15900. Technically, the sideways movement is forming a bullish pennant pattern — a classic sign where price briefly pauses after a strong rally, gathering momentum before continuing its upward trend. One thing to watch: after breaking the previous high (marked by the red arrow), price should not fall back into the pennant structure. A re-entry would weaken the bullish setup. As long as price holds above the key support at 0.12273, the bullish scenario remains intact. What's your view on this setup?

Zorroreny
ARDR - ready for breakout

ARDR did fakeout dip (just like in March 2020), created bullish divergence and then bounced up strongly. I believe we are in same phase as we were in May 2020, so expecting few weeks of ranging here before breaking trough major diagonal resistance and run for test of fibb 0.886 range, possible even wick of March 2021 pivot (would be bullish signal for future).

WaveRiders2
Waiting for Green Light!

🚀 AARDR - Waiting for Green Light! 🚦📈 Price pumped, now observing for a pullback to the green zone (potential support). 👀 Looking for a solid entry for the next leg up! ⬆️

aet61
ARDRUSDT //

According to your risk perception, our first target point is 8 exponential moving average. Our second target point is Kaufman indicator. Stop loss would be the right decision in closings below 0.04301 level.

SignalEdge

We can attempt to buy ARDRUSDT from specified level as it makes HL , also 0.786 FIB level intact indicate that it moves upward.SL , TP mention in chart.

navid_aerospace

ARDRUSDT: Blue Box Looks Promising! 🚀Here’s the quick breakdown:Volume Surge: A 100% daily volume spike—buyers are waking up!Key Zone: The blue box is shaping up to be a strong potential demand zone.Next Steps: Waiting for confirmation—bullish market structure breaks on lower time frames or a strong reaction with CDV support.This setup looks like a great opportunity if conditions align. Patience is key here—don’t chase the move, let the trade come to you.Boost, comment, and follow for more insights like this! Let’s make it happen! 💪Let me tell you, this is something special. These insights, these setups—they’re not just good; they’re game-changers. I've spent years refining my approach, and the results speak for themselves. People are always asking, "How do you spot these opportunities?" It’s simple: experience, clarity, and a focus on high-probability moves.Want to know how I use heatmaps, cumulative volume delta, and volume footprint techniques to find demand zones with precision? I’m happy to share—just send me a message. No cost, no catch. I believe in helping people make smarter decisions.Here are some of my recent analyses. Each one highlights key opportunities:🚀 RENDERUSDT: Strategic Support Zones at the Blue Boxes +%45 Reaction🎯 PUNDIXUSDT: Huge Opportunity | 250% Volume Spike - %60 Reaction Sniper Entry🌐 CryptoMarkets TOTAL2: Support Zone🚀 GMTUSDT: %35 FAST REJECTION FROM THE RED BOX🎯 ZENUSDT.P: Patience & Profitability | %230 Reaction from the Sniper Entry🐶 DOGEUSDT.P: Next Move🎨 RENDERUSDT.P: Opportunity of the Month💎 ETHUSDT.P: Where to Retrace🟢 BNBUSDT.P: Potential Surge📊 BTC Dominance: Reaction Zone🌊 WAVESUSDT.P: Demand Zone Potential🟣 UNIUSDT.P: Long-Term Trade🔵 XRPUSDT.P: Entry Zones🔗 LINKUSDT.P: Follow The River📈 BTCUSDT.P: Two Key Demand Zones🟩 POLUSDT: Bullish Momentum🌟 PENDLEUSDT.P: Where Opportunity Meets Precision🔥 BTCUSDT.P: Liquidation of Highly Leveraged Longs🌊 SOLUSDT.P: SOL's Dip - Your Opportunity🐸 1000PEPEUSDT.P: Prime Bounce Zone Unlocked🚀 ETHUSDT.P: Set to Explode - Don't Miss This Game Changer🤖 IQUSDT: Smart Plan⚡️ PONDUSDT: A Trade Not Taken Is Better Than a Losing One💼 STMXUSDT: 2 Buying Areas🐢 TURBOUSDT: Buy Zones and Buyer Presence🌍 ICPUSDT.P: Massive Upside Potential | Check the Trade Update For Seeing Results🟠 IDEXUSDT: Spot Buy Area | %26 Profit if You Trade with MSB 📌 USUALUSDT: Buyers Are Active + %70 Profit in Total🌟 FORTHUSDT: Sniper Entry +%26 Reaction🐳 QKCUSDT: Sniper Entry +%57 Reaction📊 BTC.D: Retest of Key Area Highly LikelyThis list? It’s just a small piece of what I’ve been working on. There’s so much more. Go check my profile, see the results for yourself. My goal is simple: provide value and help you win. If you’ve got questions, I’ve got answers. Let’s get to work!First area gave +%25 reaction. Second area is active.
Disclaimer
Any content and materials included in Sahmeto's website and official communication channels are a compilation of personal opinions and analyses and are not binding. They do not constitute any recommendation for buying, selling, entering or exiting the stock market and cryptocurrency market. Also, all news and analyses included in the website and channels are merely republished information from official and unofficial domestic and foreign sources, and it is obvious that users of the said content are responsible for following up and ensuring the authenticity and accuracy of the materials. Therefore, while disclaiming responsibility, it is declared that the responsibility for any decision-making, action, and potential profit and loss in the capital market and cryptocurrency market lies with the trader.