
EkyFabyanto
@t_EkyFabyanto

What symbols does the trader recommend buying?
Purchase History
پیام های تریدر
Filter
EkyFabyanto
آیا بیت کوین به کف قیمتی رسیده است؟ تحلیل شگفتانگیز از بازگشت احتمالی BTC
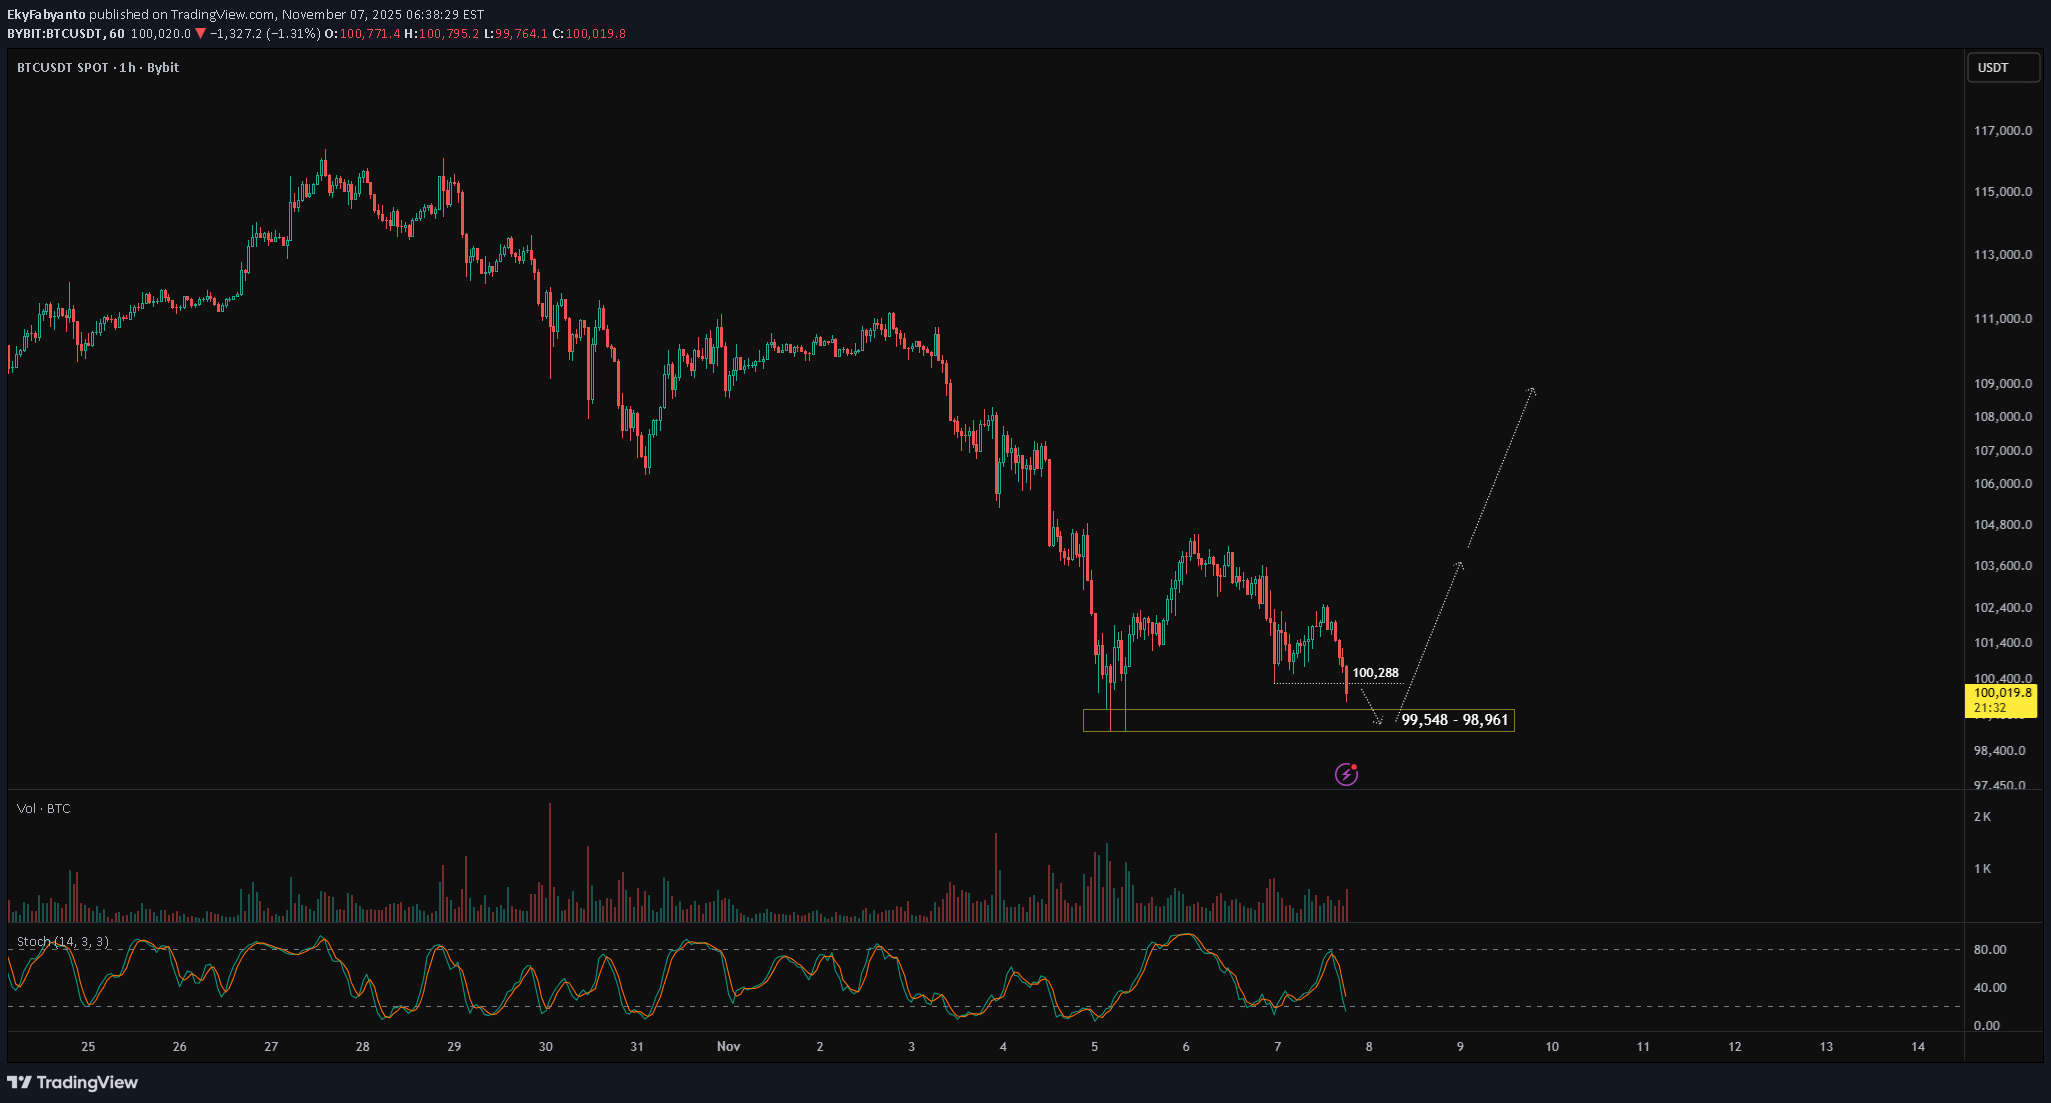
Everyone says the crypto market is already in a bearish season, but I have a different scenario Yes in the past few weeks BTCUSDT has dropped significantly, around -21% from its peak at $126,195. However, I see that on the weekly chart, the price is still holding above $100,731 and $98,185. As long as the weekly candle doesn’t close below $102,329, there’s still a chance for BTCUSDT to continue its bullish move. Now, let’s zoom in to the hourly chart to find potential areas for a price rebound. On the hourly timeframe, there was a break below $100,288, with the next downside target around $99,548 – $98,961. But if we look closely, the drop that happened on November 6th, 2026, at 02:00 AM (GMT+7) wasn’t as aggressive as the previous one. It seems that the seller’s momentum has started to fade since that period, which could indicate a shift from sellers to buyers. Since the selling pressure is weakening, my scenario is that the decline in BTCUSDT will likely stop around $99,548 – $98,961, and from there, a significant rebound may follow. That’s my view on BTCUSDT , what’s yours?
EkyFabyanto
Failed Wedge, New Setup. Is SUI About to Break Out?

In my previous post about SUIUSDT , I mentioned a potential falling wedge pattern. However, the breakout above the 4.0040 resistance turned out to be a false breakout, and the price eventually dropped to the invalidation level at 3.5868. This made the setup invalid. But despite the failed wedge breakout, SUIUSDT remains in a bullish trend overall. During the current consolidation, the price appears to be forming a new bullish pattern — a Descending Broadening Wedge (DBW). This pattern typically starts with low volatility and gradually widens. Once price reaches its lower boundary, it often experiences a strong breakout to the upside. Let’s break down the key price action in this DBW setup: Price is moving within a Descending Broadening Wedge and is currently near the lower boundary of the pattern. It’s also sitting around a key support level at 3.4833. A rejection candle formed right at 3.4833, showing the market’s response to this support area. A reversal confirmation would come if the price breaks above 3.6102. A bullish divergence is also visible — price is forming lower lows, while the stochastic indicator is forming higher lows. Based on these five price action signals, it seems that buyers are still in control, even though short-term volatility has created a series of lower lows. That’s why I still believe SUIUSDT has more room to go up. What’s your take on this?After waiting a couple of hours to see how the price would react around the support area, SUIUSDT is now retesting its support zone at 3.4833 – 3.4050 (recently adjusted support range). The price action around this area is quite interesting — the downside momentum has started to slow down, there's a clear rejection near support, and an inside bar candlestick pattern has formed. A breakout above 3.5168 could serve as a confirmation of a potential price reversal and a valid entry point, with a stop-loss below 3.4050 and upside targets remaining at 4.7996 and 5.0552. Here's my updated chart
EkyFabyanto
Coiling for a Breakout – Watch This Level

After a strong upward move, SUIUSDT is currently consolidating in a sideways range, forming what appears to be a falling wedge pattern — a classic bullish continuation setup. If this pattern plays out, there's a good chance the price will resume its uptrend, supported by a bullish divergence forming within the wedge. The key level to watch is the resistance at 4.0040. A clean breakout above this level should be backed by strong momentum. However, if the price breaks above but quickly drops back below 4.0040, it could signal a lack of buying pressure — increasing the risk of a failed breakout. This bullish scenario remains valid as long as the price holds above 3.5868. The next potential upside targets are 4.7996 and 5.0552. Keep an eye out for a high-volume breakout and a strong candle close above 4.0040 to confirm the move. What’s your take on SUIUSDT ?
EkyFabyanto
When Moving Averages Meet the Demand Zone

One of the simplest ways to identify the market trend is by using the moving average (MA) indicator. When price moves above the MA, it's generally considered an uptrend. When price moves below the MA, it's seen as a downtrend. Aside from showing the trend, moving averages can also act as dynamic support and resistance: In an uptrend, the MA acts as support — meaning if price retraces into the MA, it often bounces back and continues upward. In a downtrend, the MA acts as resistance — price tends to reject the MA and move lower. In WIFUSDT , the moving average is currently acting as support, and price is pulling back into a confluence zone between 0.584 – 0.558, where the MA meets a demand zone. This setup increases the probability of the pullback ending and the uptrend continuing. The confirmation for a bullish continuation would be a break and close above 0.620. If that happens, the next target zone is between 0.763 – 0.789. Keep a close eye when price approaches the previous high. The ideal scenario is a strong impulsive breakout. The worst-case scenario would be a rejection or false breakout from that level. Alright, what's your take on WIFUSDT ?
EkyFabyanto
Pullback's Almost Over — Get In Before It Runs
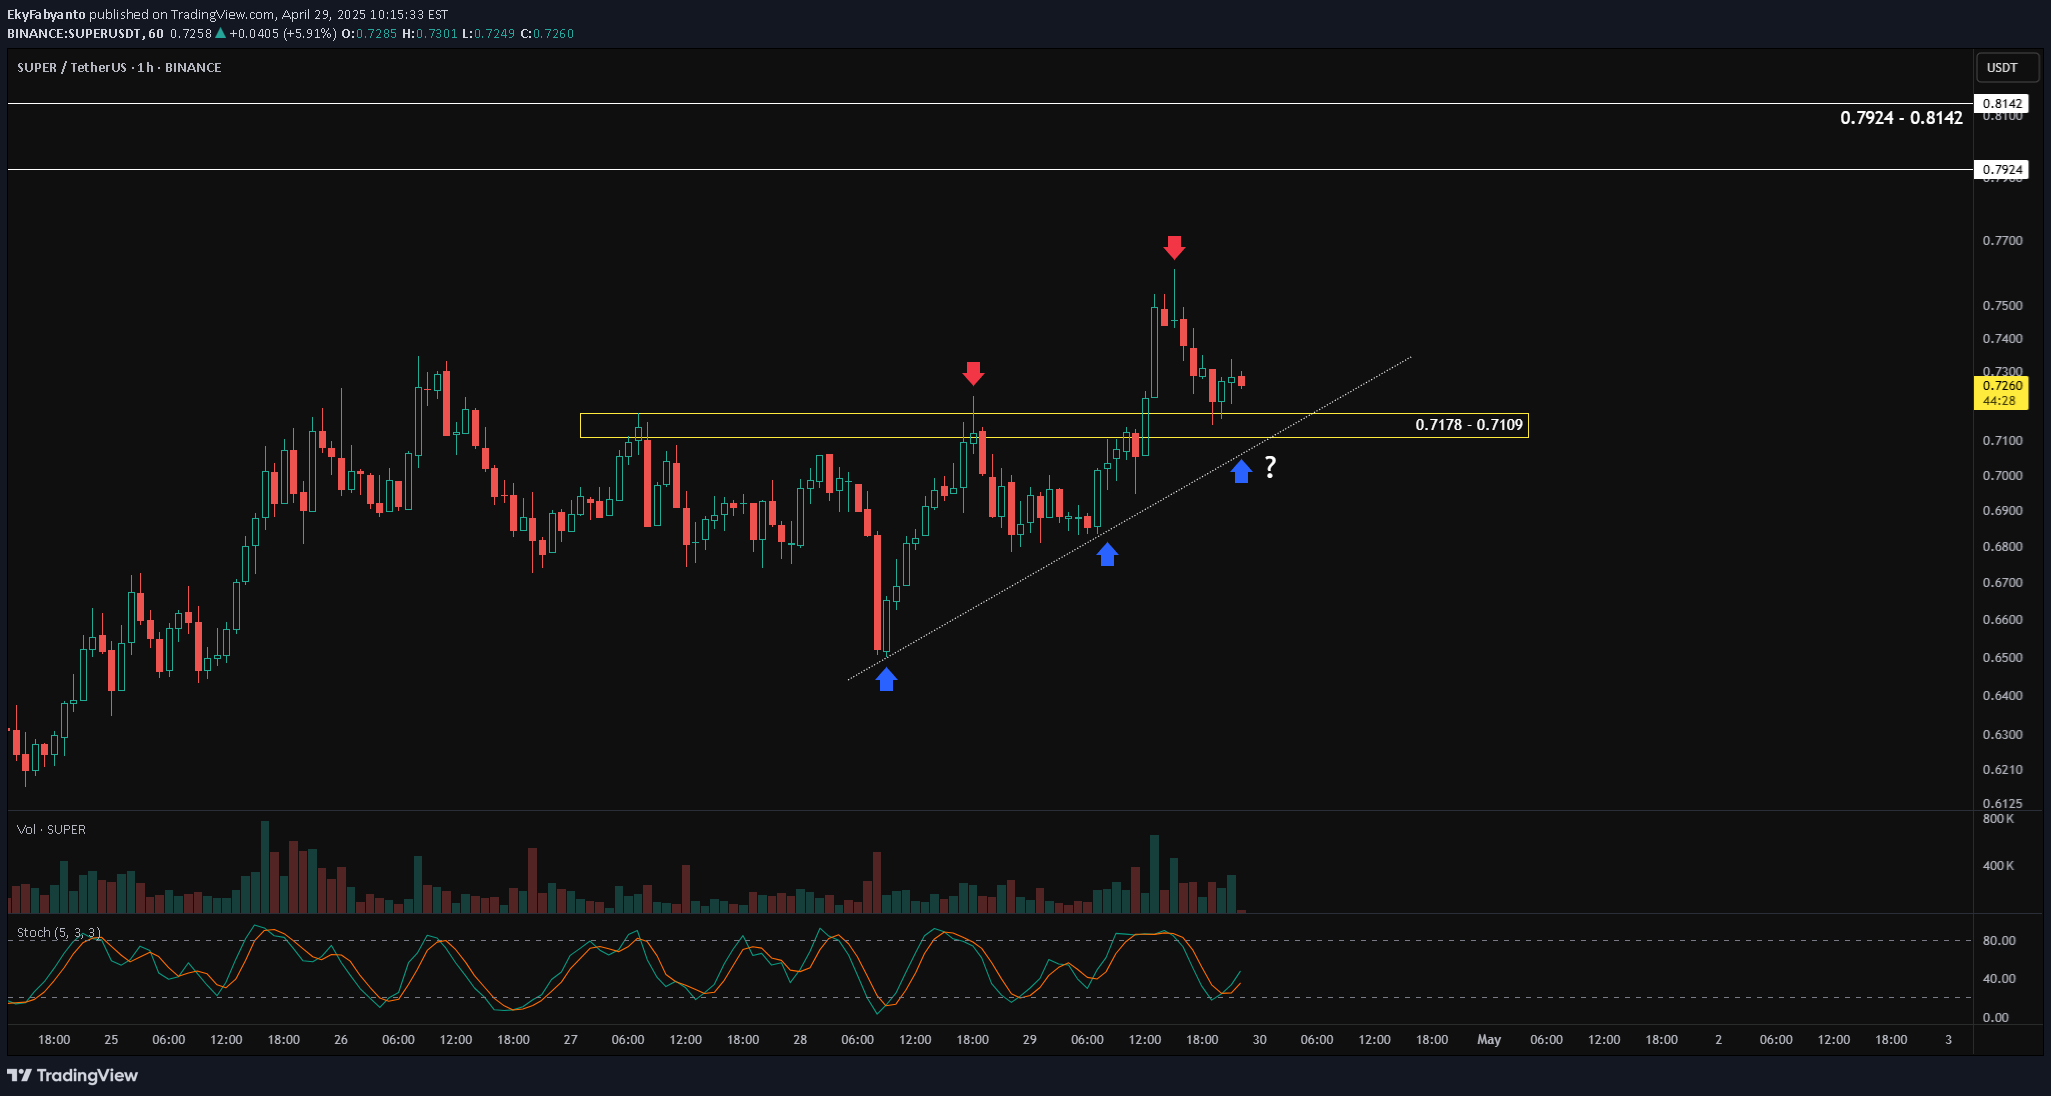
The best time to enter in a bull market is during a pullback — when price temporarily retraces before continuing its upward trend. In the case of SUPERUSDT , price is currently pulling back into a demand zone between 0.7178 – 0.7109. The overall structure remains bullish, with the blue arrows showing a series of higher lows and the red arrows indicating higher highs. We expect the price to bounce from this demand zone and potentially break the previous high, continuing the bullish trend. To confirm the pullback is ending and a reversal is underway, we’ll watch for candlestick patterns. Here are two possible bullish confirmation scenarios: Price breaks and closes above the high of the last red candle — a bullish engulfing setup. Price dips deeper into the demand zone, then forms a bullish pattern such as: Bullish Engulfing Bullish Harami Other reversal signals, like a close above the high of the previous two candles. These are the scenarios I’m watching for on $SUPERUSDT. Let me know your thoughts!
EkyFabyanto
Price Takes a Breath Before the Next Run

HBARUSDT has been moving in a smooth uptrend, followed by a brief consolidation — forming a classic bullish pennant pattern. This indicates a temporary pause before a potential continuation toward the main target zone at 0.21182 – 0.21855. A breakout above 0.19195 confirms the validity of the pennant pattern, especially after the price successfully held above the demand zone at 0.18907 – 0.18633. The next key level to watch is the prior high of the pennant (highlighted with a red arrow). For a solid bullish continuation, ensure the breakout is clean — no fakeouts or re-entries back into the pennant. If a false breakout occurs, it's wise to either trim your position or set a break-even stop to protect your capital. Note: Manage risk with proper stop loss just below the demand zone.
EkyFabyanto
Bullish Pennant in ARDR: A Pause Before Another Rally

After an aggressive surge marked by a big green candle, ARDRUSDT is now moving sideways. This sideways action represents a "voting phase" between buyers and sellers — a battle to decide who will take control next. Looking at the current price structure, this consolidation is setting up a potential continuation move toward the next target zone at 0.15199 – 0.15900. Technically, the sideways movement is forming a bullish pennant pattern — a classic sign where price briefly pauses after a strong rally, gathering momentum before continuing its upward trend. One thing to watch: after breaking the previous high (marked by the red arrow), price should not fall back into the pennant structure. A re-entry would weaken the bullish setup. As long as price holds above the key support at 0.12273, the bullish scenario remains intact. What's your view on this setup?
EkyFabyanto
Two Bullish Scenarios to Watch on ETHUSDT

This week, ETHUSDT has shown a significant upward movement, and there's a good chance it could continue its bullish momentum. There are two bullish scenarios developing on ETHUSDT : 1. After a pullback, we could see an impulsive move that breaks the previous high (marked with the red arrow) and pushes the price towards the first target at 1,911 – 1,957. 2. The price could move sideways for a while, forming a bullish pennant pattern. In this case, a correction towards 1,756 – 1,731 might occur before the price resumes its move to the first target at 1,911 – 1,957. Both scenarios remain valid as long as the price holds above 1,722. If the second scenario plays out, the pullback to 1,756 – 1,731 can be considered a good buy zone (for those who are not in position yet). Remember: wait for a confirmation candle before entering and place your stop-loss just below the confirmation candle.There's not enough momentum for the price to break the previous high, which has led to the formation of a potential double top pattern. Be cautious of a breakdown below the invalidation level, also known as the neckline of the double top.
EkyFabyanto
Crypto Bulls Awaken – Is This Just the Beginning?

In the past 48 hours, the crypto market has brought joy to traders and investors who managed to buy near the bottom. (Sorry to the cryptobros still holding floating losses—your time will come too! 😊) Some of you might be thinking it's too late to ride this bull run. But if you zoom out and look at the bigger picture, there's still plenty of room for the bull to run. Just switch to a higher timeframe like the weekly or monthly chart, and you'll see the potential upside. One coin that looks particularly interesting is SUIUSDT . There's been a pullback from 2.1829 - 1.7997, and it's supported by bullish divergence, suggesting a continuation of the impulsive move with 7.6108 as the first major target. This bullish scenario remains valid as long as the price holds above 1.7174. You might be wondering, " So can I just buy/long SUIUSDT now? " Not yet. For a better entry and a more favorable risk-reward ratio, I suggest using the daily chart. Wait for a pullback, then look for confirmation using candlestick patterns. (I'll cover those patterns in my next post—stay tuned!)
EkyFabyanto
Bullish Triangle Pattern on Progress

In my previous update on CRVUSDT , I mentioned three potential scenarios: a bullish triangle formation, sideways movement, and a double top pattern. Right now, it looks like the bullish triangle pattern is playing out. If this continues, I expect the price to reach the 0.7853 – 0.8343 target zone. But before that, all eyes are on the key resistance at 0.6667 — the prior high. The best-case scenario would be a strong breakout above 0.6667, ideally with a solid bullish candle showing strong buyer momentum. However, stay cautious. If price breaks the resistance but quickly falls back into the triangle and breaks the low of the breakout candle, that could be a false breakout (or what some might call a liquidation sweep). In that case, reducing exposure could be a wise move, as price might enter a sideways phase. On the other hand, if price gets rejected (before breakout) at 0.6667 with a large red candle, that’s still acceptable — as long as price holds above the invalidation level at 0.5781. Let’s keep watching how price reacts around key levels. Market structure still favors the bulls, but risk management is key.
Disclaimer
Any content and materials included in Sahmeto's website and official communication channels are a compilation of personal opinions and analyses and are not binding. They do not constitute any recommendation for buying, selling, entering or exiting the stock market and cryptocurrency market. Also, all news and analyses included in the website and channels are merely republished information from official and unofficial domestic and foreign sources, and it is obvious that users of the said content are responsible for following up and ensuring the authenticity and accuracy of the materials. Therefore, while disclaiming responsibility, it is declared that the responsibility for any decision-making, action, and potential profit and loss in the capital market and cryptocurrency market lies with the trader.