
AR
Arweave
| تریدر | نوع سیگنال | حد سود/ضرر | زمان انتشار | مشاهده پیام |
|---|---|---|---|---|
 Trades_for_TradersRank: 4764 | خرید | حد سود: تعیین نشده حد ضرر: تعیین نشده | 12/22/2025 |
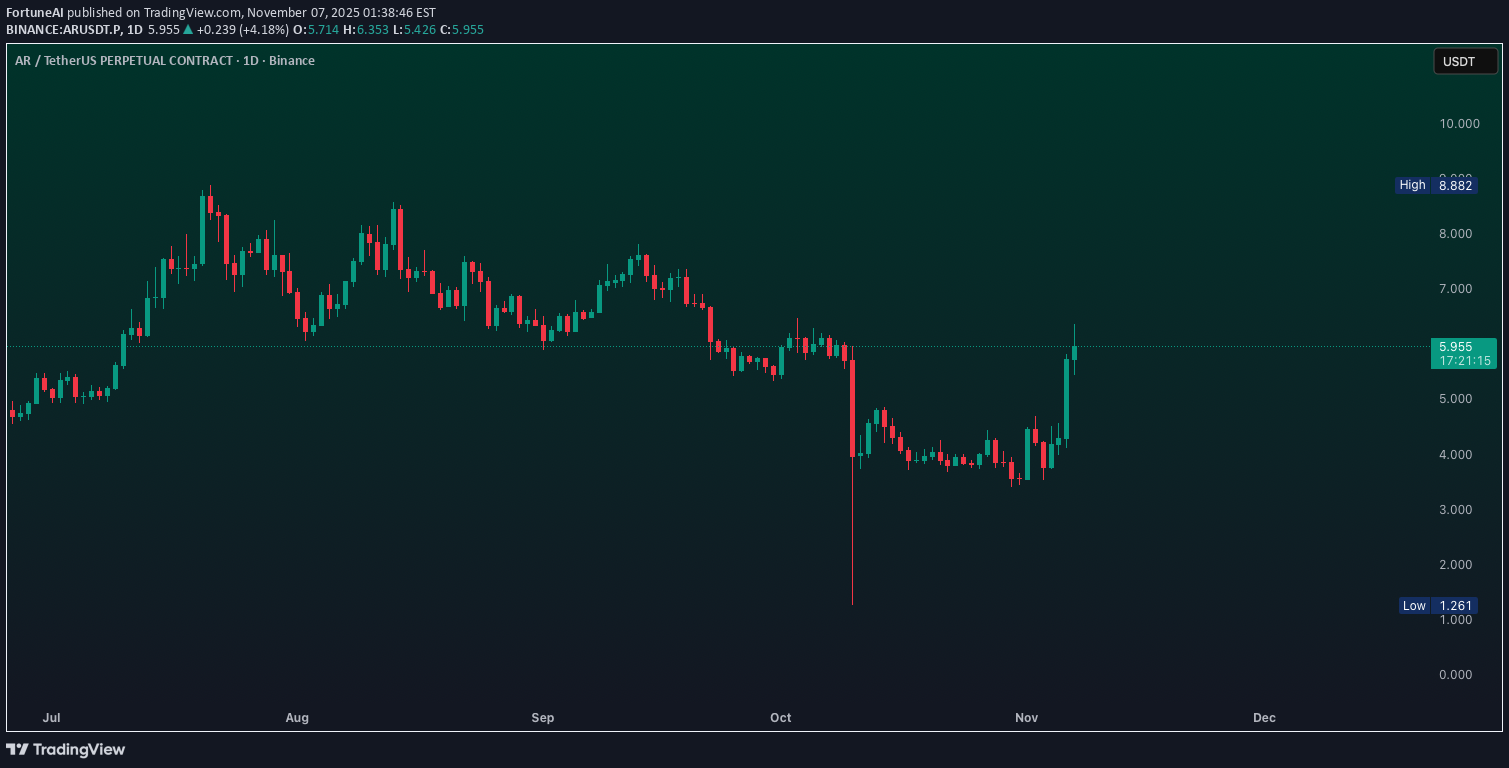
Price Chart of Arweave
سود 3 Months :
سیگنالهای Arweave
Filter
Sort messages by
Trader Type
Time Frame
Trades_for_Traders
POT AR LONG 22.12.2025
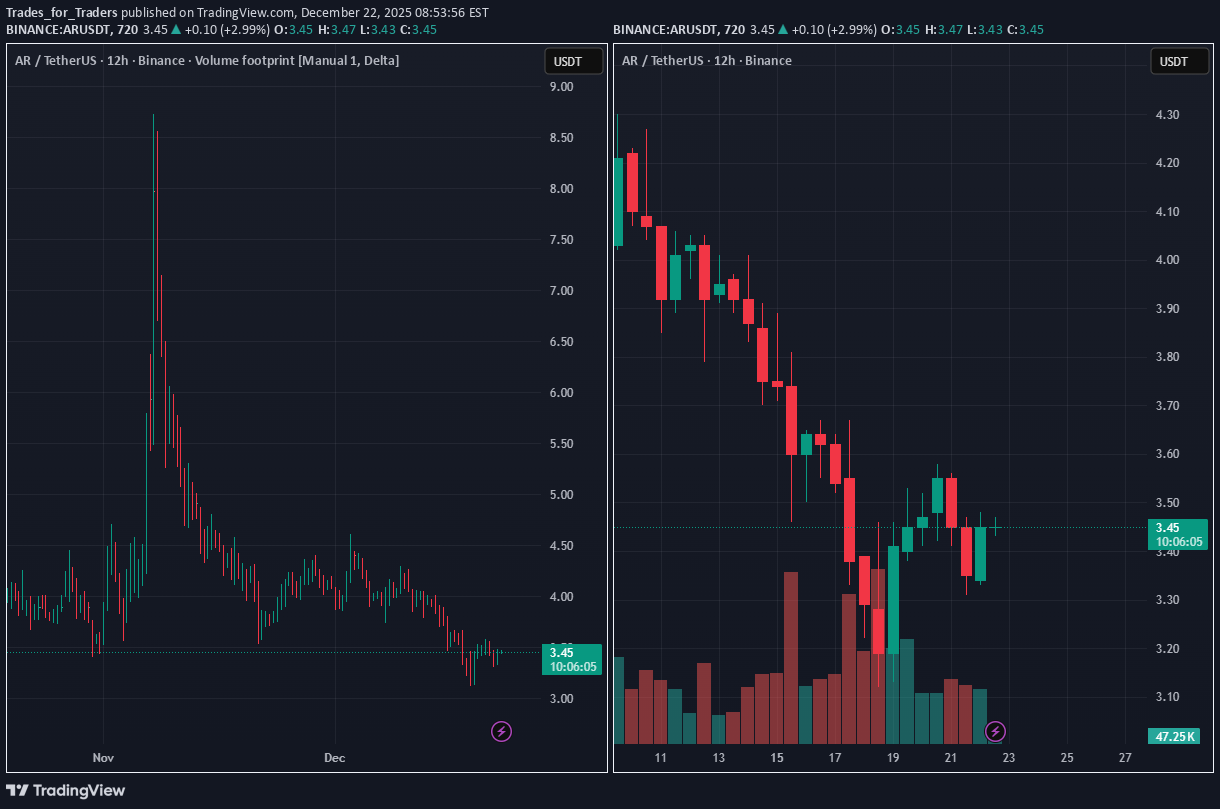
Pinning after abnormal activity. 💰I enter at the market price. I'll let you know when I record it manually. ‼️Risk per trade: 1% of the allocated funds for spot trading.
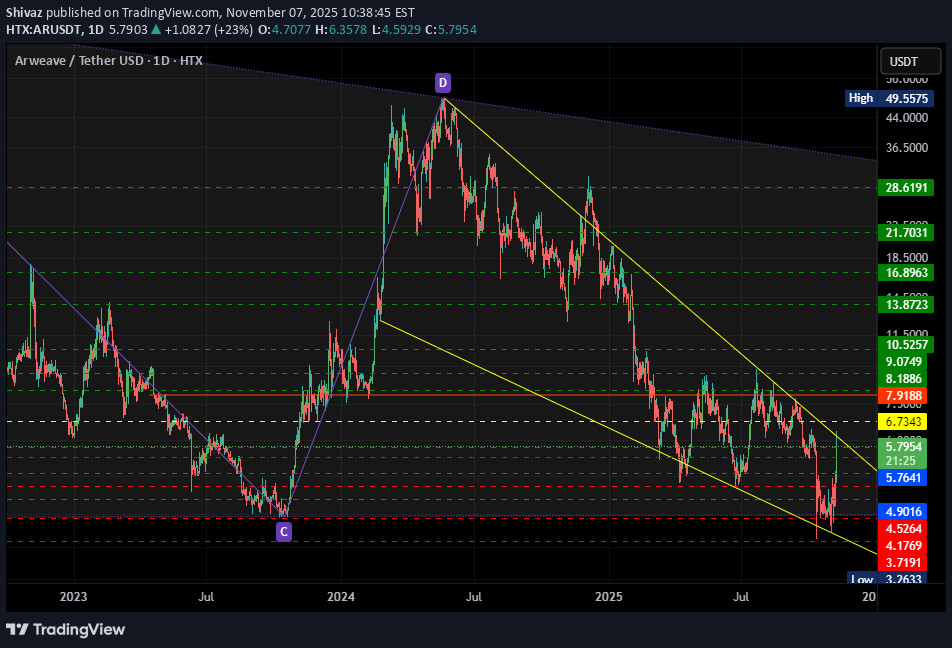
تحلیل موجی ARUSDT: آیا موج C تمام شده؟ (نکات کلیدی و سطح نگهداری قیمت)
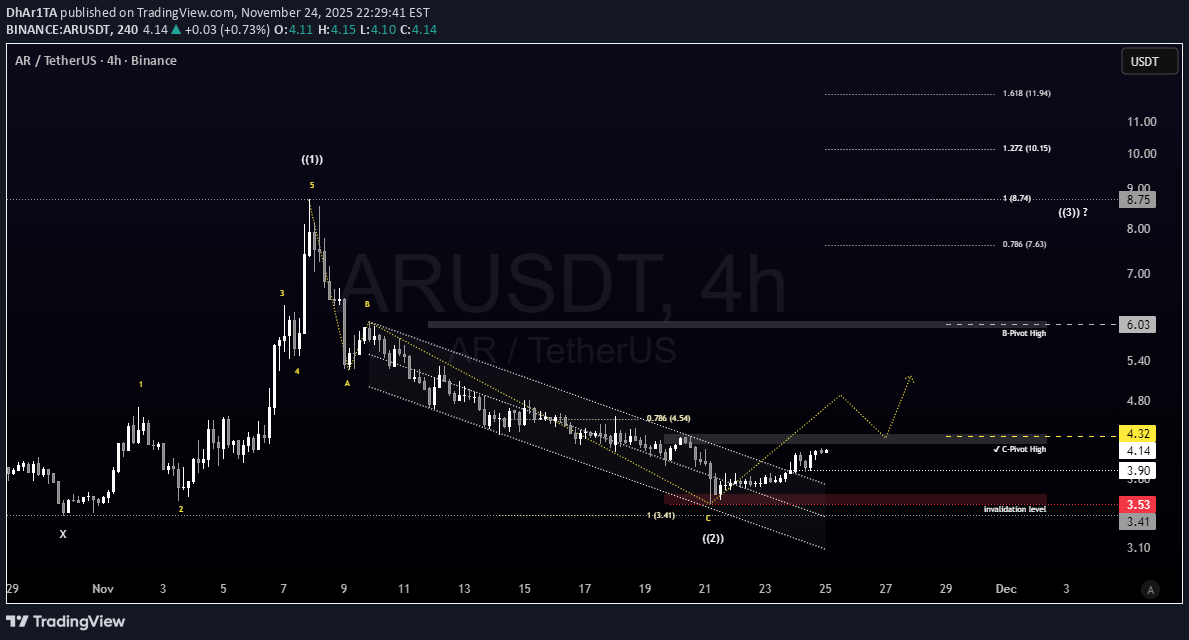
ARUSDT Price is still inside an A-B-C correction. Wave C isn’t confirmed finished yet, but momentum is slowing and price reacted well from the channel low. A break above the C-pivot high would be the first signal of a possible Wave 1 of (3). The setup stays valid as long as price holds above 3.53. - This is not financial advice.

Moneyisjustanumber
آرویو، چرا برای ۵۰۰ دلار آماده میشود؟ راز آیندهای که متوقف نخواهد شد!
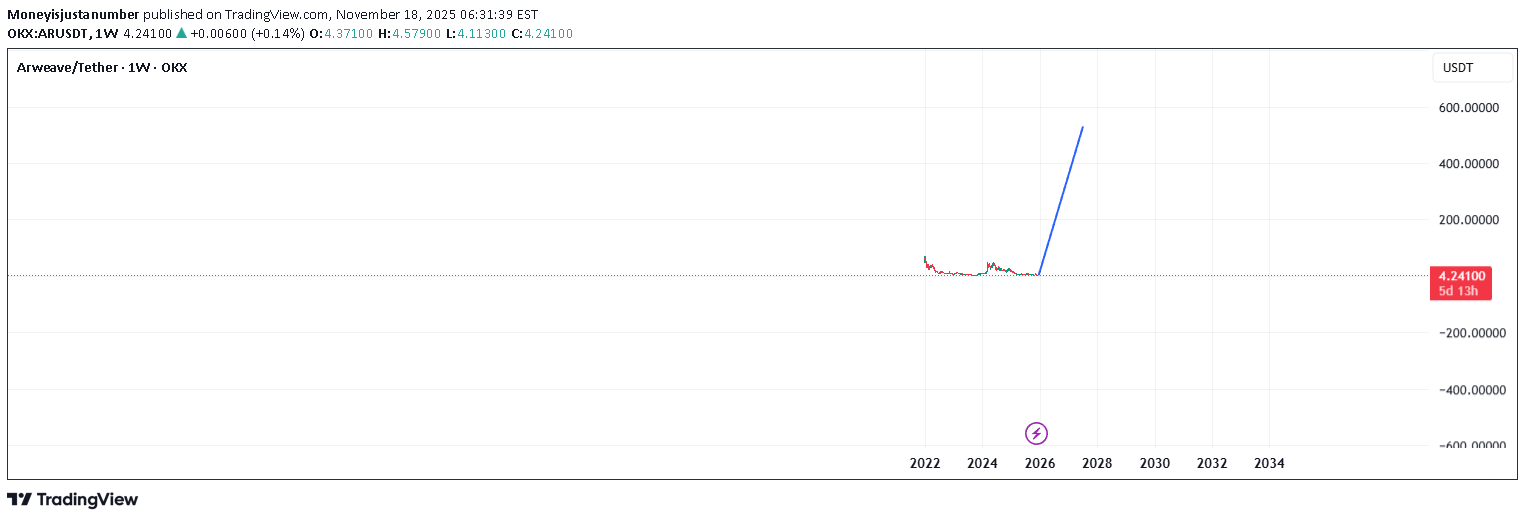
Just buy this bottom range and leave it be. This project is permanently defining the future. Nothing can change the Arweave 500$ happening.

Bayramusta
آرویو (AR): معدن طلای پنهان در دنیای ذخیرهسازی ابری؛ چرا الان وقت خرید است؟
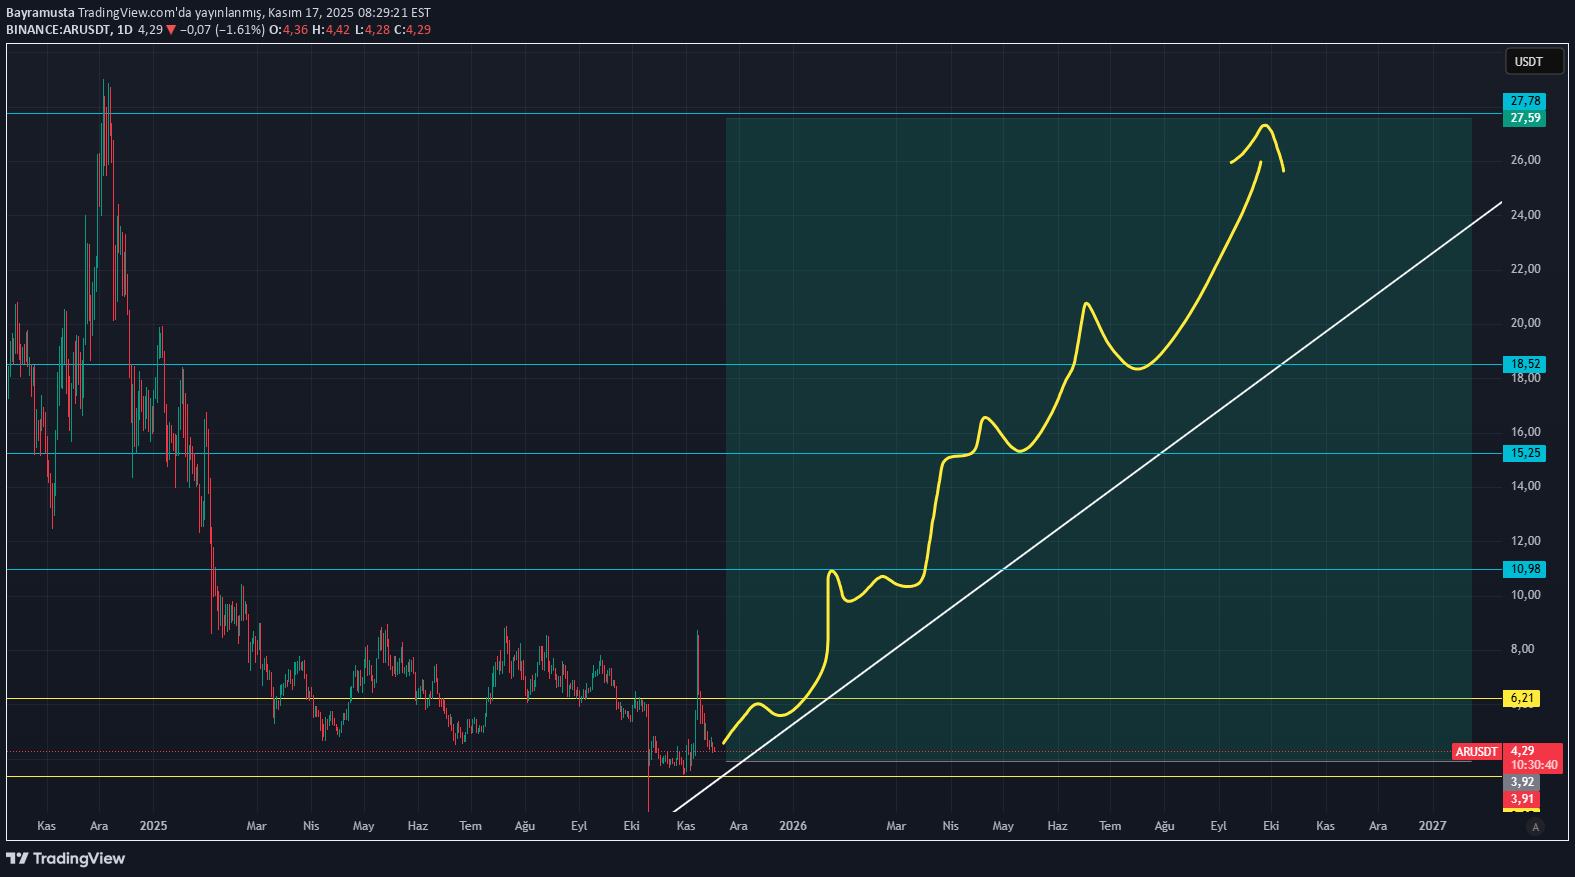
When we look at its competitors, file coin storj ICP SC its price suitability according to the supply increases its appeal, it should take its place in spot baskets.

MyCryptoParadise
نقدینگی پنهان ARUSDT: آیا منتظر انفجار صعودی کوتاهمدت هستیم؟
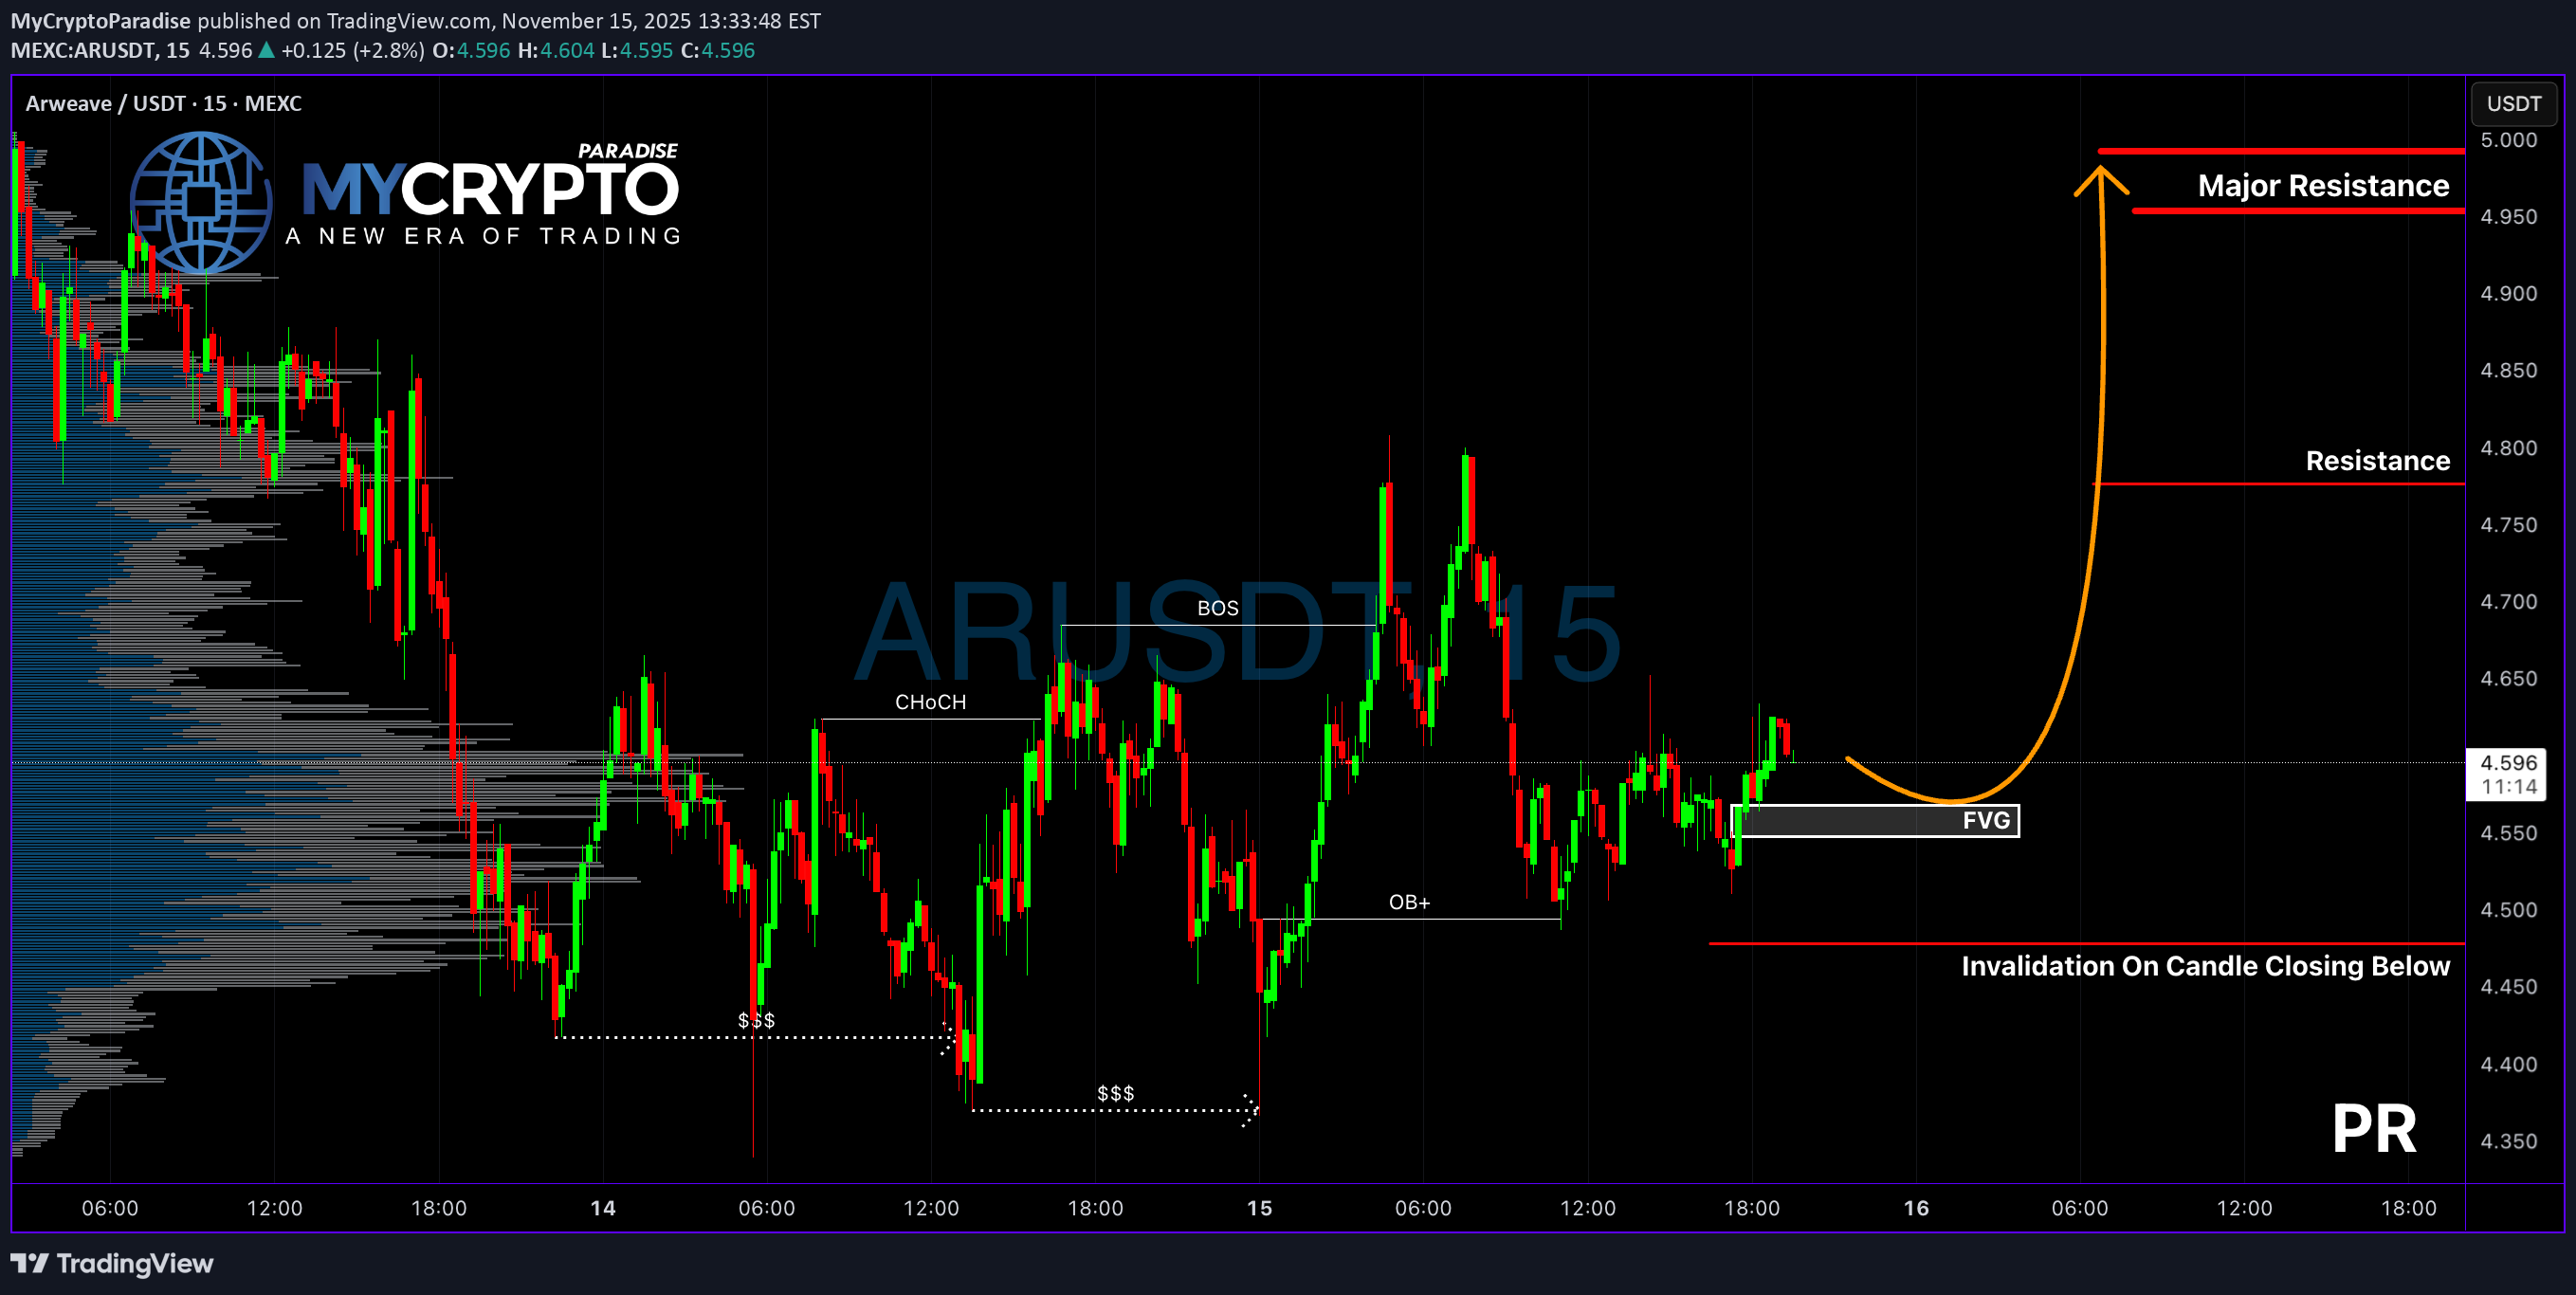
Yello, Paradisers — are you watching ARUSDT closely? Because this setup could develop into one of the cleanest short-term opportunities we’ve seen lately, but only for those who remain patient and calculated. The current structure is showing early signs of a potential bullish shift, and here’s what we’re seeing. 💎ARUSDT has displayed a proper bullish Change of Character (CHoCH) along with a Break of Structure (BOS), both occurring right after a clean sweep of seller-side liquidity. This kind of price action generally signals a potential reversal and significantly increases the probability of a short-term bullish continuation. 💎However, while the bias is clearly tilting bullish, jumping in at current price levels doesn't offer an optimal risk-to-reward setup. Entering now would only give about a 1:1 RR, which isn’t ideal for high-probability trading. The more strategic move would be to wait for a retracement back into the Fair Value Gap (FVG). If price pulls back into that zone and forms a clear bullish candlestick pattern, the probability of a strong move upward increases substantially, and the RR improves in our favor. 💎That said, the setup isn't without its invalidation. If ARUSDT breaks down and we get a candle close below the invalidation level, the entire bullish scenario becomes invalid. In that case, there’s no reason to force a trade. It’s smarter to stay patient and wait for a clearer structure to reappear. 🎖Strive for consistency, not quick profits. Treat the market as a businessman, not as a gambler. There will always be another opportunity, but only if you protect your capital and remain disciplined. Stay focused and let the setup come to you — not the other way around. MyCryptoParadise iFeel the success🌴

vipvault
احتمال بازگشت انفجاری AR/USDT: رسیدن به کف تاریخی و فرصت خرید با ریسک به ریوارد استثنایی!
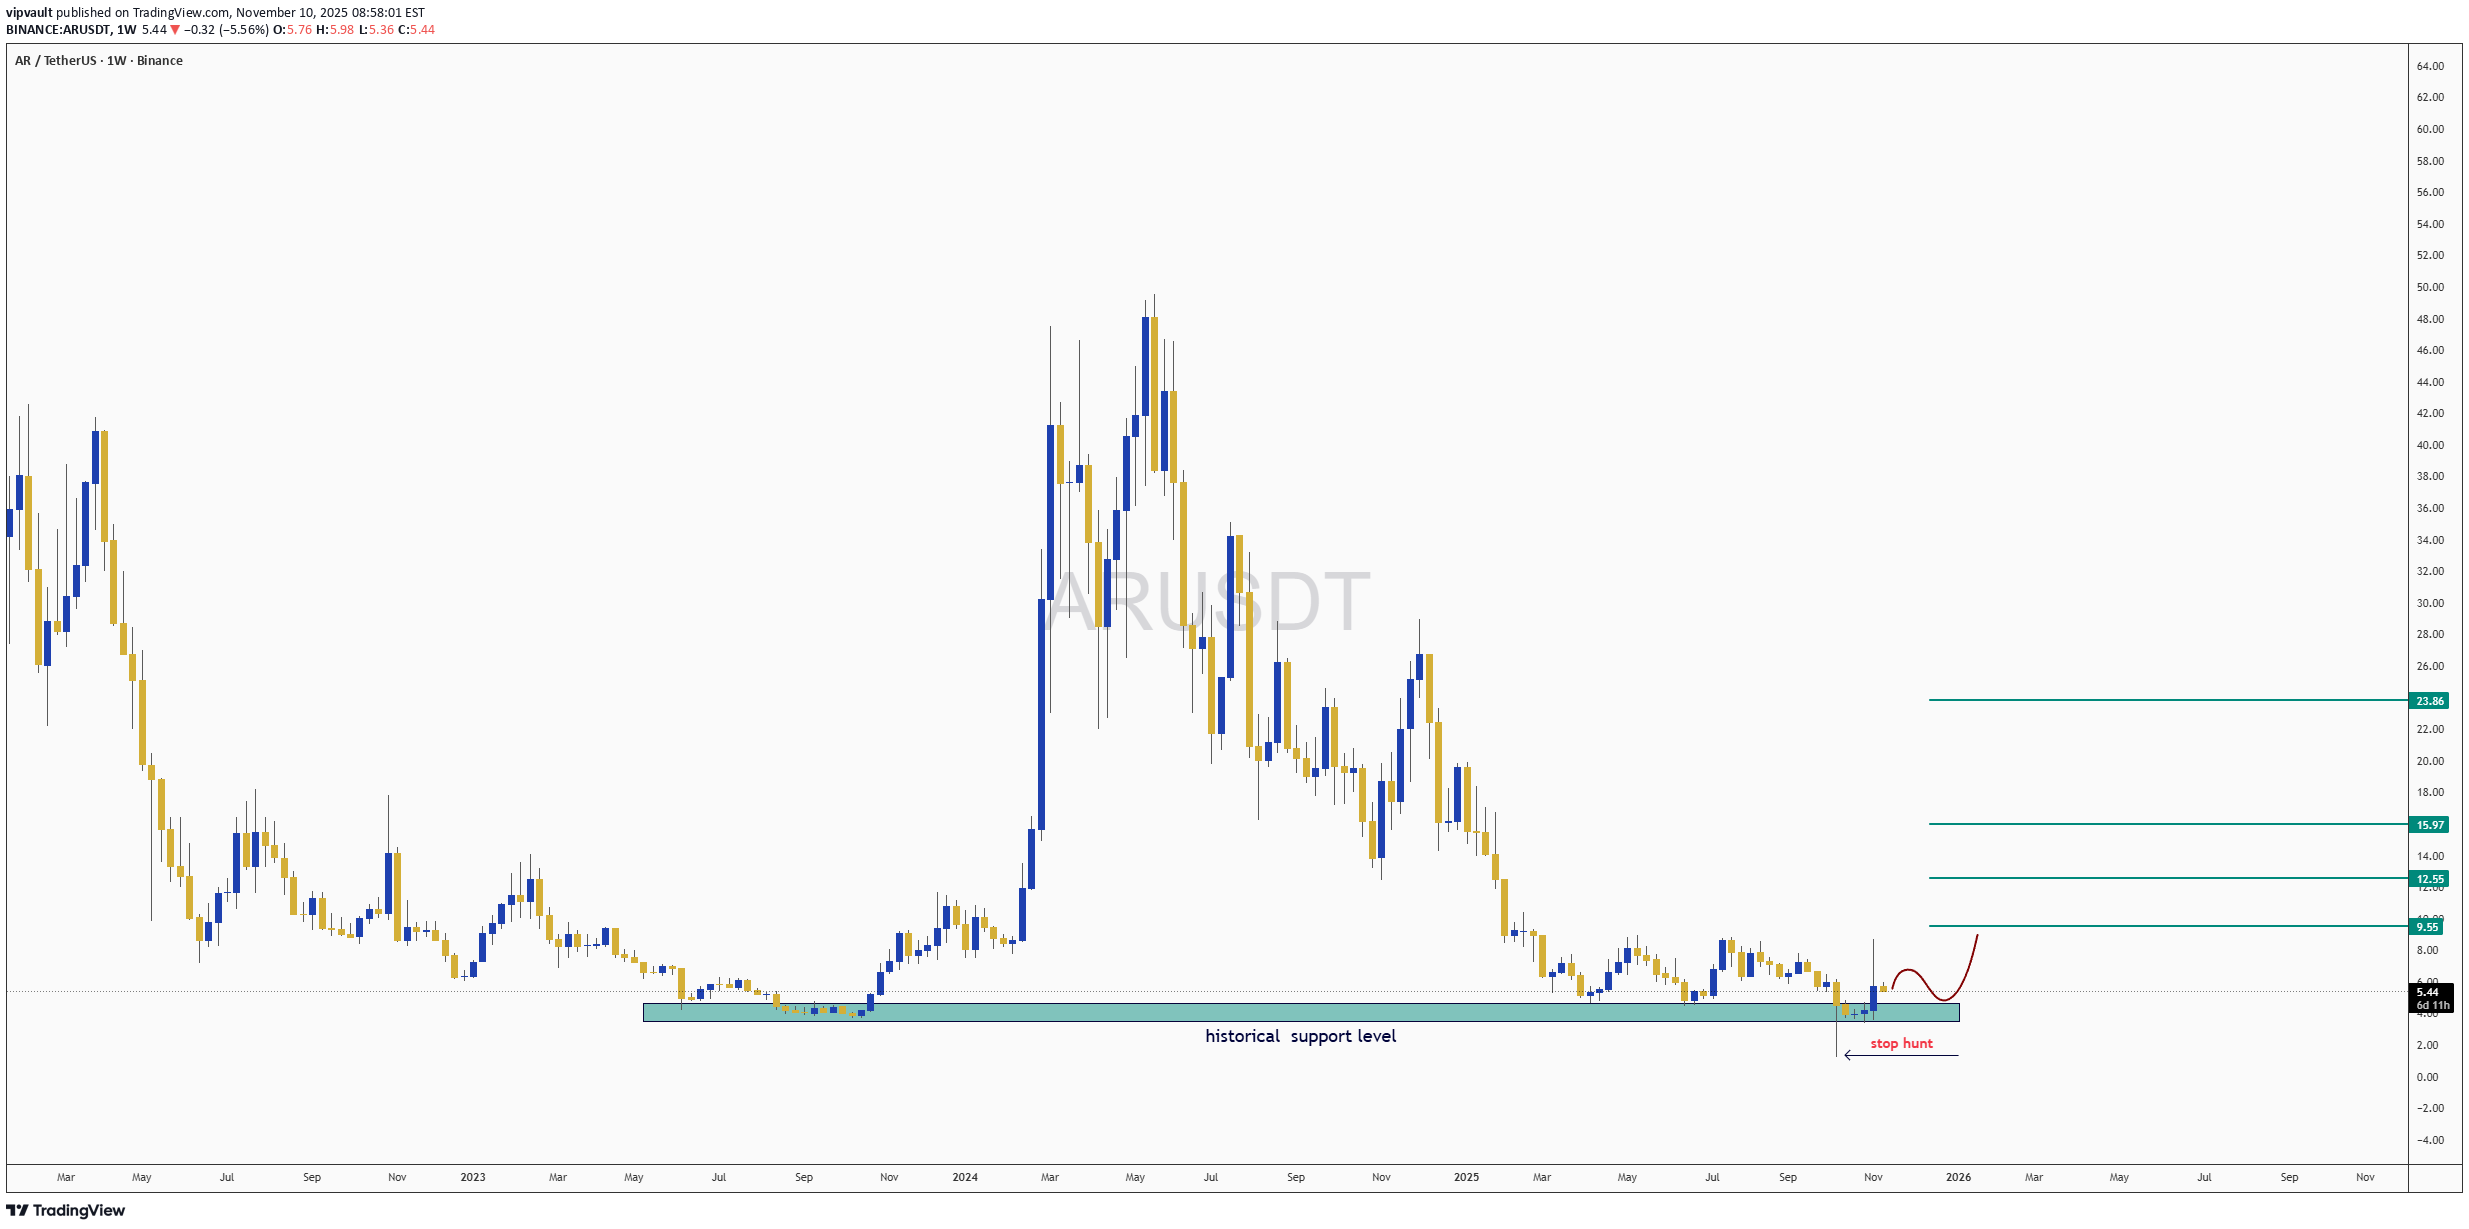
Taking a close look at AR/USDT on the daily timeframe. Price has completed a deep correction following its massive bull run and has now returned to a major historical support level. This area acted as a base for the previous move and is clearly a significant pivot point. We've recently seen a sharp "stop hunt" (as labeled) underneath this support zone, which often precedes a reversal if the level holds. Entry: Look for confirmation of a bounce/holding above the major support level (around $3.00 - $3.50). Stop Loss: A clean daily close significantly below the support zone and the stop hunt low (e.g., below $2.50). Potential Targets: T1: $9.55 T2: $12.55 T3: $16 T4: $23.86 This setup offers a potentially attractive Risk/Reward ratio if the historical support proves strong once again. Trade with caution, always manage your risk, and wait for confirmation! Good Luck! #AR #ARUSDT #Crypto #Support #TechnicalAnalysis

VIPCryptoVault
Price Back at Key Historical Low...High R:R Setup
Taking a close look at AR/USDT on the daily timeframe. Price has completed a deep correction following its massive bull run and has now returned to a major historical support level. This area acted as a base for the previous move and is clearly a significant pivot point. We've recently seen a sharp "stop hunt" (as labeled) underneath this support zone, which often precedes a reversal if the level holds. Entry: Look for confirmation of a bounce/holding above the major support level (around $3.00 - $3.50). Stop Loss: A clean daily close significantly below the support zone and the stop hunt low (e.g., below $2.50). Potential Targets: T1: $9.55 T2: $12.55 T3: $16 T4: $23.86 This setup offers a potentially attractive Risk/Reward ratio if the historical support proves strong once again. Trade with caution, always manage your risk, and wait for confirmation! Good Luck! #AR #ARUSDT #Crypto #Support #TechnicalAnalysis

FX_Professor
آرویو (Arweave): نگین فراموششده وب 3 که اینترنت را برای همیشه ذخیره میکند!
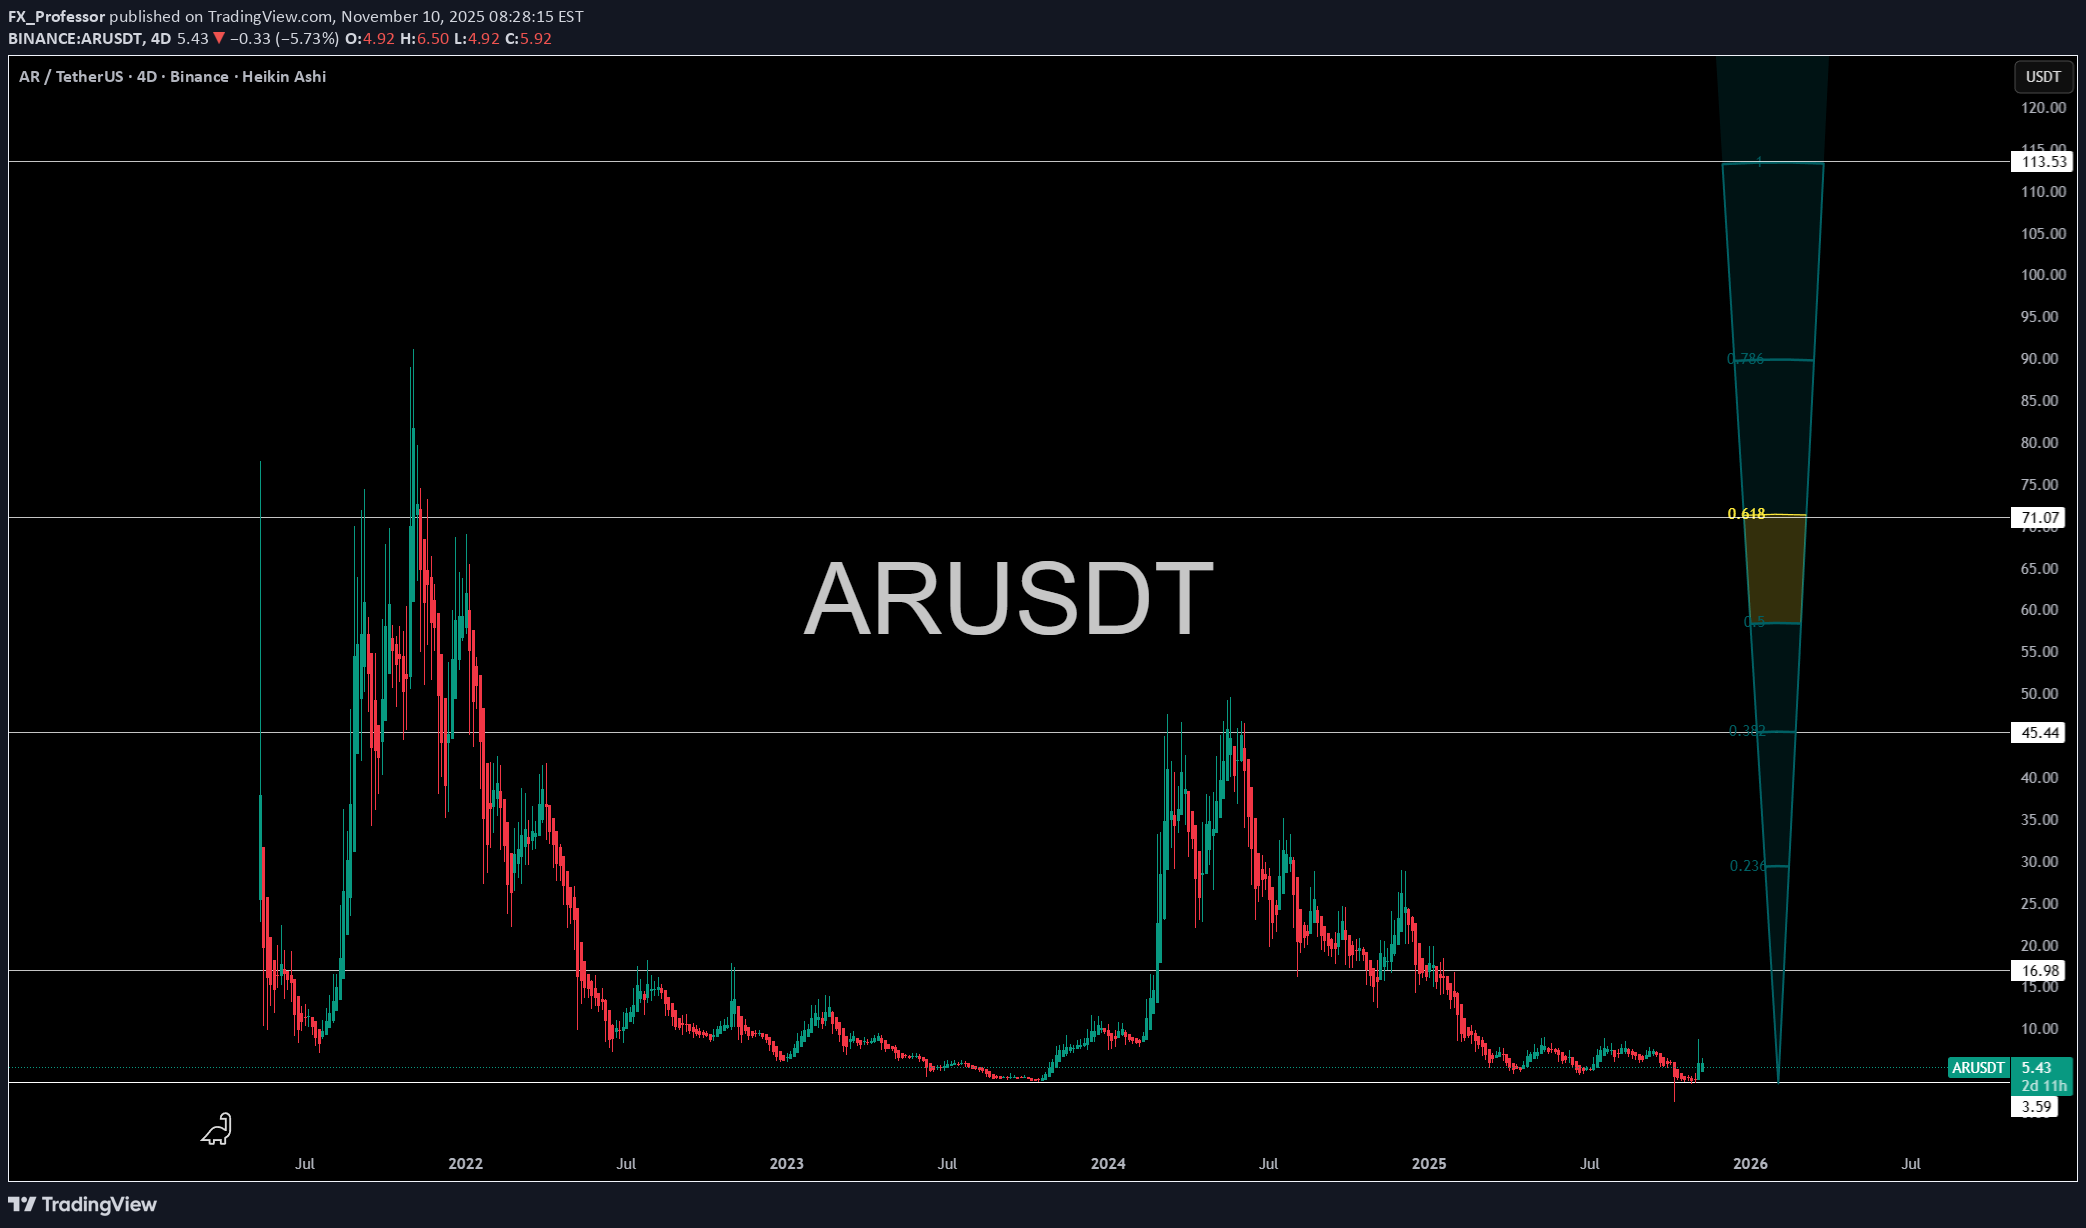
Arweave – The Forgotten Web3 Infrastructure Gem 🌐🧠 ARUSDT just bounced from a brutal multi-year base near $5 — but this isn’t just another altcoin. Arweave powers the permanent web. A decentralized data layer where information lives forever — not 30 days, not 30 years. Forever. It’s Bitcoin for storage, backed by the MIT License (2025) and built for one mission: data immortality . What’s wild? Major chains and dApps already use it to store: NFT metadata On-chain governance archives Front-ends for fully decentralized apps 📊 Chartwise: $5.42 current $16.98 first key resistance $45.44 → $71.07 → $113.53 are the next Fibonacci zones if this cycle fully rotates The rabbit hole is deep. But if the internet ever truly decentralizes, Arweave will be the hard drive it lives on. Perspective Shift 🔄 Most people chase tokens that “do something.” Arweave stores the entire narrative. And in a digital world, storage is everything. Disclaimer: I’m just sharing wisdom, not instructions. No licenses, no guarantees — just years of trading scars and precision chartwork. Be smart, protect your capital, and don’t copy blindly. One Love, The FXPROFESSOR 💙

Shivaz

FortuneAI
Disclaimer
Any content and materials included in Sahmeto's website and official communication channels are a compilation of personal opinions and analyses and are not binding. They do not constitute any recommendation for buying, selling, entering or exiting the stock market and cryptocurrency market. Also, all news and analyses included in the website and channels are merely republished information from official and unofficial domestic and foreign sources, and it is obvious that users of the said content are responsible for following up and ensuring the authenticity and accuracy of the materials. Therefore, while disclaiming responsibility, it is declared that the responsibility for any decision-making, action, and potential profit and loss in the capital market and cryptocurrency market lies with the trader.