
AGLD
Adventure Gold
| تریدر | نوع سیگنال | حد سود/ضرر | زمان انتشار | مشاهده پیام |
|---|---|---|---|---|
No results found. | ||||
Price Chart of Adventure Gold
سود 3 Months :
سیگنالهای Adventure Gold
Filter
Sort messages by
Trader Type
Time Frame

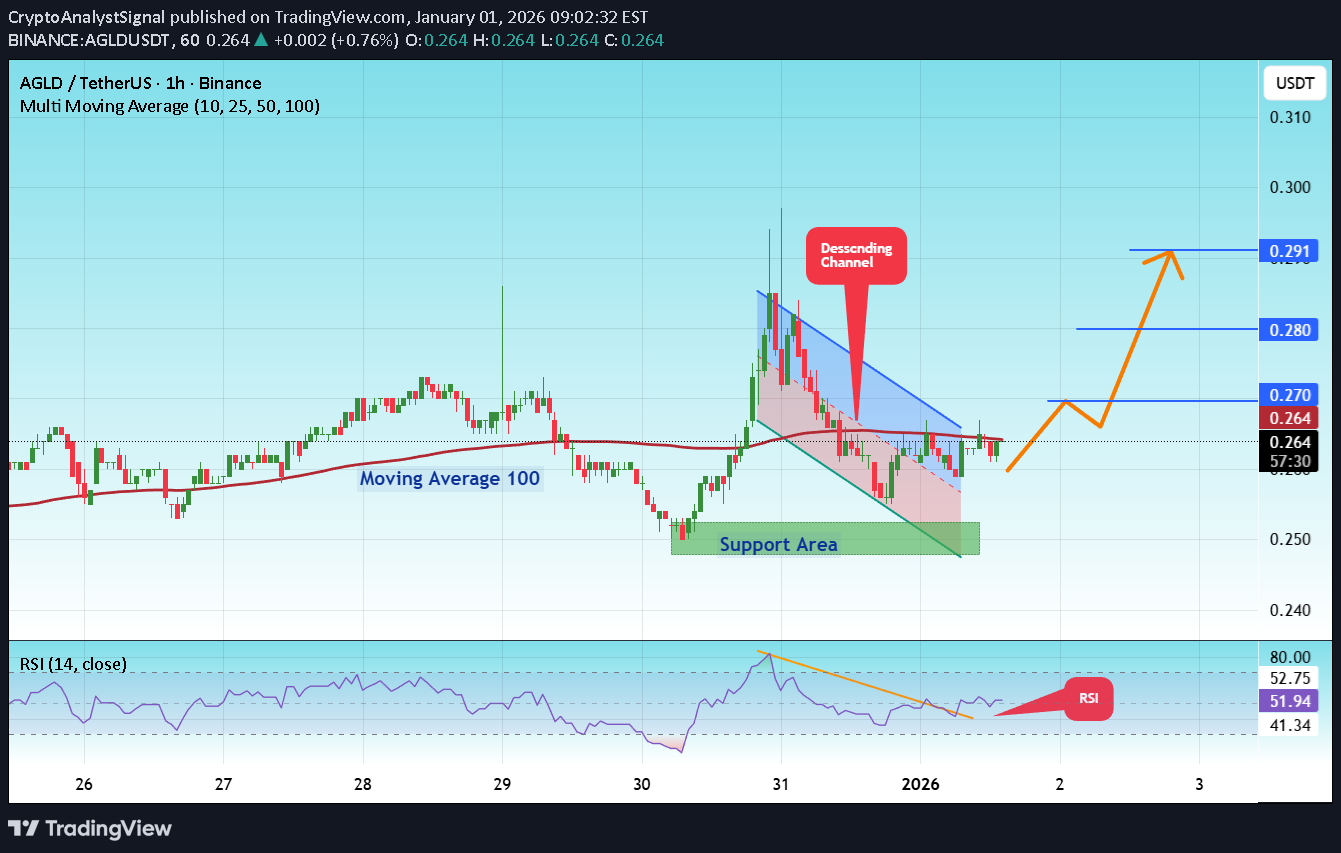
CryptoAnalystSignal
#APT/USDT
#APT The price is moving in a descending channel on the 1-hour timeframe. It has reached the lower boundary and is heading towards a breakout, with a retest of the upper boundary expected. We are seeing a bearish trend in the Relative Strength Index (RSI), which has reached near the lower boundary, and an upward bounce is expected. There is a key support zone in green at 0.250, and the price has bounced from this level several times. Another bounce is expected. We are seeing a trend towards stabilizing above the 100-period moving average, which we are approaching, supporting the upward trend. Entry Price: 0.264 First Target: 0.270 Second Target: 0.280 Third Target: 0.291 Remember a simple principle: Money Management. Place your stop-loss order below the green support zone. For any questions, please leave a comment. Thank you.#APT First Target: 0.270 Reached Second Target: 0.280 Reached

P_S_trade
آیا AGLD آماده جهش بزرگ است؟ تحلیل موج سوم و هدف ۱۲ دلاری!
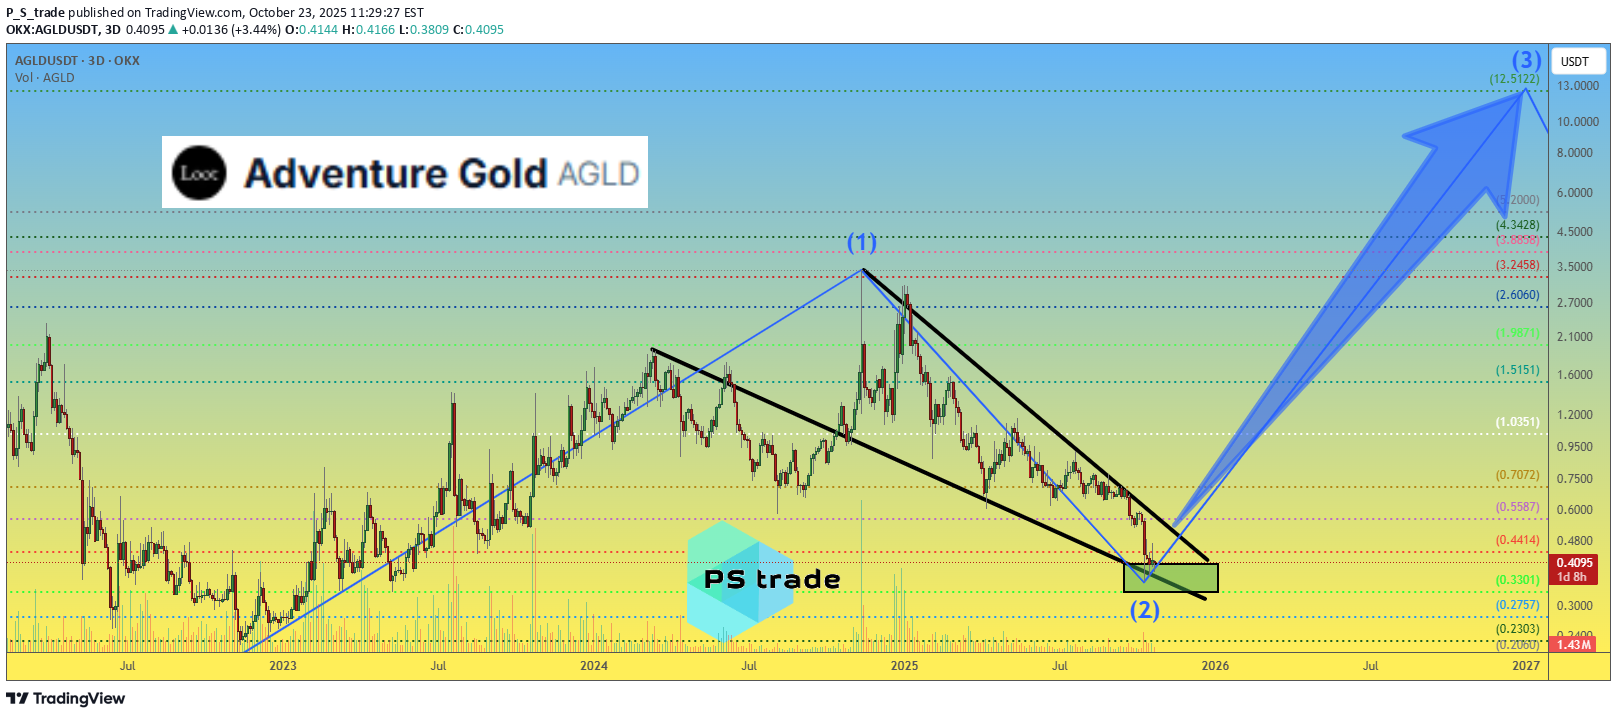
Key observations: During the 10–11 Oct market crash, #AGLD held strong and avoided full capitulation. Wave analysis AGLDUSDT suggests we may be near the end of corrective wave 2, possibly preparing for an impulsive move. With a $35M market cap, nearly full token circulation, and roots in the Ethereum ecosystem, fundamentals look cleaner than most low-cap alts. If the structure holds, next major wave could target the $12 area — but confirmation is still pending. ______________ ◆ Follow us ❤️ for daily crypto insights & updates! 🚀 Don’t miss out on important market moves 🧠 DYOR | This is not financial advice, just thinking out loud.

TakaoKinomiya
AGLD İÇİN SON ZAMANLAR
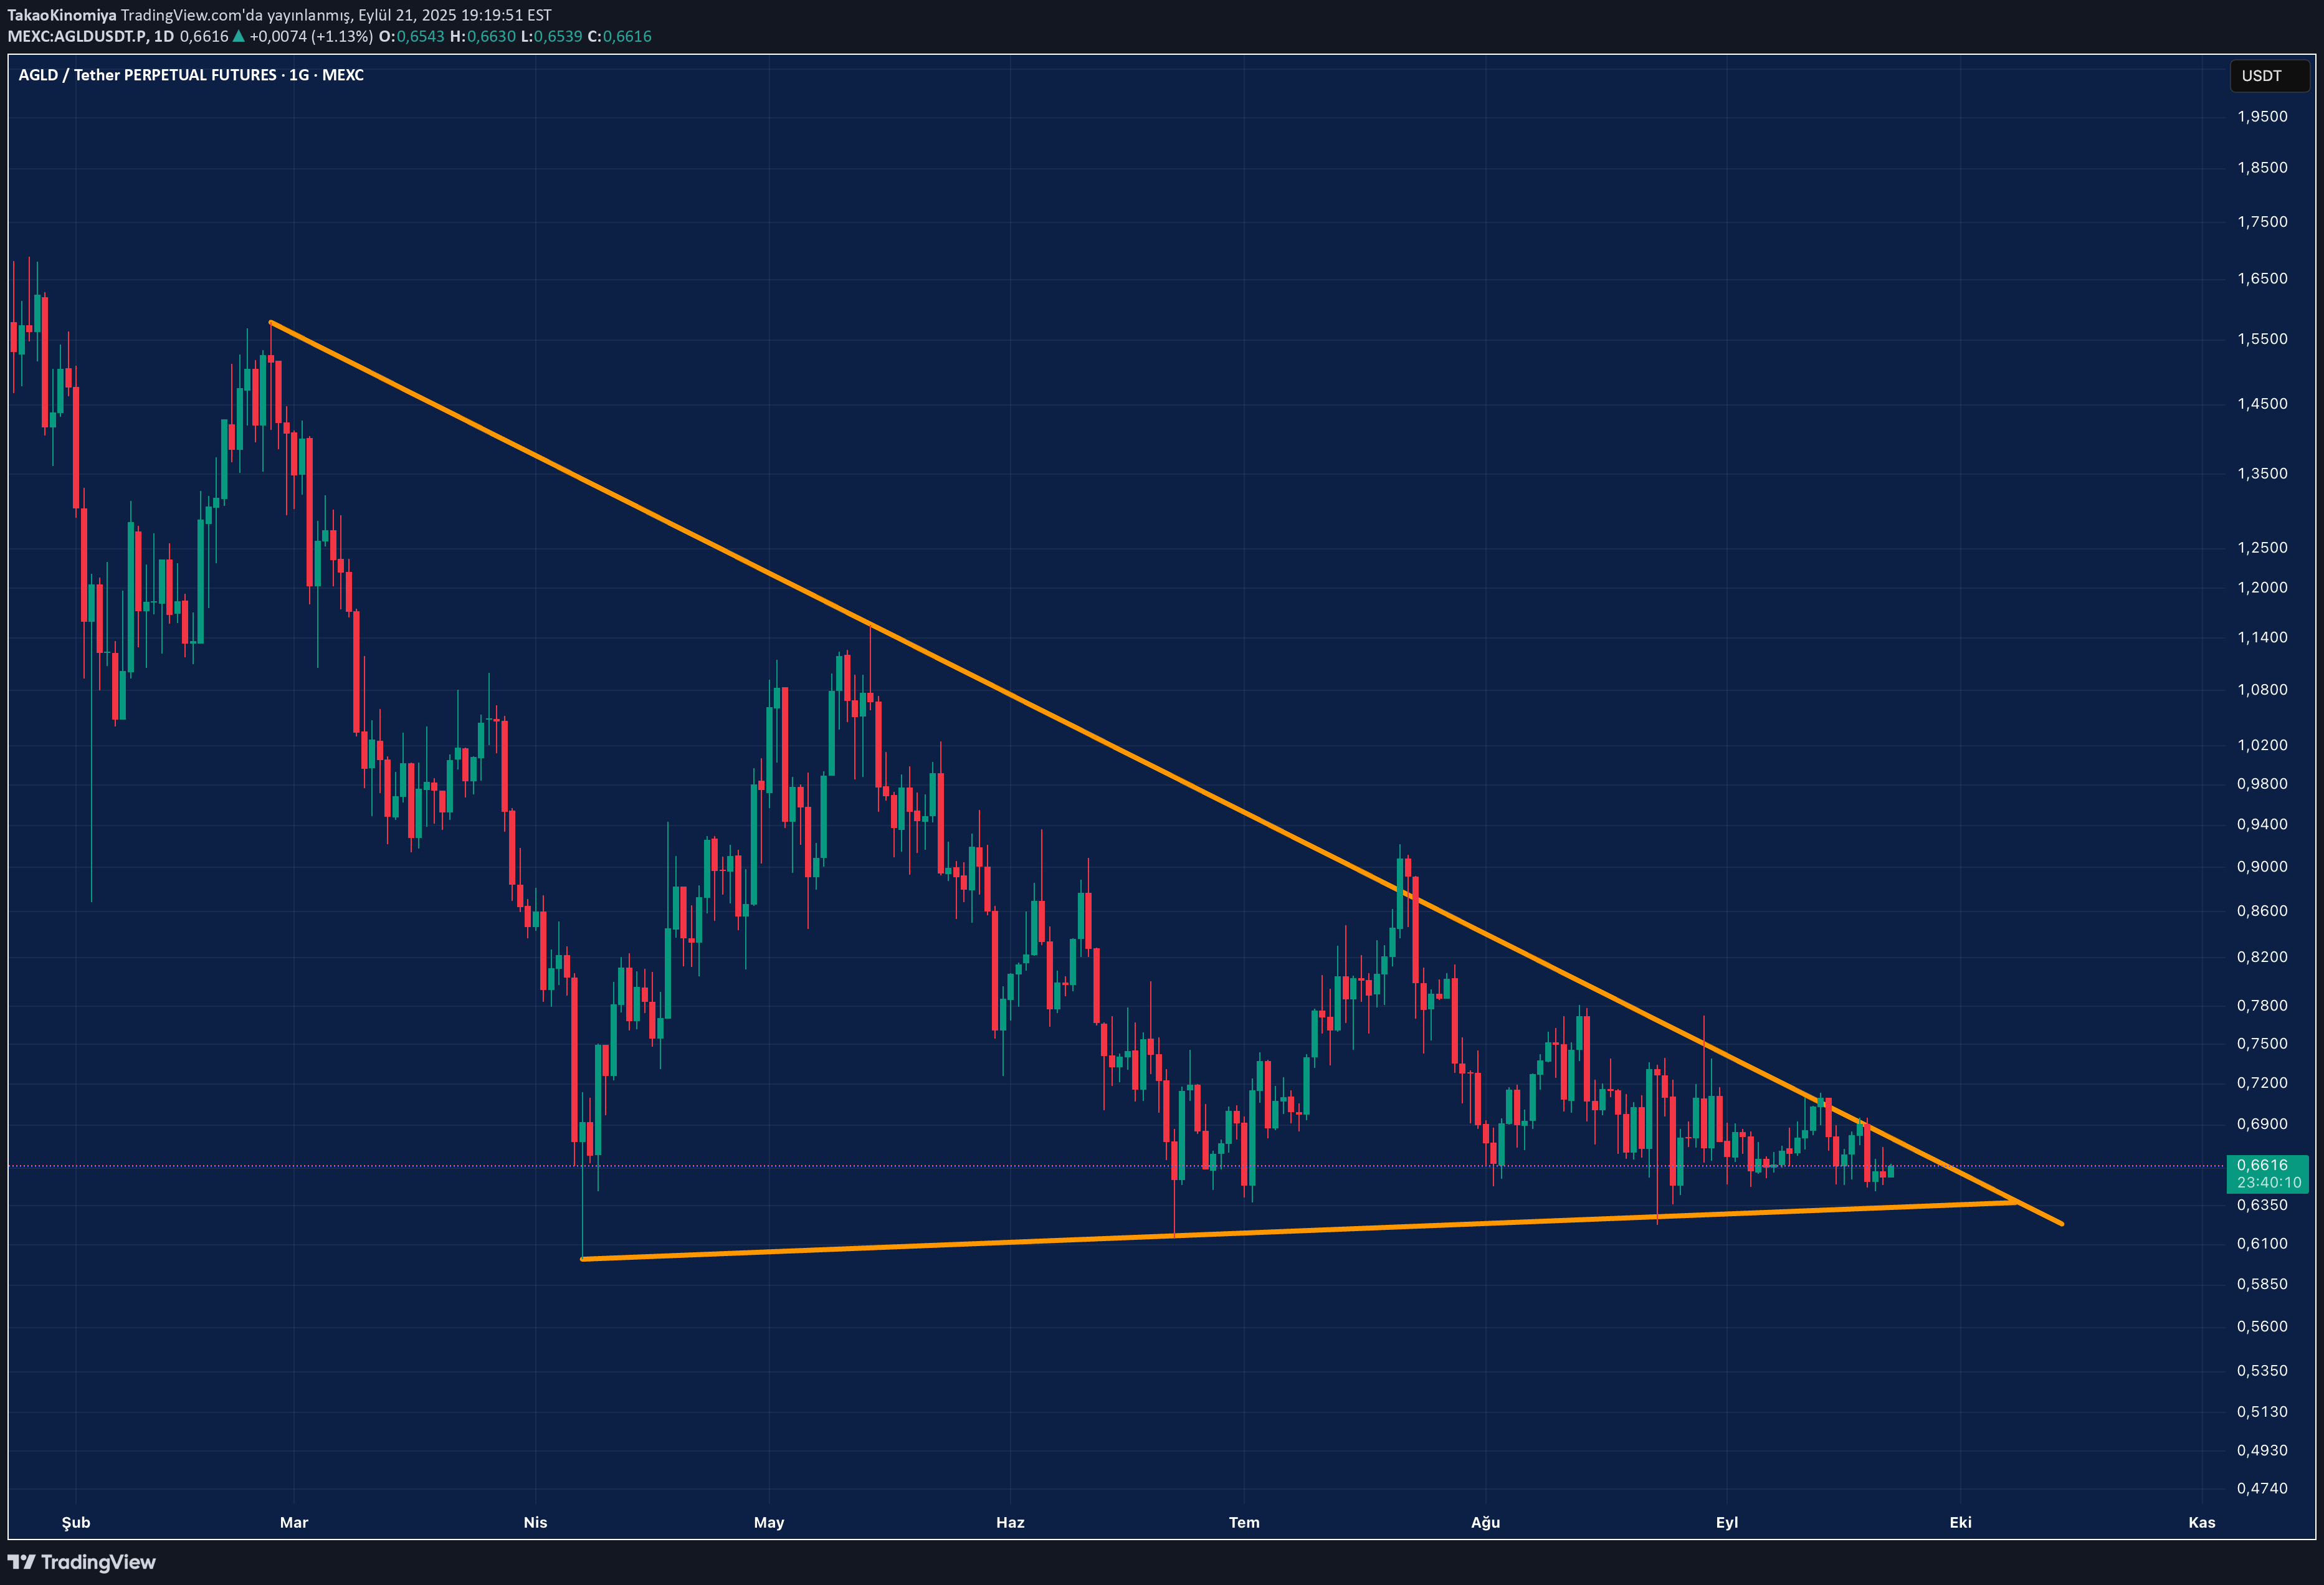
A thoroughly stuck product. Those who have broken down should stop those with the process. It has a good rise in the short term with it breaking up. The remaining big rise will depend on the general situation of the market! Abundant earnings ytd.

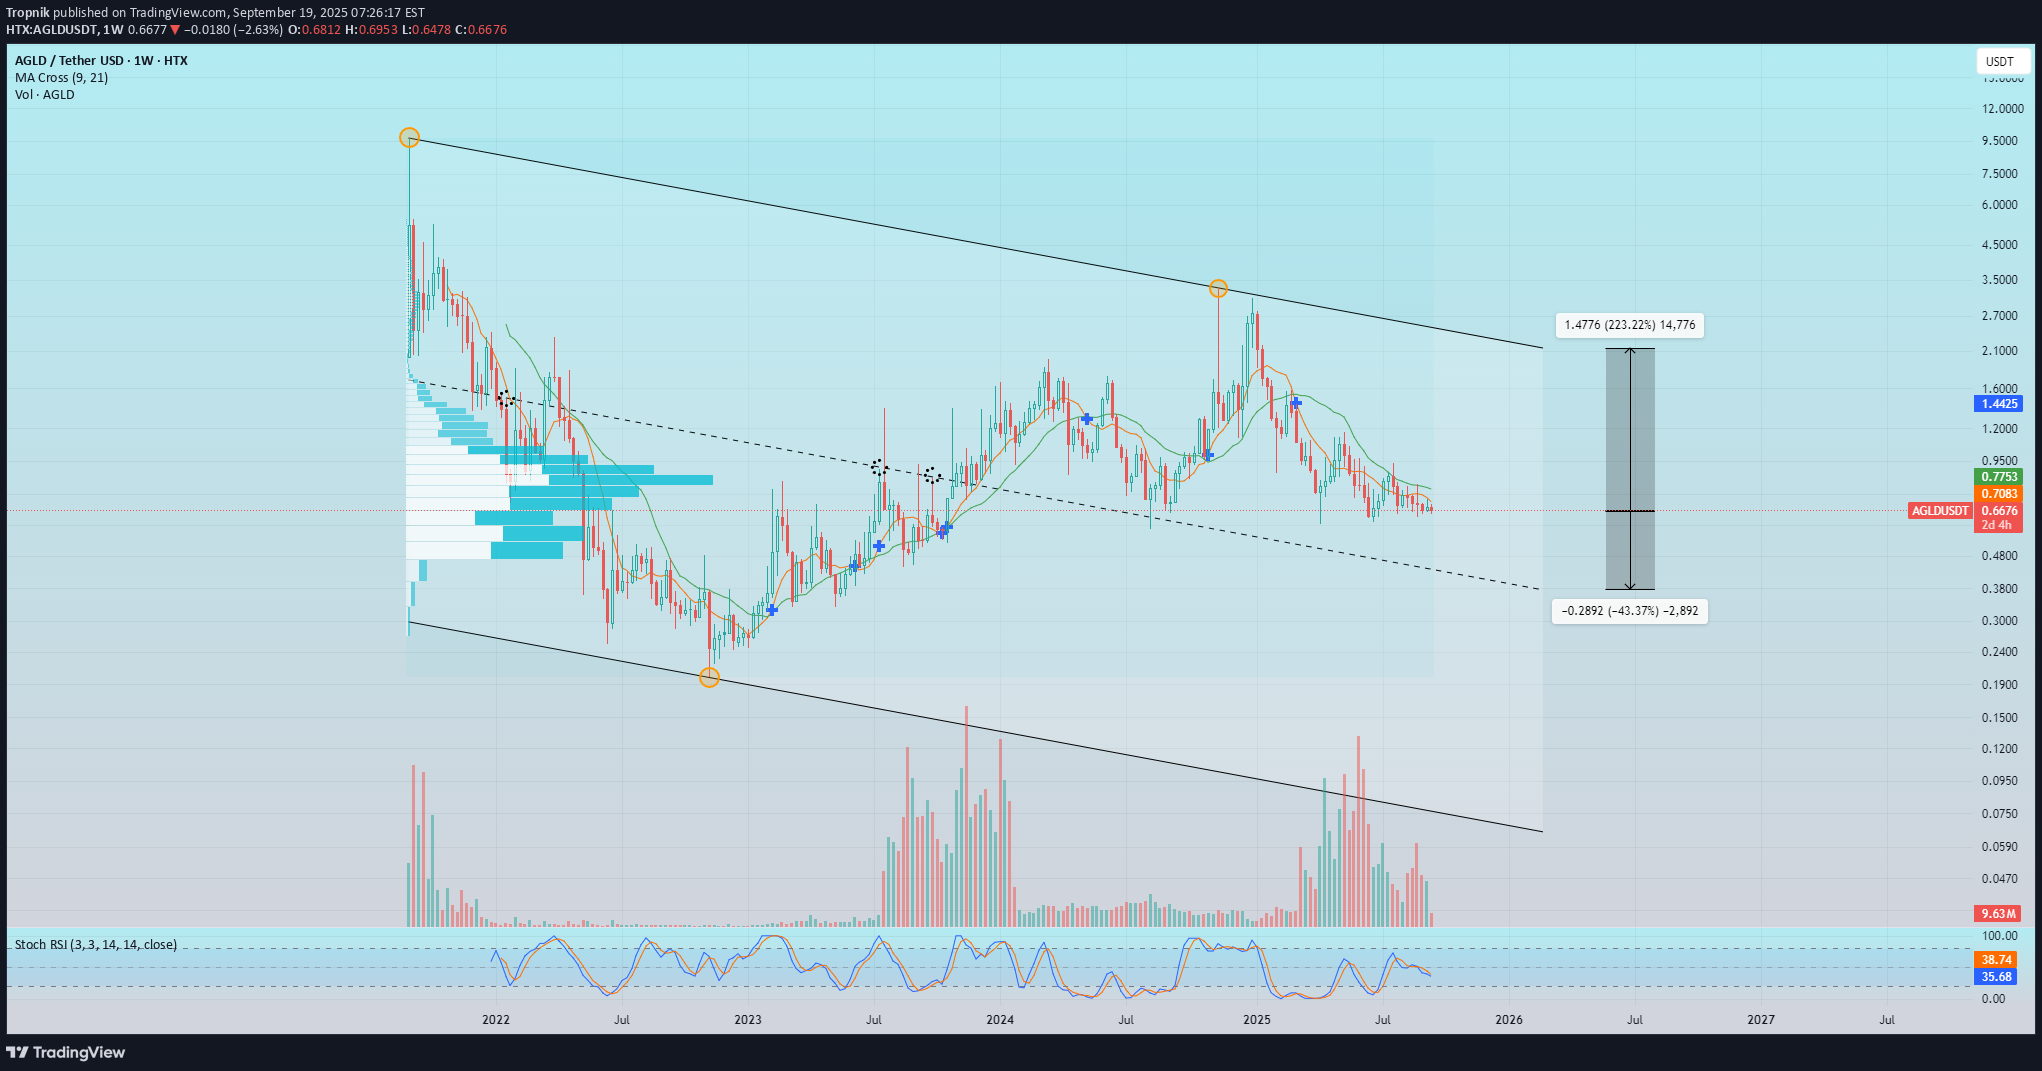
Tropnik
CryptoAnalystSignal
#AGLD/USDT Alert! Imminent Rise
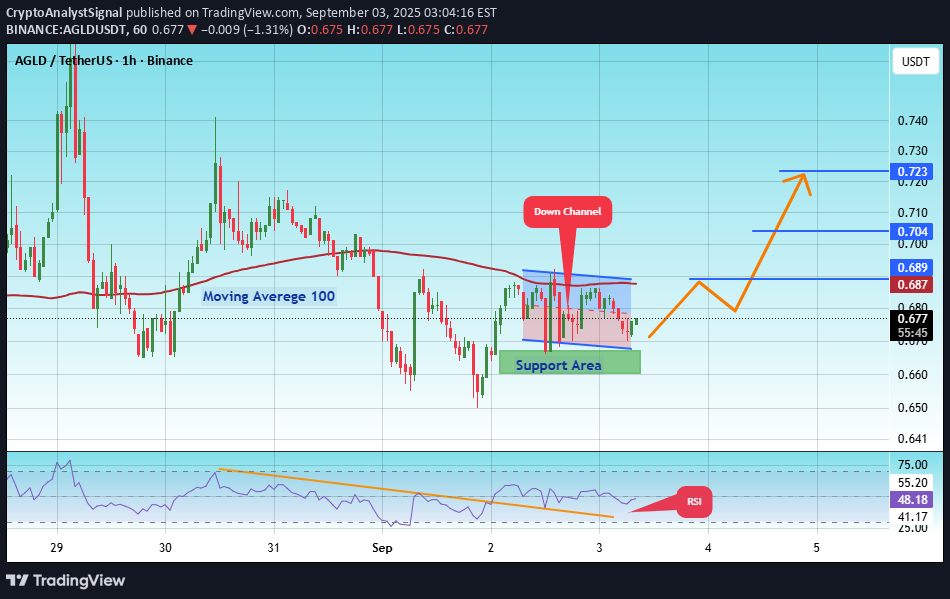
#AGLD The price is moving within a descending channel on the 1-hour frame, adhering well to it, and is heading for a strong breakout and retest. We have a bearish trend on the RSI indicator that is about to be broken and retested, which supports the upward breakout. There is a major support area in green at 0.662, which represents a strong support point. For inquiries, please leave a comment. We are in a consolidation trend above the 100 moving average. Entry price: 0.675 First target: 0.686 Second target: 0.704 Third target: 0.723 Don't forget a simple matter: capital management. When you reach the first target, save some money and then change your stop-loss order to an entry order. For inquiries, please leave a comment. Thank you.#AGLD First target: 0.686 Reached Second target: 0.704 Reached Third target: 0.723 Reached

MasterAnanda
Adventure Gold 854% Target ($7.05)
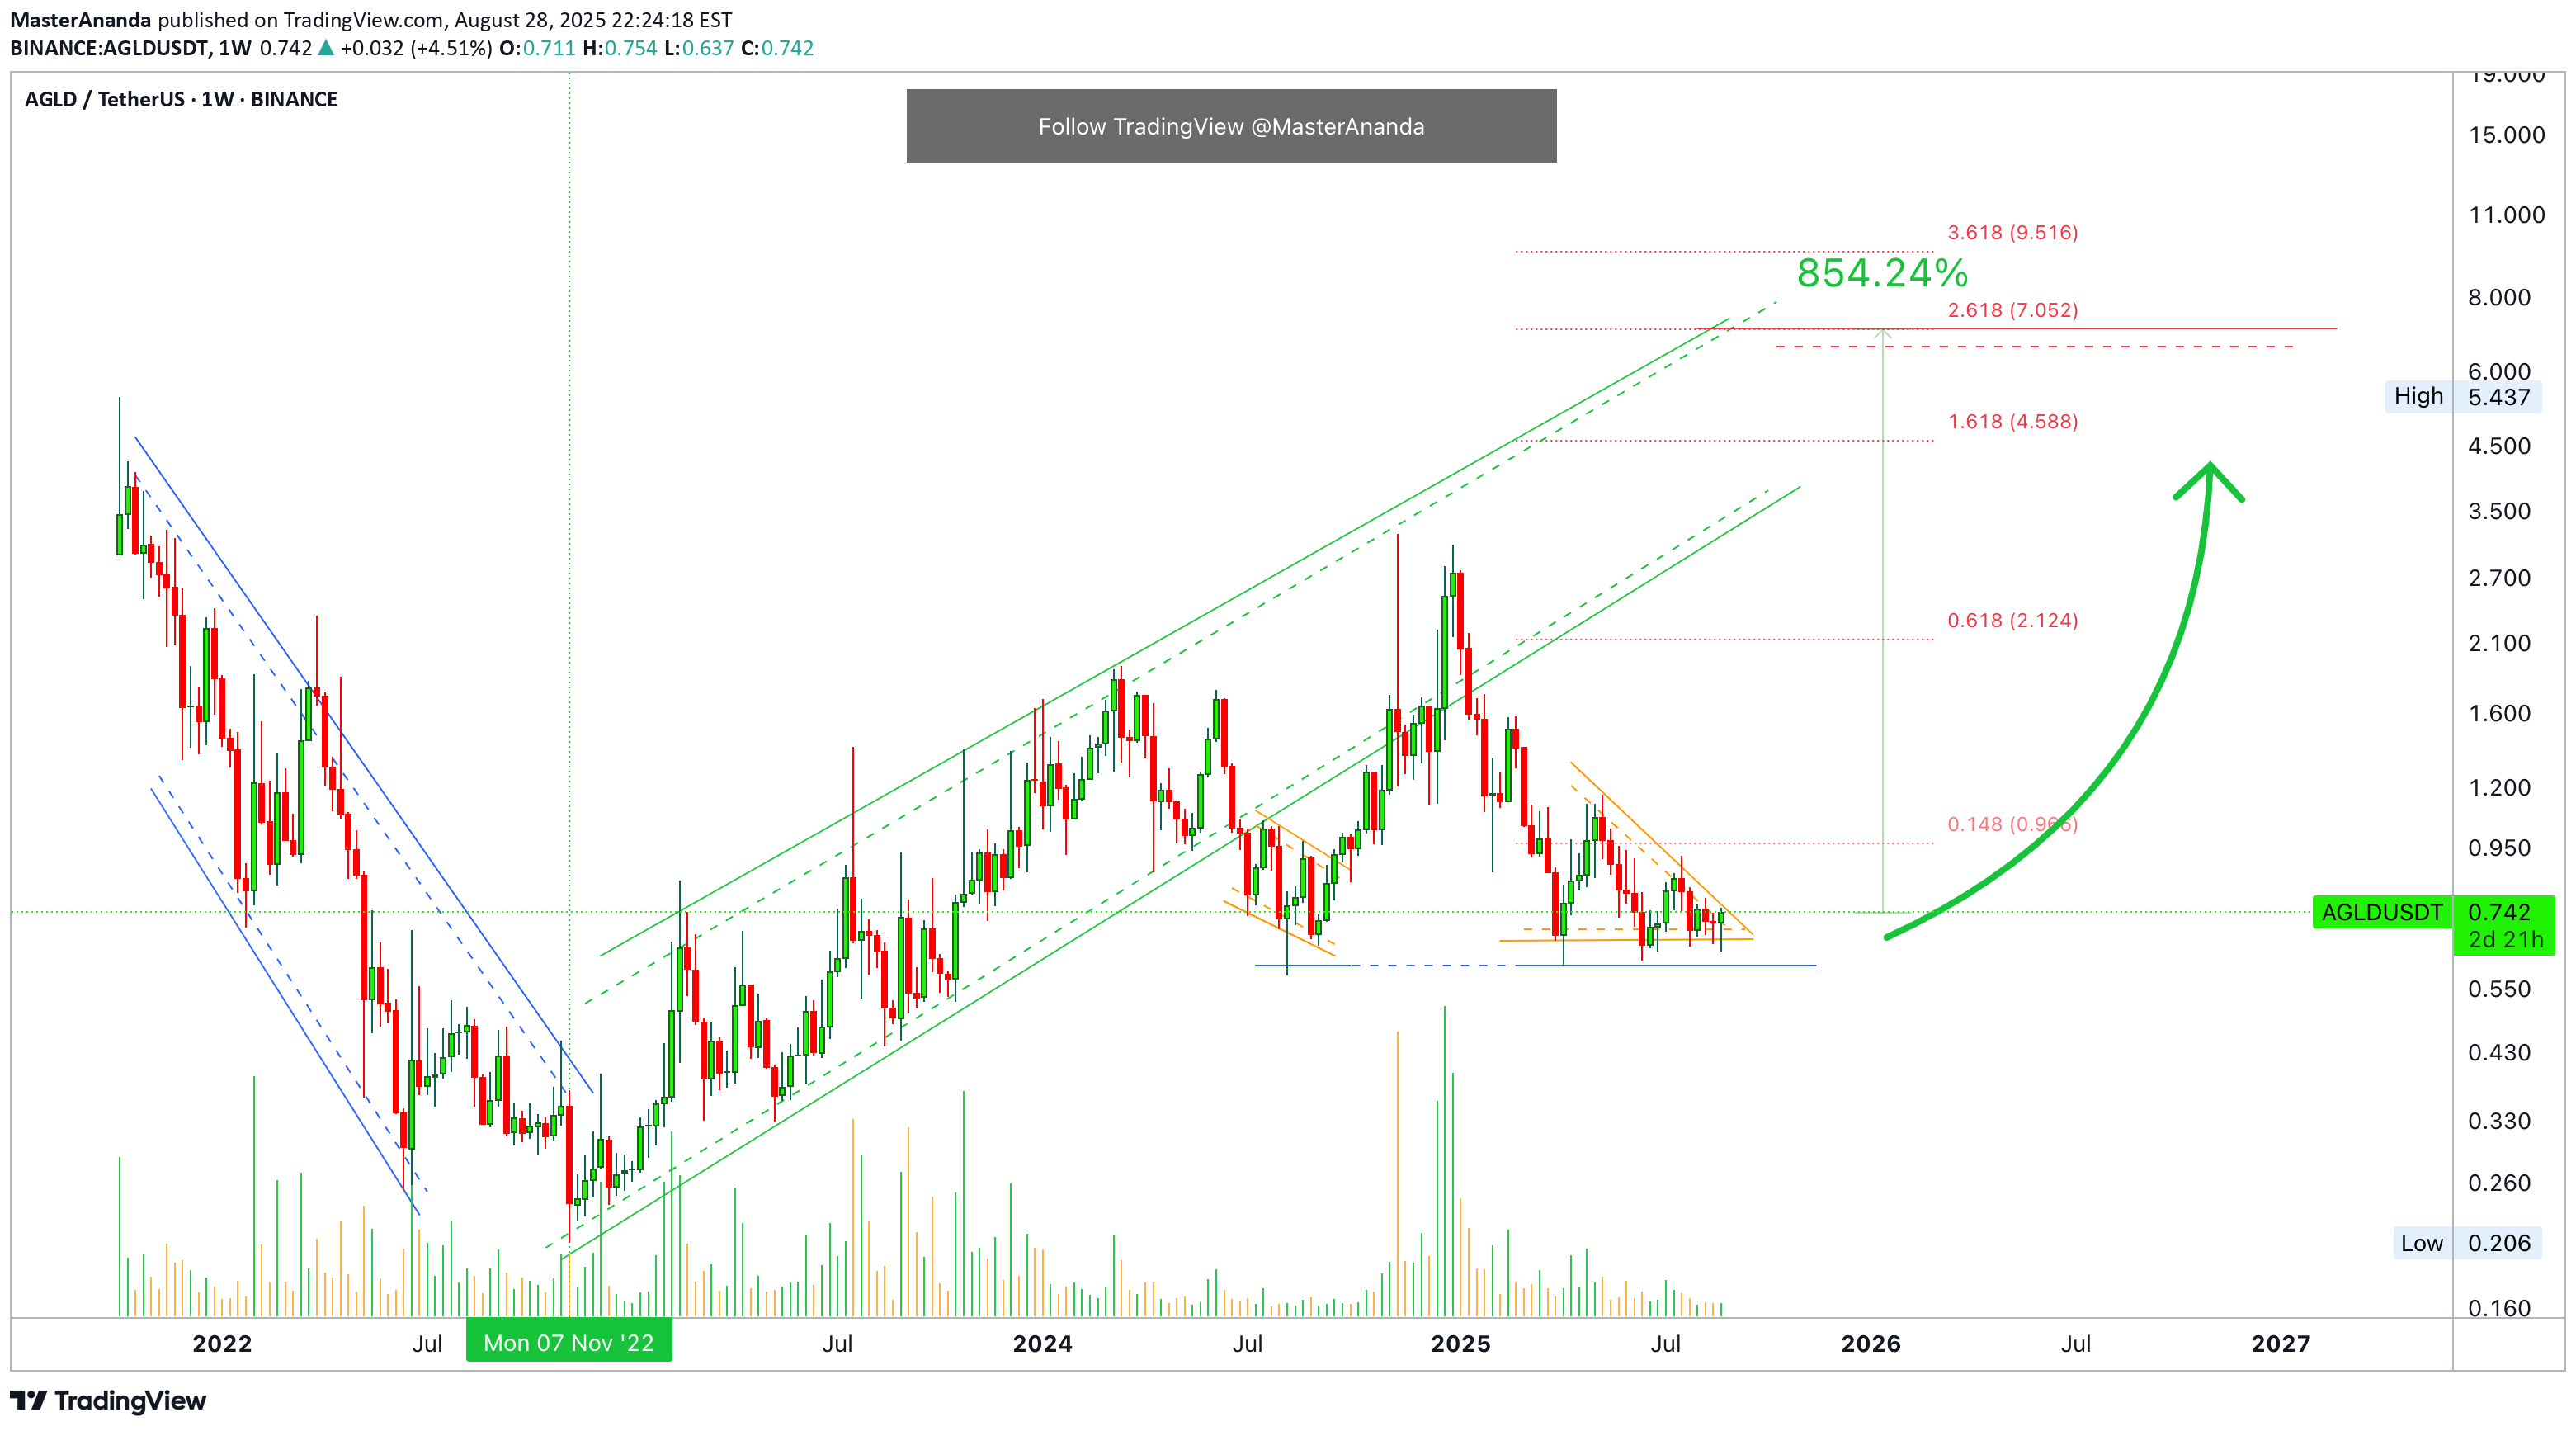
AGLD embarked on a major uptrend starting November 2022. The end was December 2024. This is an interesting chart. AGLDUSDT weekly is pretty interesting because of how the market changes from a perfect uptrend to a strange double-bottom pattern. But the flat base over such a long stretch of time, August 2024-2025, reveals that something is missing. So the uptrend started after the November 2022 low non-stop until March 2024. The March 2024 high leads to a correction and the first support is found August 2024. This was the first correction after more than a year of growth. Then in 2025 the August 2024 support is tested and so far it holds. It holds and we have higher lows with this week now going green. This is it. AGLDUSDT is preparing to launch a major bullish wave. That is why I mapped a major target on this chart at $7.05. Total profits potential amounts to 854%. Good luck and good profits... Enjoy the trade. Namaste.
CryptoAnalystSignal
#AGLD/USDT
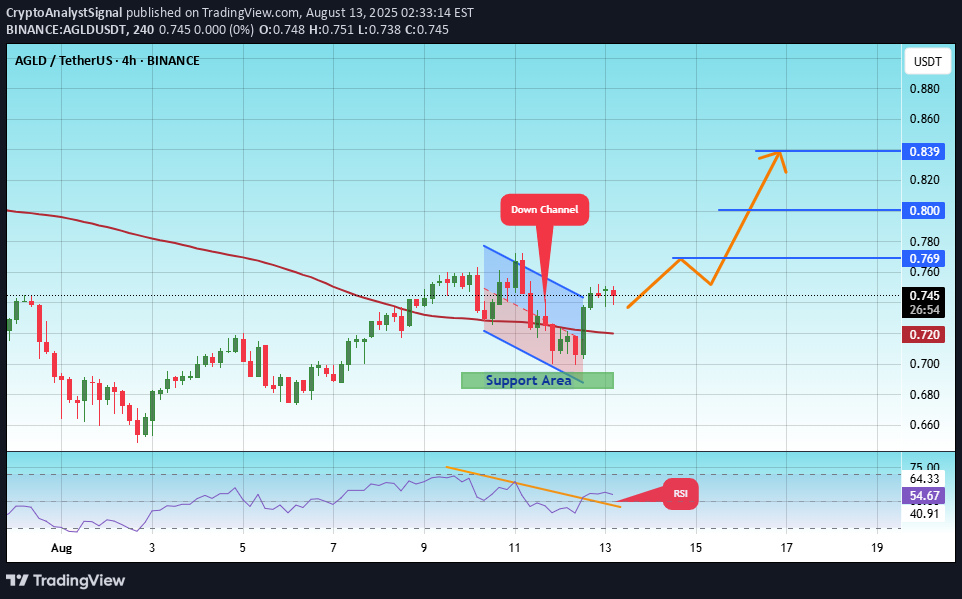
#AGLD The price is moving within an ascending channel on the 1-hour frame, adhering well to it, and is on its way to break it strongly upwards and retest it. We have support from the lower boundary of the ascending channel, at 0.700. We have a downtrend on the RSI indicator that is about to break and retest, supporting the upside. There is a major support area in green at 0.688, which represents a strong basis for the upside. Don't forget a simple thing: ease and capital. When you reach the first target, save some money and then change your stop-loss order to an entry order. For inquiries, please leave a comment. We have a trend to hold above the 100 Moving Average. Entry price: 0.745 First target: 0.769 Second target: 0.800 Third target: 0.840 Don't forget a simple thing: ease and capital. When you reach your first target, save some money and then change your stop-loss order to an entry order. For inquiries, please leave a comment. Thank you.
CryptoAnalystSignal
#AGLD/USDT Alert! Imminent Rise

#AGLD The price is moving within a descending channel on the 1-hour frame, adhering well to it, and is on its way to breaking strongly upwards and retesting it. We have support from the lower boundary of the descending channel, at 0.850. We have a downtrend on the RSI indicator that is about to be broken and retested, supporting the upside. There is a major support area (in green) at 0.835, which represents a strong basis for the upside. Don't forget a simple thing: ease and capital. When you reach the first target, save some money and then change your stop-loss order to an entry order. For inquiries, please leave a comment. We have a trend to hold above the 100 Moving Average. Entry price: 0.850 First target: 0.885 Second target: 0.909 Third target: 0.943 Don't forget a simple thing: ease and capital. When you reach your first target, save some money and then change your stop-loss order to an entry order. For inquiries, please leave a comment. Thank you.
MasterAnanda
Adventure Gold 679% Easy Target, High Profits & TA (8X Lev)

I can translate all of the signals and all the chart data but the truth is that "bullish" because that is what the chart is screaming to me. The chart is saying "bullish" and my intuition is telling me that Adventure Gold (AGLD) is going to move next. Notice I continue to pick the ones trading low near support. Those trading within the "opportunity buy zone" for our trades. When it comes to those already moving, I only give updates. When it comes to buying and trade-numbers, I choose the ones with low risk vs a high potential for reward. AGLDUSDT has been closing green four weeks slowly rising, but prices remain very low. This is a bullish type of consolidation. It is a tricky signal because it might look weak but the truth is that this pattern tends to transform into a bullish explosion. The choice is yours. I give you the chart, the translation, the basics, the training, the learning, the entertainment, the inspiration. I give you peace of mind and the right price. You have to take care of the rest. I can show you the door, but you have to cross it. You have to buy and hold, and be ready to sell when prices are at resistance or near resistance where I show in these charts. We are a team. It is a huge sacrifice to be able to read the charts without losing focus, without going crazy due to all the distractions, all of the attacks and all of the stress. I have to develop a Buddha kind of meditative mind to be able to keep up and give you only the best. You know I can do it because I've been doing it, the results will speak for themselves, but is it not easy. I have to give my life for these charts and this market, but it is worth it if you take action and use this information to achieve your goals and financial success. Thank you for reading. We are in this together. I love you, truly. We've been together for so long, and this is only the start. Namaste.

Bithereum_io
AGLDUSDT 1D

Pay attention to the #AGLD daily chart. It has already broken above the descending resistance and is currently testing the daily SMA100 multiple times. Consider buying some #AGLD here and near the support levels at $0.747 and $0.687. If a breakout above the SMA100 occurs, the upside targets are: 🎯 $0.976 🎯 $1.092 🎯 $1.207 🎯 $1.372 🎯 $1.582 ⚠️ Always use a tight stop-loss and apply proper risk management.
Disclaimer
Any content and materials included in Sahmeto's website and official communication channels are a compilation of personal opinions and analyses and are not binding. They do not constitute any recommendation for buying, selling, entering or exiting the stock market and cryptocurrency market. Also, all news and analyses included in the website and channels are merely republished information from official and unofficial domestic and foreign sources, and it is obvious that users of the said content are responsible for following up and ensuring the authenticity and accuracy of the materials. Therefore, while disclaiming responsibility, it is declared that the responsibility for any decision-making, action, and potential profit and loss in the capital market and cryptocurrency market lies with the trader.