
ACT
Achain
| تریدر | نوع سیگنال | حد سود/ضرر | زمان انتشار | مشاهده پیام |
|---|---|---|---|---|
 CryptoWithJamesRank: 2124 | خرید | حد سود: ۰٫۰۰۷۶ حد ضرر: تعیین نشده | 9/17/2025 |
Price Chart of Achain
سود 3 Months :
سیگنالهای Achain
Filter
Sort messages by
Trader Type
Time Frame
CryptoWithJames
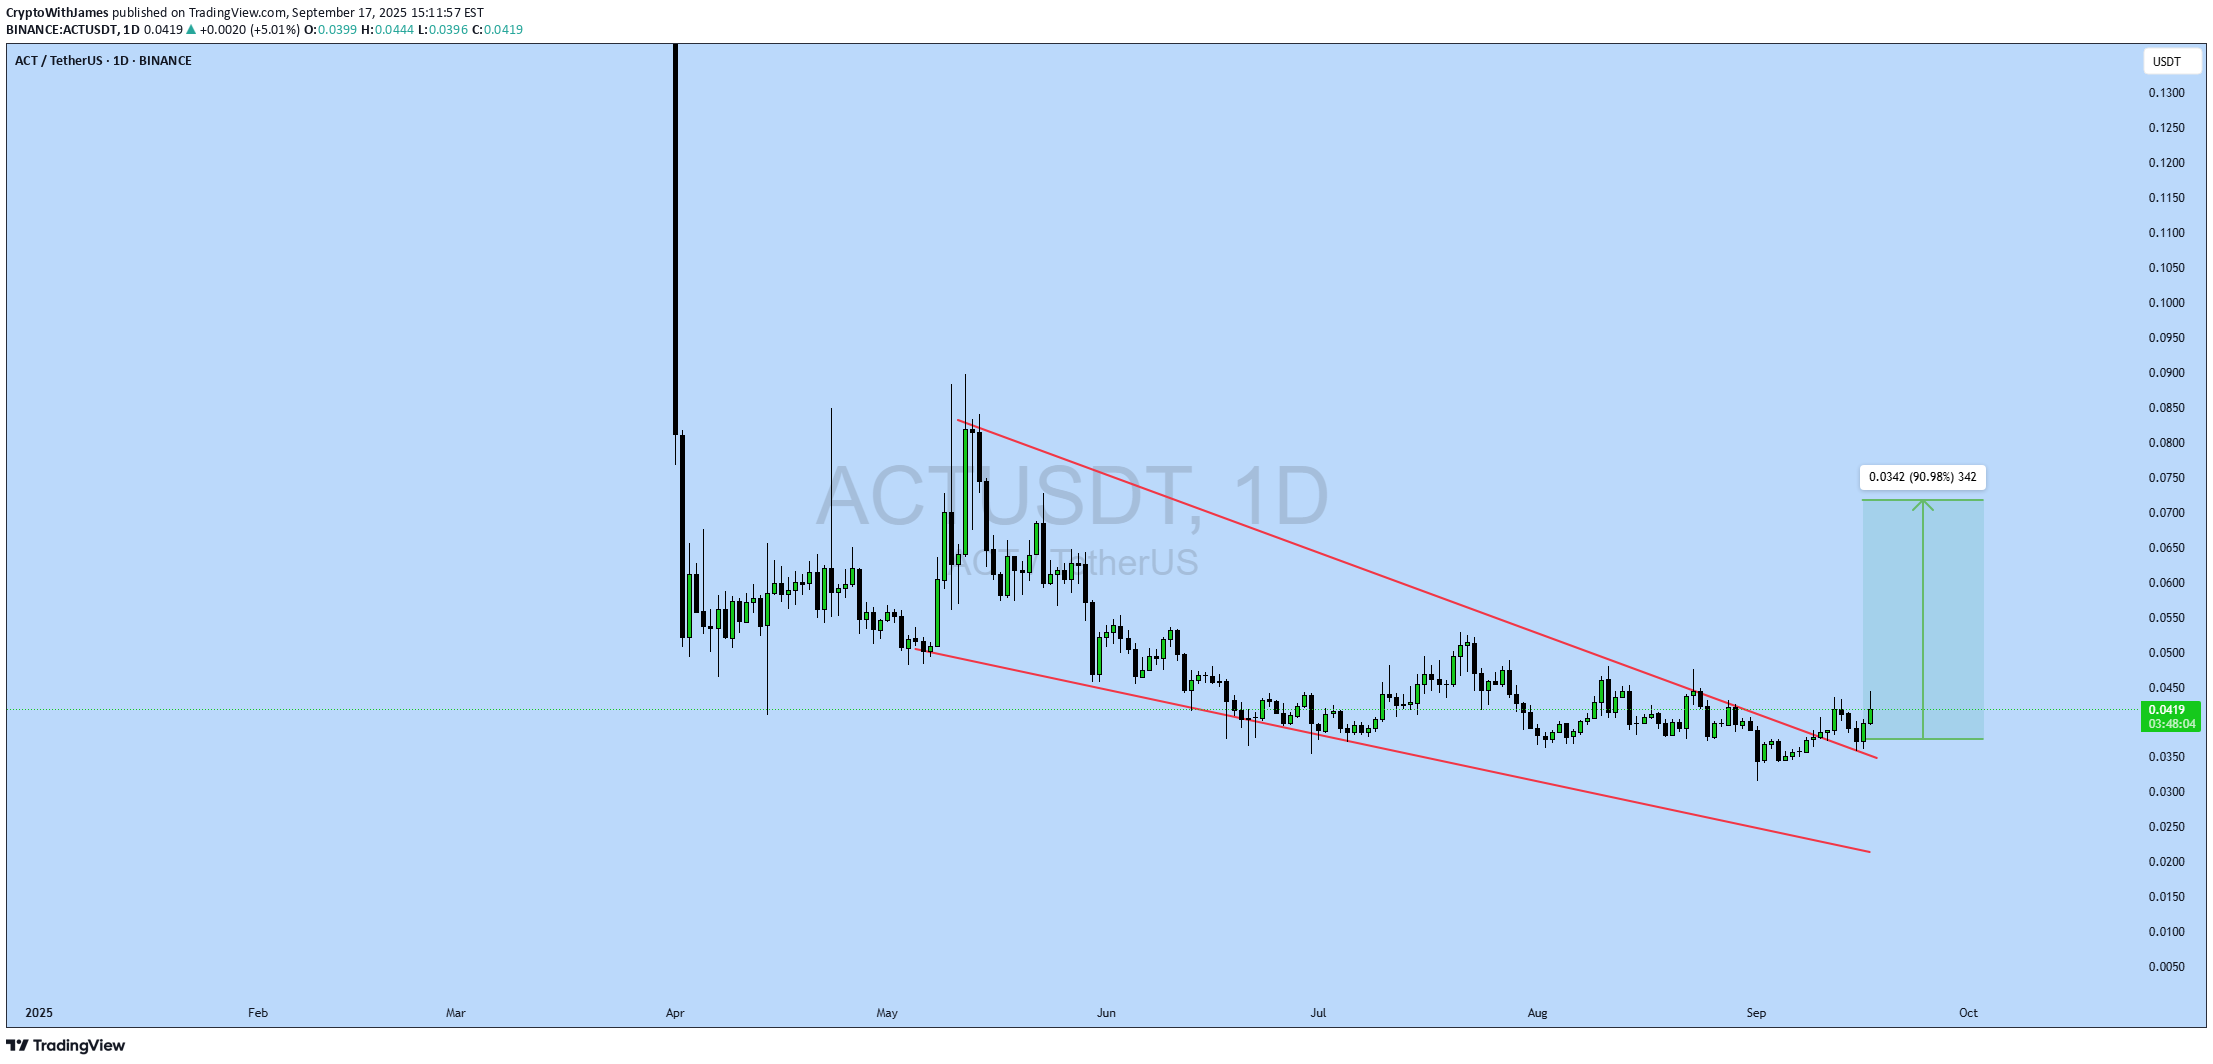
#ACT UPDATE ACT Technical Setup Pattern: Bullish Falling Wedge Pattern Current Price: $0.00542 Target Price: $0.00760 Target % Gain: 40.29% ACT is breaking out of a falling wedge pattern on the 1D timeframe. Current price is $0.00542 with a target near $0.00760, showing about 40% potential upside. The breakout confirms bullish momentum with structure favoring continuation. Always use proper risk management. Time Frame: 1D Risk Management Tip: Always use proper risk management.

AltcoinPiooners

ACTUSDT ACT Ignite the Comeback! Thrilling 4-Hour Trading Setup Price Action Description Historical Trend: The price began around 0.04-0.05 USDT in mid-August, with a gradual decline punctuated by choppy movements. A sharp drop occurred in early September, pushing it toward the current level of 0.0341 USDT. Recent Movement: A significant red candlestick around September 2 marks a drop from approximately 0.05-0.06 USDT to 0.0341 USDT (current price), suggesting strong selling pressure or a market event. The price has stabilized near this low, with smaller candles hinting at consolidation. Current Price: Approximately 0.0341 USDT, down about 30-40% from mid-August highs, suggesting potential oversold conditions. Volatility: High, as evident from the long wicks and large candle bodies during the recent drop, though volume data is not visible. Key Technical Levels Entry: Set at 0.0341 USDT, the suggested point to enter a long position, matching the current price of 0.0341 USDT, indicating an immediate buy opportunity. TP (Take Profit): Targets are 0.0370 USDT for the first profit take, followed by 0.0393 USDT, 0.0409 USDT, and the highest goal at 0.0477 USDT, providing a range of exit points for potential gains. DCA: Positioned at 0.0322 USDT, a level to add to the trade if the price dips slightly, helping to average down the entry cost. SL (Stop Loss): Placed at 0.0316 USDT, the cutoff to exit the trade if the price falls, limiting losses and protecting the position. Fibonacci Context: These levels likely derive from a Fibonacci retracement or extension tool applied to the recent drop from 0.05-0.06 USDT to 0.0341 USDT, suggesting a potential reversal zone for a long setup. Risk-Reward: Risk from 0.0341 to 0.0316 is 0.0025 USDT, with rewards to 0.0370 (0.0029, RR 1.16:1) and up to 0.0477 (0.0136, RR ~5.44:1), indicating a favorable setup if the bounce occurs. Indicators Analysis RSI (Relative Strength Index): Current value is 22.36, below 30, signaling oversold conditions and a potential rebound. The line has trended downward sharply with the recent drop, showing momentum weakening, but no clear bullish divergence yet. The RSI scale (0-100) marks overbought above 70, not relevant here. Potential Trading Implications and Risks Bullish Case: The setup suggests a bottom-fishing opportunity post-drop, supported by oversold RSI. A rebound to take-profit levels is plausible if the broader crypto market stabilizes or if positive news emerges for Achain (e.g., network upgrades). Bearish Case: The recent sharp decline and lack of immediate recovery indicate ongoing selling pressure. Breaking below 0.0316 (SL) could lead to further declines toward 0.03 USDT or lower. Risks: High volatility due to ACT’s lower market cap, lack of volume data (limiting liquidity insight), and subjective Fib levels. Use risk management (e.g., 1-2% account risk). Suggestions: Confirm with bullish patterns (e.g., hammer) at 0.0341 or RSI crossing above 30.ENTRY 0.0341 TARGET SCALP ✅ +9.70% PROFIT 🌍 Believe you can and you’re halfway there. Interested for Premium 👉 t.me/Altcoin_Piooners Follow for signals! 🔥#Crypto #Trading #CryptoSignals #ACT #Altcoins

Alpha-GoldFX
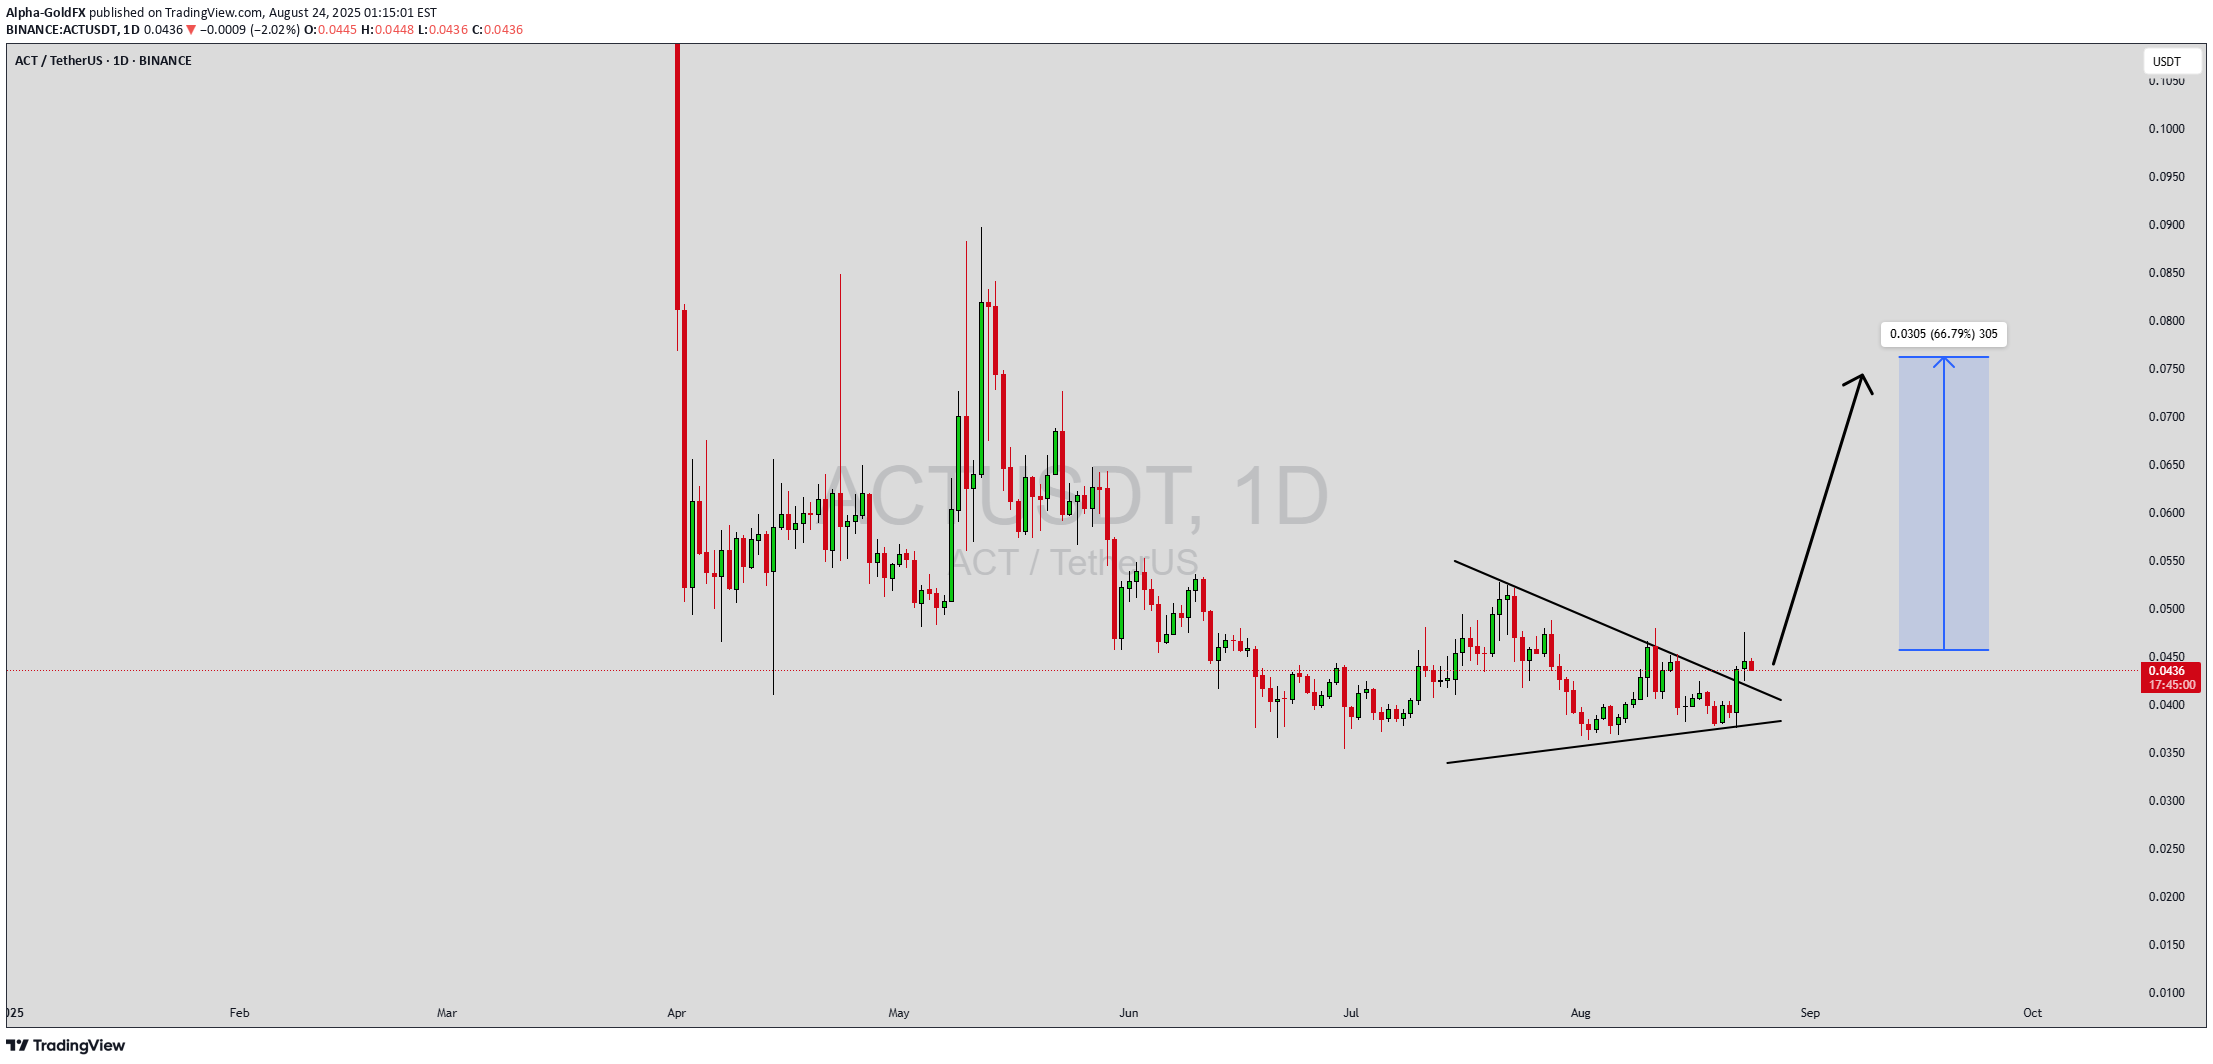
ACTUSDT is showing a bullish pennant pattern on the charts, which is typically considered a continuation signal of upward momentum. After a strong upward move, the price is now consolidating within a tight range, forming a pennant structure. This kind of setup often precedes another breakout to the upside, backed by good trading volume and renewed market confidence. The current volume activity suggests that buyers are maintaining control, and a breakout from this formation could lead to a significant rally. With expectations of a 50% to 60%+ gain, ACTUSDT is positioning itself as a strong candidate for traders looking for short- to mid-term bullish opportunities. Investors should closely monitor resistance zones, as a confirmed breakout above them could fuel rapid price expansion. Market interest in ACTUSDT has been rising, with more traders recognizing its technical strength. As momentum builds and the pennant nears completion, volatility could increase, giving investors opportunities to benefit from sharp price movements. The alignment of bullish technical patterns with growing investor participation creates a favorable environment for sustained growth. ✅ Show your support by hitting the like button and ✅ Leaving a comment below! (What is You opinion about this Coin) Your feedback and engagement keep me inspired to share more insightful market analysis with you!

Captain-MAO


abdulrahman_meri
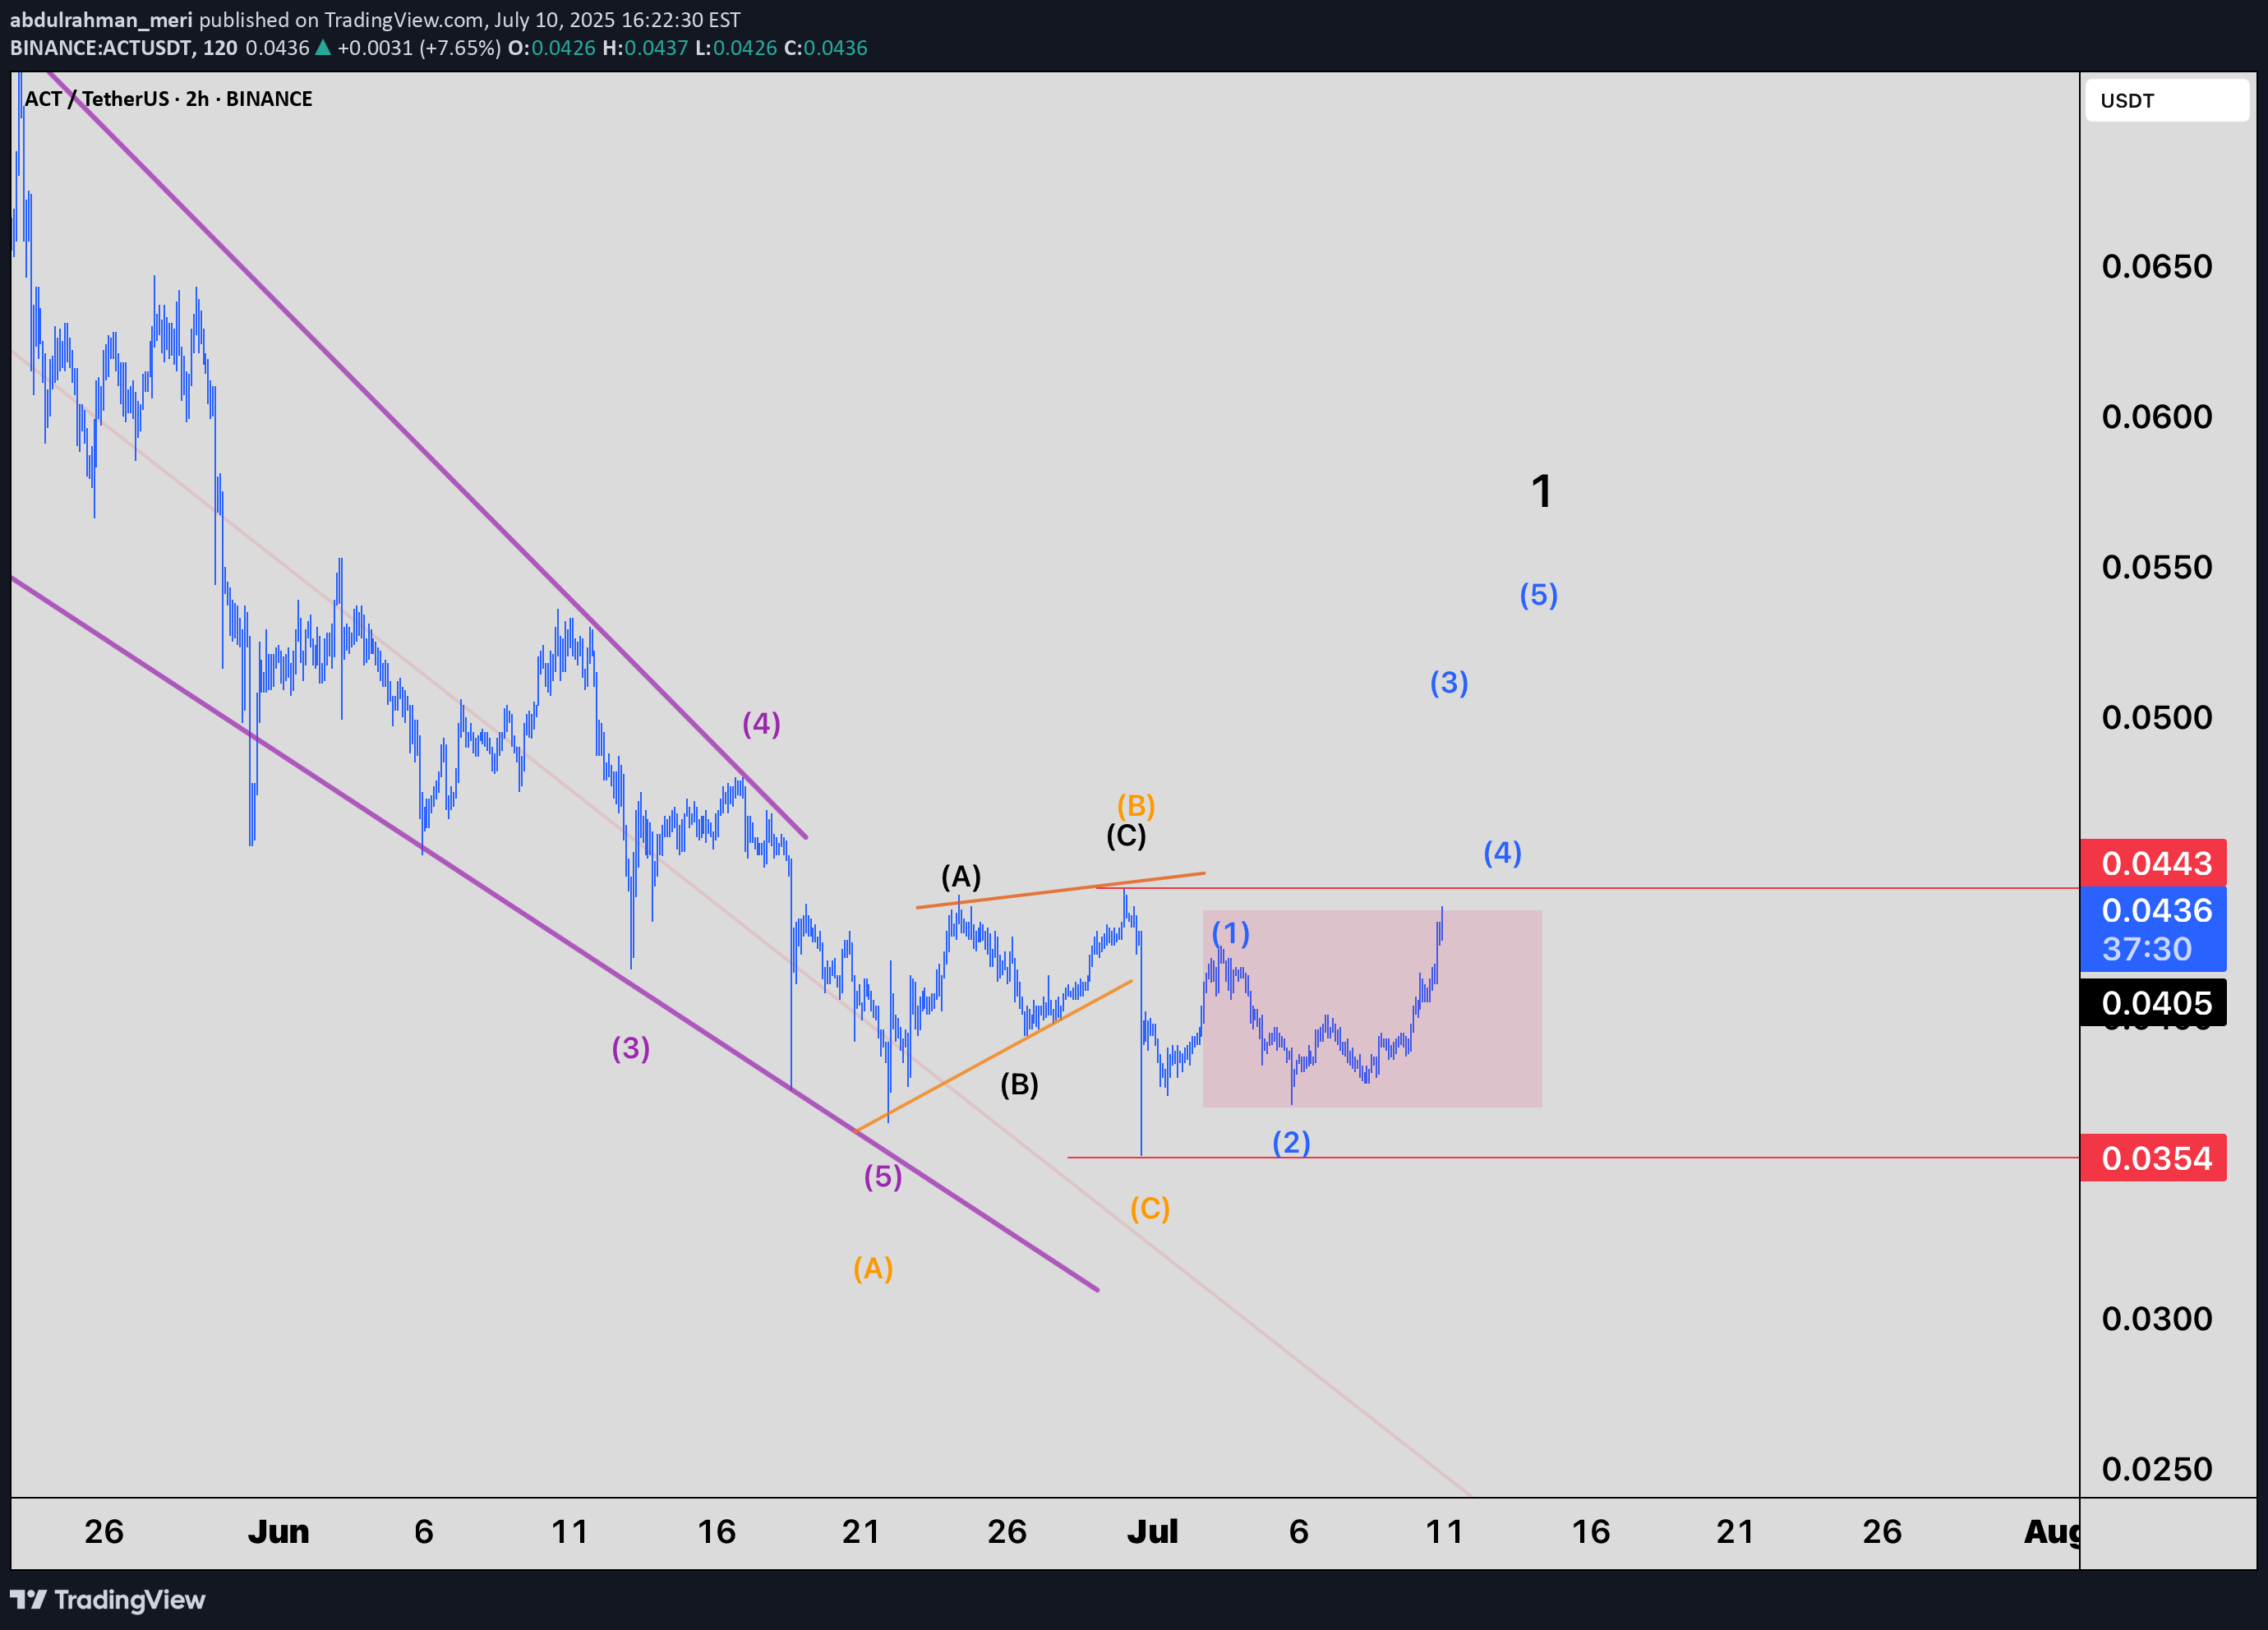
🧠 Idea Description:After a clear (A)-(B)-(C) corrective structure, price formed a solid bottom at 0.0354. Since then, the market entered a consolidation range and has now broken out to the upside.According to Elliott Wave Theory, this breakout likely marks the beginning of an impulsive move. We're currently in wave (iii) or (v) of a new 5-wave structure.🔍 Key Levels:Support: 0.0354 (last low / invalidation point)Resistance: 0.0443 (recent peak — breaking it confirms bullish continuation)Target zones:1.0 extension: 0.0531.618 extension: 0.0622.0 extension: 0.06692.618 extension: 0.0758✅ Summary:Price has exited a consolidation range and may be entering a bullish impulse wave. Watch for a confirmed break of 0.0443. Ideal area to target partial take-profits using Fibonacci extensions.

karaco2022

ACTUSDT – Daily Technical Analysis After experiencing a 74% correction, ACT has reached a major support level at $0.0480 , where the price has currently stabilized. From this zone, there is a potential upside move of 26%, targeting the resistance at $0.0650. However, traders should closely monitor the support level, as a confirmed breakdown below $0.0480 could trigger a bearish flag continuation pattern, potentially leading to another 74% drop. 🟢 Support: $0.0480 (major level) 🔴 Resistance: $0.0650 (26% above current price) ⚠️ Risk: Breakdown could activate a bearish flag and resume the downtrendThis cryptocurrency reached its target and grew by 26%. You can save your profit and hold this cryptocurrency. There is also a possibility of its correction now.


حدود ۳-۴ هفته پیش، فروشهای جدی در برخی از کوینها رخ داد، ACT هم یکی از آنها بود. در حال حاضر، به نظر میرسد که یک ریزش جعلی رو به پایین را شاهد هستیم. انتظار دارم از اینجا جمع شده و به سمت سطح ۰.۱۵ دلار حرکت کند. با این حال، کوین بسیار پرریسکی است، بنابراین میتوان با احتیاط و با قرار دادن آن در لیست پیگیری (monitoring) به آن نزدیک شد.

حدود ۳-۴ هفته پیش، فروش سنگینی در برخی از کوینها رخ داد که ACT هم یکی از آنها بود. در حال حاضر، به نظر میرسد یک ریزش جعلی رو به پایین را شاهد هستیم. انتظار دارم از اینجا جمع شده و به سمت سطح ۰.۱۵ دلاری حرکت کند. با این حال، این کوین بسیار پرریسک است، بنابراین میتوان با قرار دادن آن در لیست پیگیری (monitoring) و با احتیاط به آن نزدیک شد.

loyalman

This coin is about to fly After the accumulation on the demand area, it's going to move really fastPls manage your risk, this is not in any way a financial advise

zameer_balti

ACTUSDT is showing bullish divergence in 4H time frame and also broke rectangular box
Disclaimer
Any content and materials included in Sahmeto's website and official communication channels are a compilation of personal opinions and analyses and are not binding. They do not constitute any recommendation for buying, selling, entering or exiting the stock market and cryptocurrency market. Also, all news and analyses included in the website and channels are merely republished information from official and unofficial domestic and foreign sources, and it is obvious that users of the said content are responsible for following up and ensuring the authenticity and accuracy of the materials. Therefore, while disclaiming responsibility, it is declared that the responsibility for any decision-making, action, and potential profit and loss in the capital market and cryptocurrency market lies with the trader.