
AAVE
Aave
| تریدر | نوع سیگنال | حد سود/ضرر | زمان انتشار | مشاهده پیام |
|---|---|---|---|---|
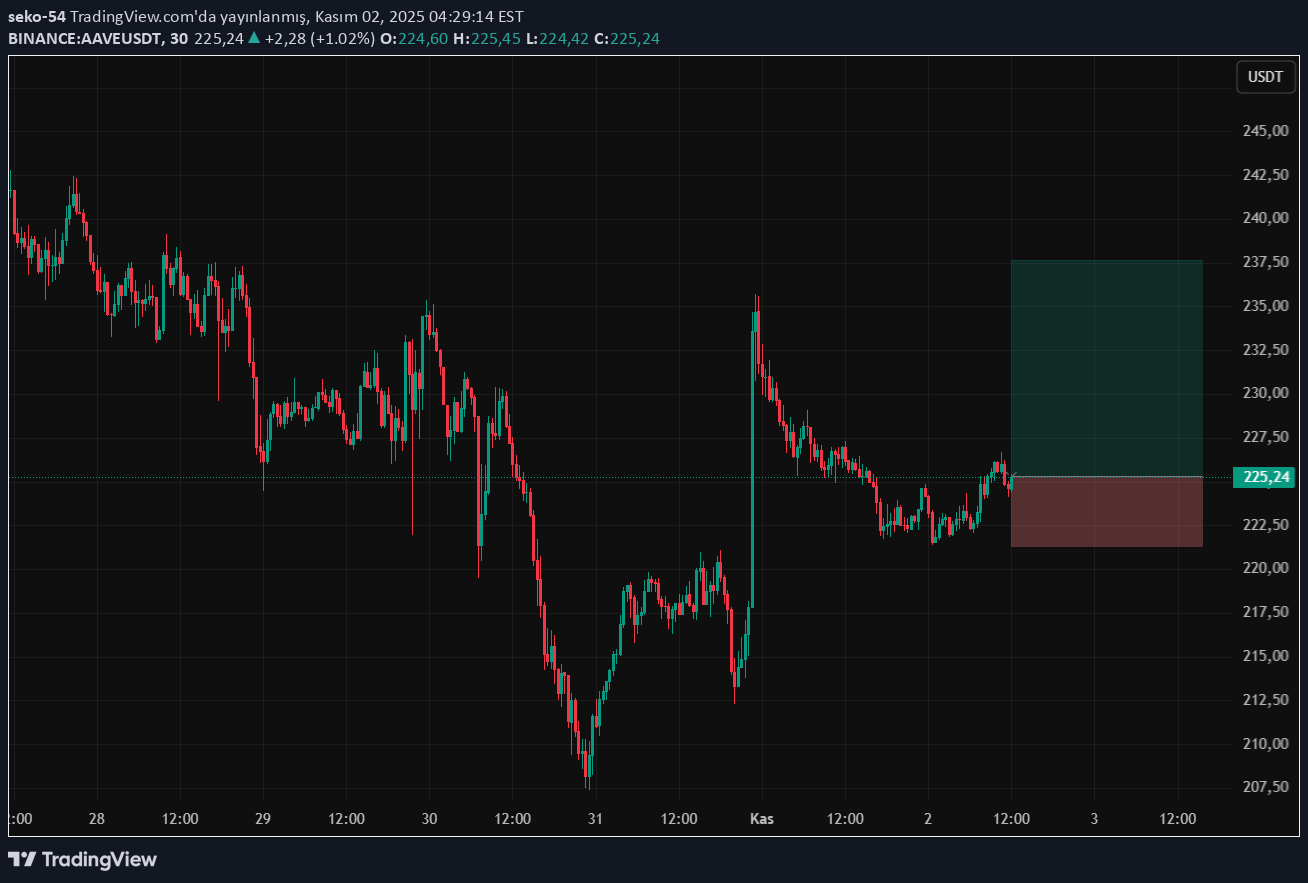
 seko-54Rank: 893 | خرید | حد سود: تعیین نشده حد ضرر: تعیین نشده | 5 hour ago | |
خرید | حد سود: تعیین نشده حد ضرر: تعیین نشده | 22 hour ago | ||
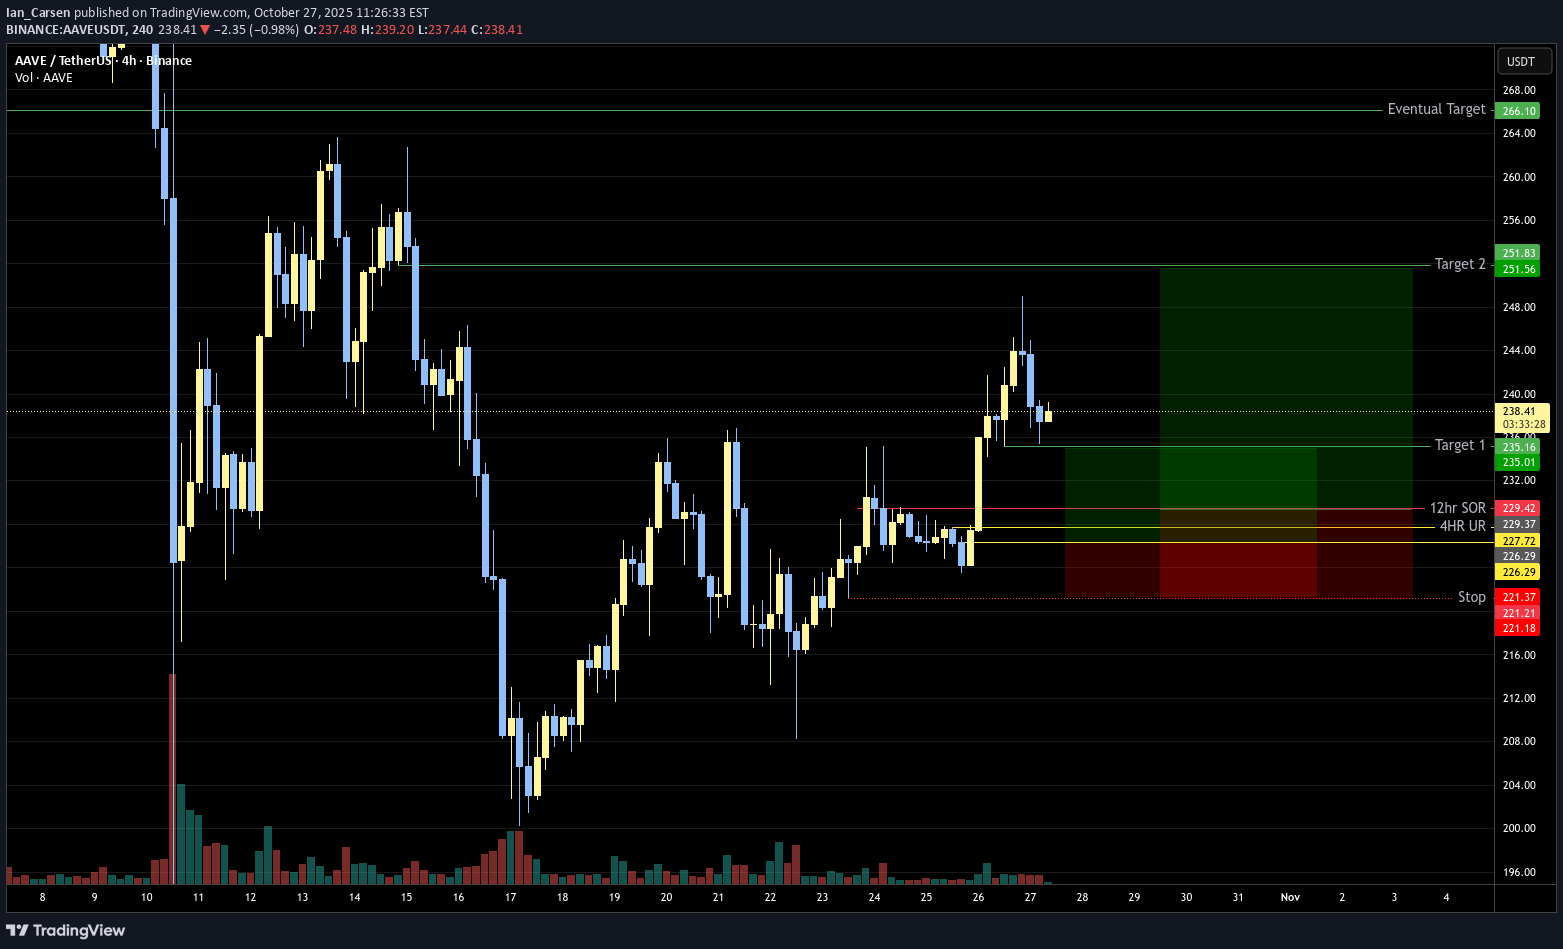
 SatochiTraderRank: 418 | خرید | حد سود: ۳۲۲ حد ضرر: ۲۰۰ | 10/27/2025 |

Price Chart of Aave
سود 3 Months :
خلاصه سیگنالهای Aave
سیگنالهای Aave
Filter
Sort messages by
Trader Type
Time Frame
seko-54
Aave چیست؟ راهنمای کامل سرمایهگذاری در پلتفرم وامدهی غیرمتمرکز
................................................................................. ...............................................................................................

آوه (AAVE) در نقطه عطف: آیا فرصت خرید طلایی برای رسیدن به ۱۰۰۰ دلار فرا رسیده است؟
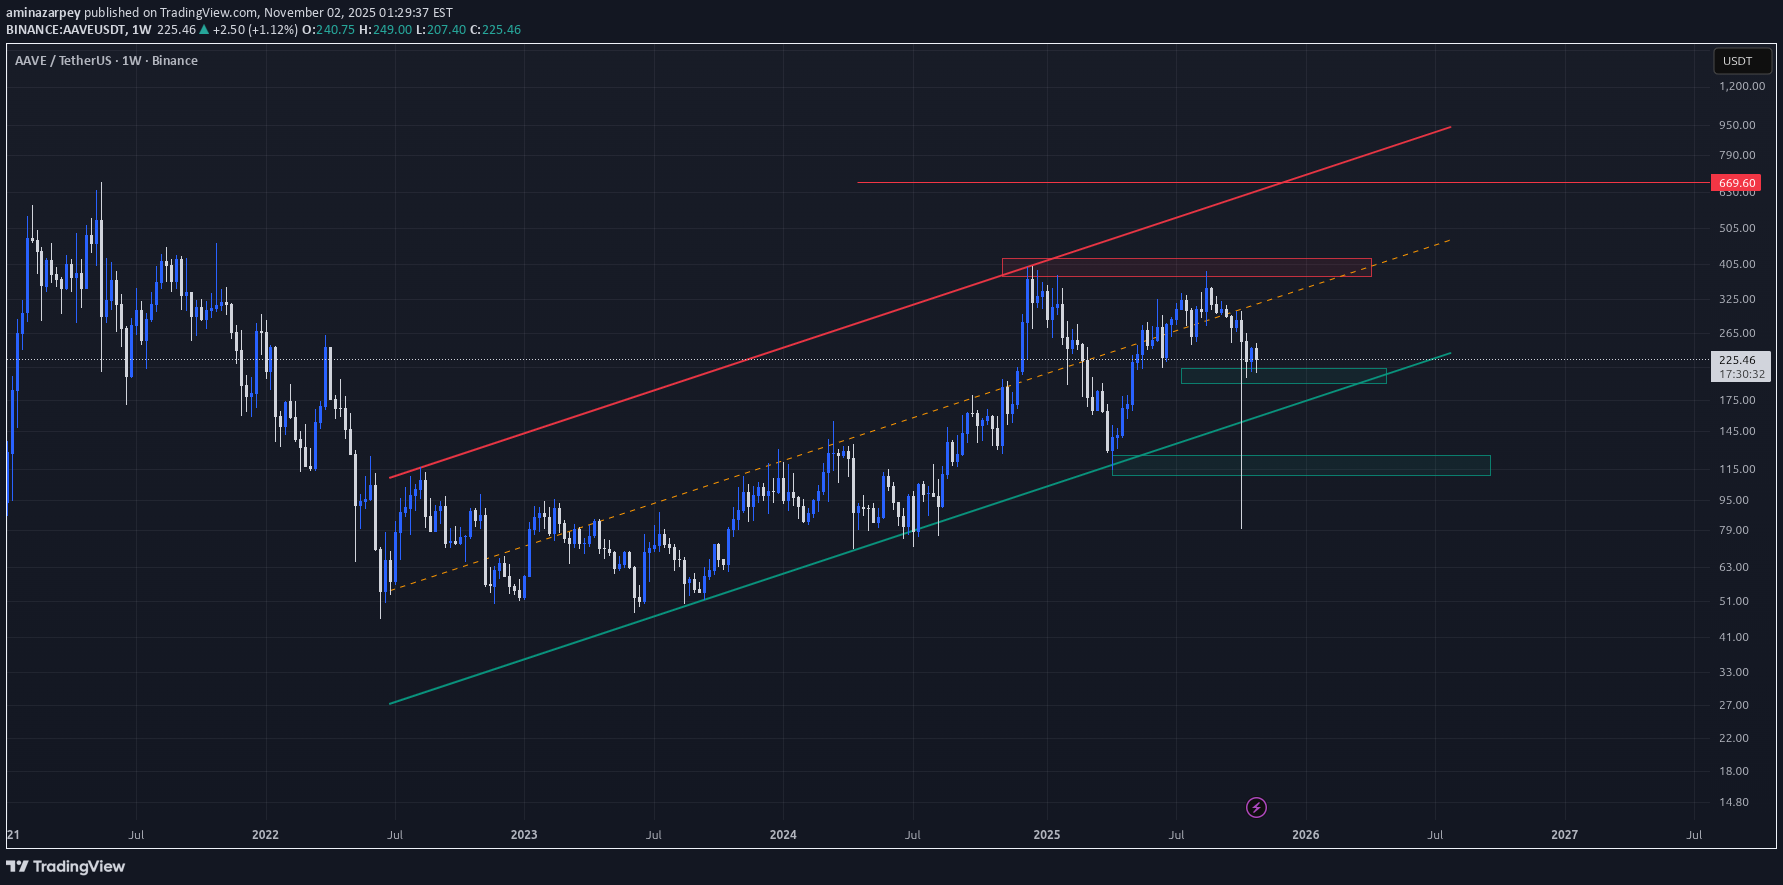
AAVE (AAVE/USDT) remains within a long-term ascending channel, showing consistent higher lows since mid-2022. After a strong rally toward the $400–$420 resistance zone, the price faced rejection and is now testing the mid-channel support area around $200–$220. This region has historically acted as a strong demand zone, aligning with the ascending green trendline. As long as AAVE holds above this level, the structure remains technically bullish in the bigger picture. A successful rebound from here could lead to a continuation move toward $400, and a confirmed breakout above that range could open the way toward $670 and even higher channel targets near $950–$1,000. Overall, AAVE looks technically healthy, and this correction might offer a solid reaccumulation opportunity for long-term investors.
سیگنال خرید AAVE/USDT با اهداف بزرگ: فرصت معاملاتی بلندمدت با ریسک کم!
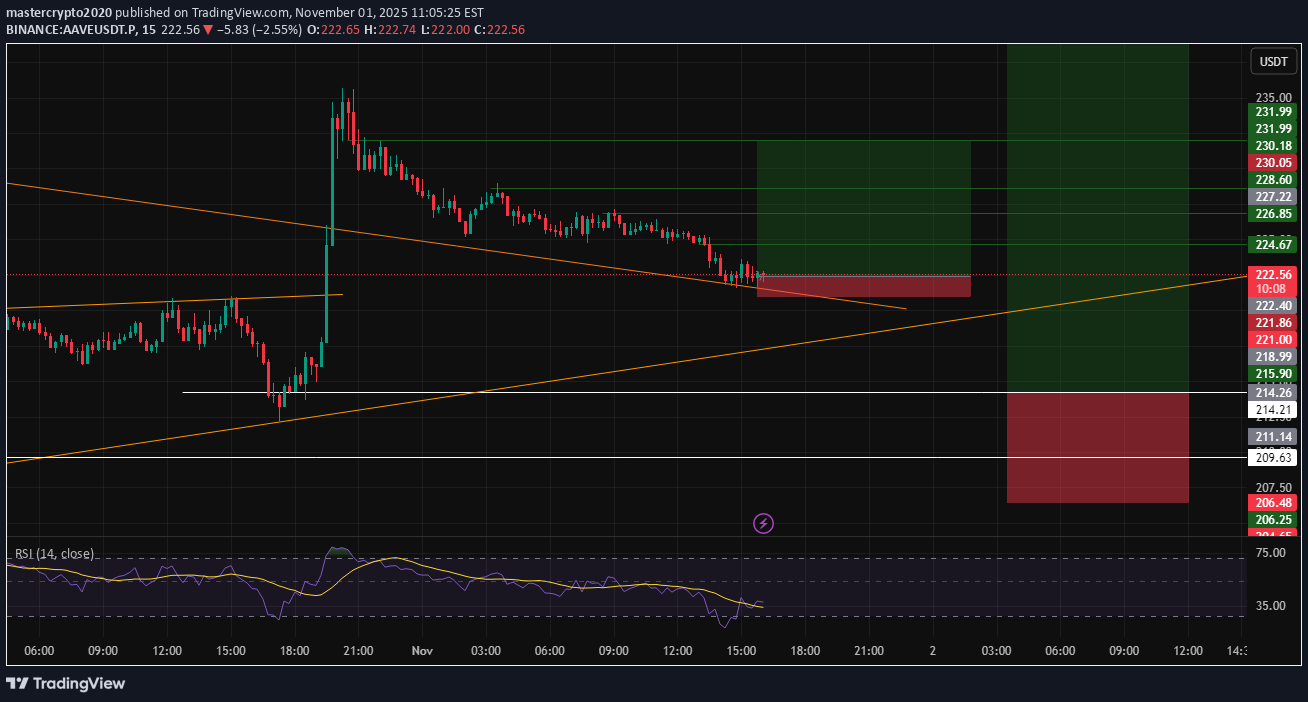
--- 📢 Signal Alert 🔹 Pair: AAVE / USDT 📈 Trade Type: Long 💰 Entry: 222.40 🎯 Targets (Take Profits): TP1 = 224.65 TP2 = 226.80 TP3 = 228.50 TP4 = 231.90 🛑 Stop-Loss: 221.00 📊 Timeframe: 1H ⚖️ Risk/Reward Ratio: 6.85 📌 Suggested Leverage: 5x – 10x --- 🧠 Technical Analysis AAVE is showing bullish continuation signals after consolidating near the 221 support area. The price has bounced from support and is forming a higher low pattern. RSI is turning upward and remains above the midline, showing growing bullish momentum. Entry at 222.40 offers a favorable low-risk, high-reward setup. Stop-Loss at 221.00 is set below the nearest swing low to manage risk efficiently. ⚠️ Confirm entry with a bullish 1H candle close or breakout of minor resistance. Consider partial profit-taking at TP1 and TP2, while holding remaining positions toward TP3 and TP4

Ian_Carsen

Maddox_Metrics
ساختار صعودی قوی AAVE: آیا پامپ بزرگ بعدی در راه است؟
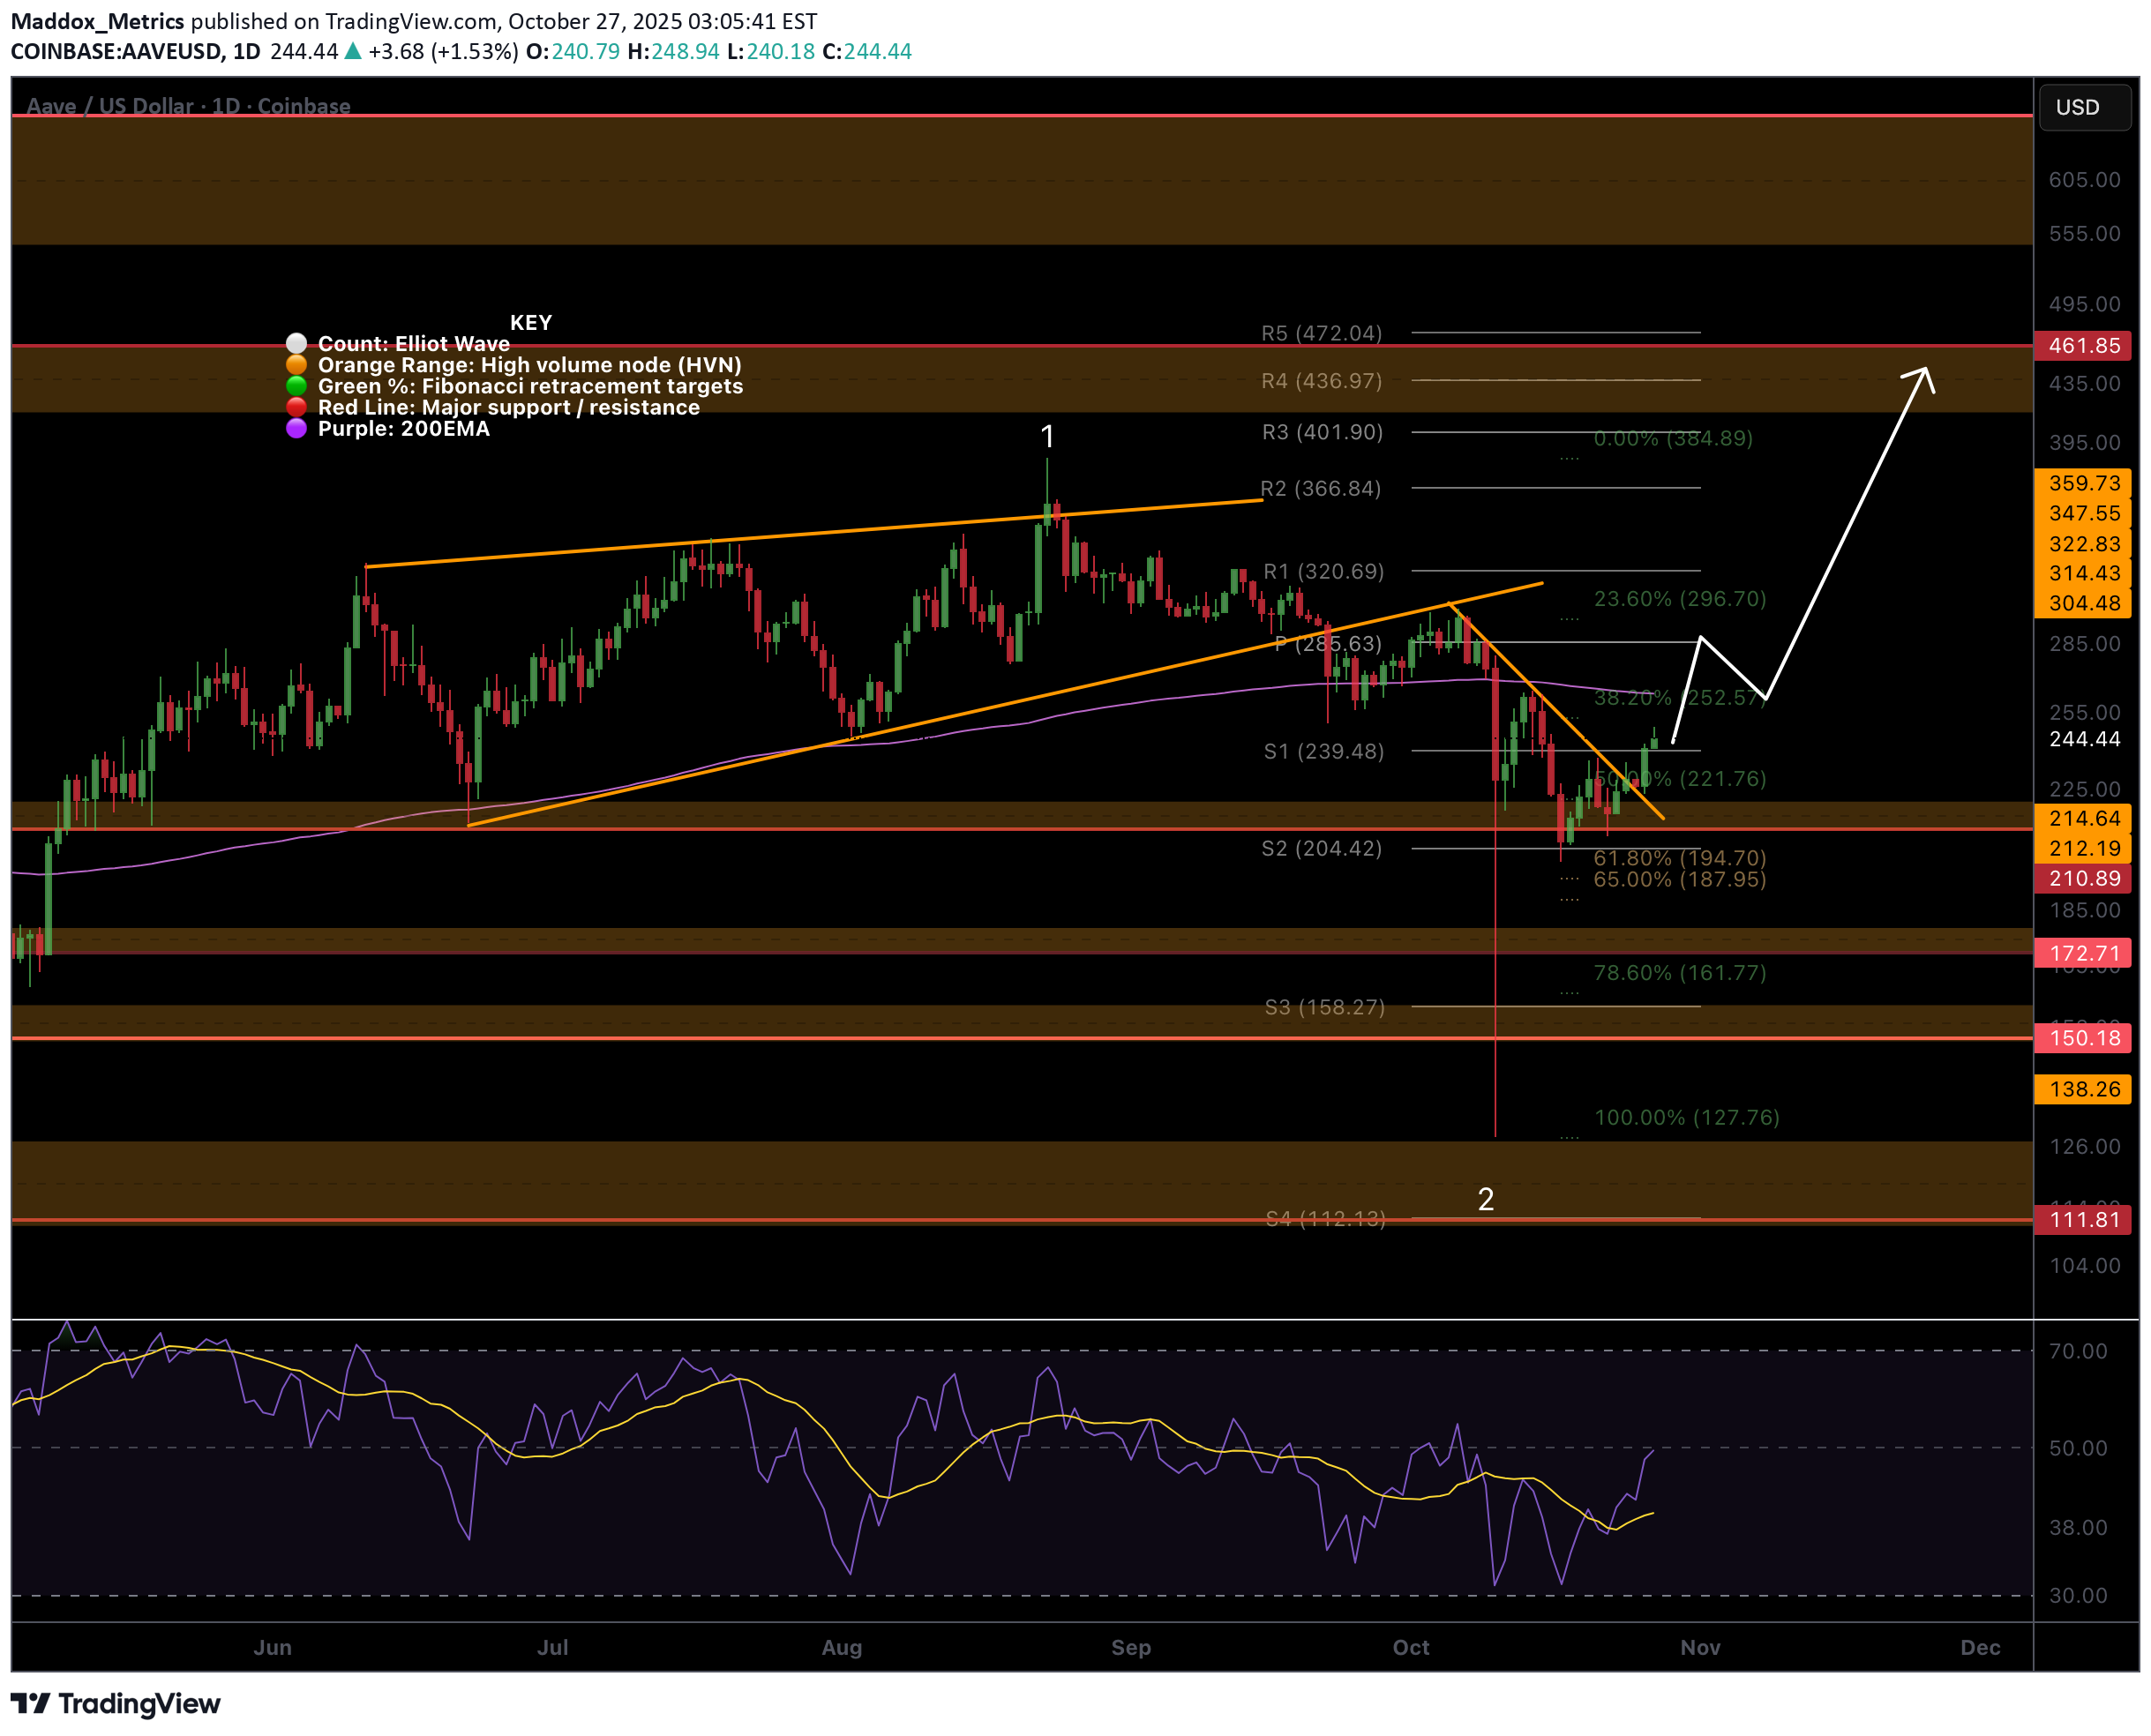
AAVE has printed bullish structure from support but the daily 200EMA looms ahead, once cracked AAVe should move well. Price tested the golden pocket Fibonacci retracement. AAVE did not pullback as much as most alt-coins and is expected to be one of the first to break into all time high / price discovery. First target is $460 High Volume Node. Daily RSI almost hit oversold twice in what looks like a double bottom Analysis is invalidated if we drop below $187 Safe trading
SatochiTrader
AAVE/USDT: صندوق حجم جدید فعال شد! هدف بعدی کجاست؟
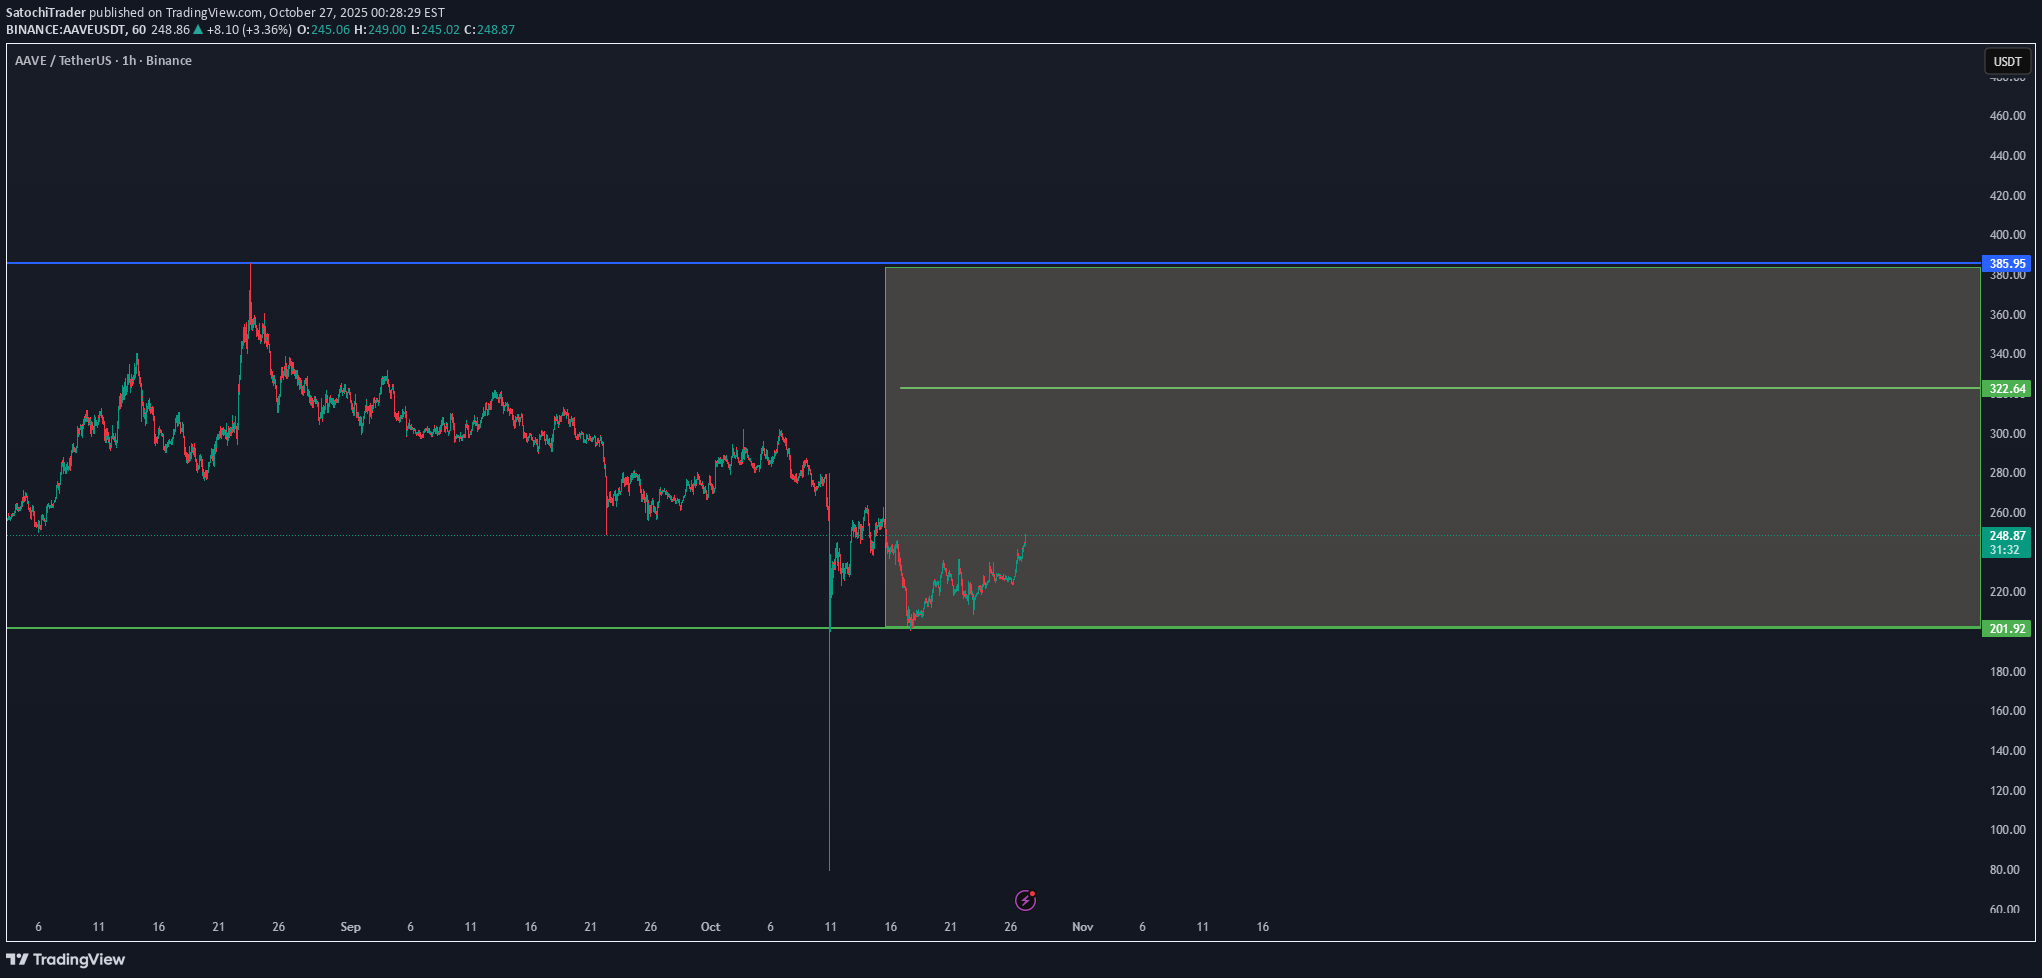
🔹 AAVE/USDT – New Volume Box Activation AAVE is forming a new volume box structure between $203 – $385, showing renewed momentum after the last low recovery. Price is currently stabilizing around the lower range with growing volume, suggesting early accumulation activity. As long as AAVE holds above the $200 support zone, we follow for a possible continuation inside this box. The first target for structure development sits around $322, followed by $385 as the main breakout resistance level. The setup remains active as long as the current momentum and volume stay consistent — confirmation on lower time frames will define the strength of the next move.

tradecitypro
تحلیل AAVE: زنگ خطر انفجار قیمت! منتظر شکست خط روند باشید!
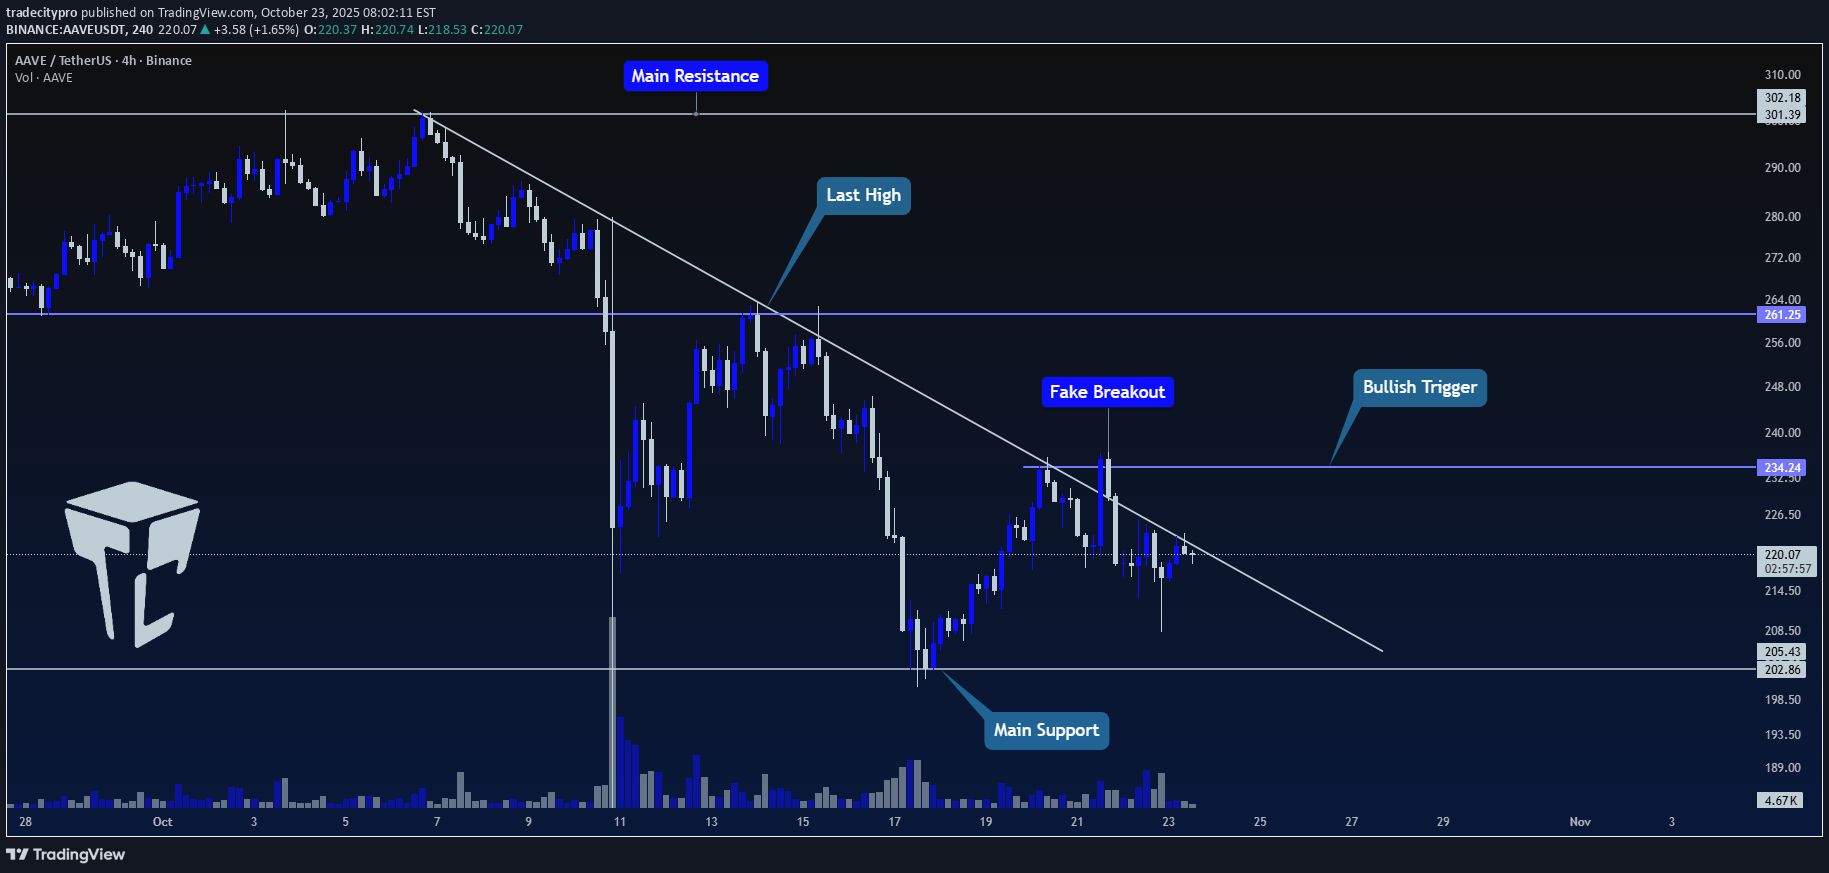
👋 Welcome to TradeCity Pro! In this analysis, I want to review the AAVE coin for you—one of the lending projects in the Ethereum ecosystem, currently ranked 32 on CoinMarketCap with a market cap of $3.36 billion. ⏳ 4H Timeframe On the 4-hour timeframe, this coin started a downtrend after being rejected from the 301.39 zone and, together with a descending trendline, has been moving downward. ✔️ Price has now reached it again, faked it once, and is still ranging around this trendline. ✨ If the trendline is broken and price holds above its trigger, it can begin an upward move. ⚡️ The trigger we have to confirm the start of this move is the 234.24 zone. With the break of this trigger, we can also use it to open a long position. 📊 The next resistance levels this coin has are 261.25 and 302.18, each of which can be used as the next trigger for a long position. 💥 For a short position, the main floor that has formed is 202.86. A break of this level will be a very good trigger for a short position. 📝 Final Thoughts Stay calm, trade wisely, and let's capture the market's best opportunities! This analysis reflects our opinions and is not financial advice. Share your thoughts in the comments, and don’t forget to share this analysis with your friends! ❤️

MyCryptoParadise
احتمال سقوط شدید قیمت آوی (AAVE): آیا آماده ریزش بیشتر هستید؟
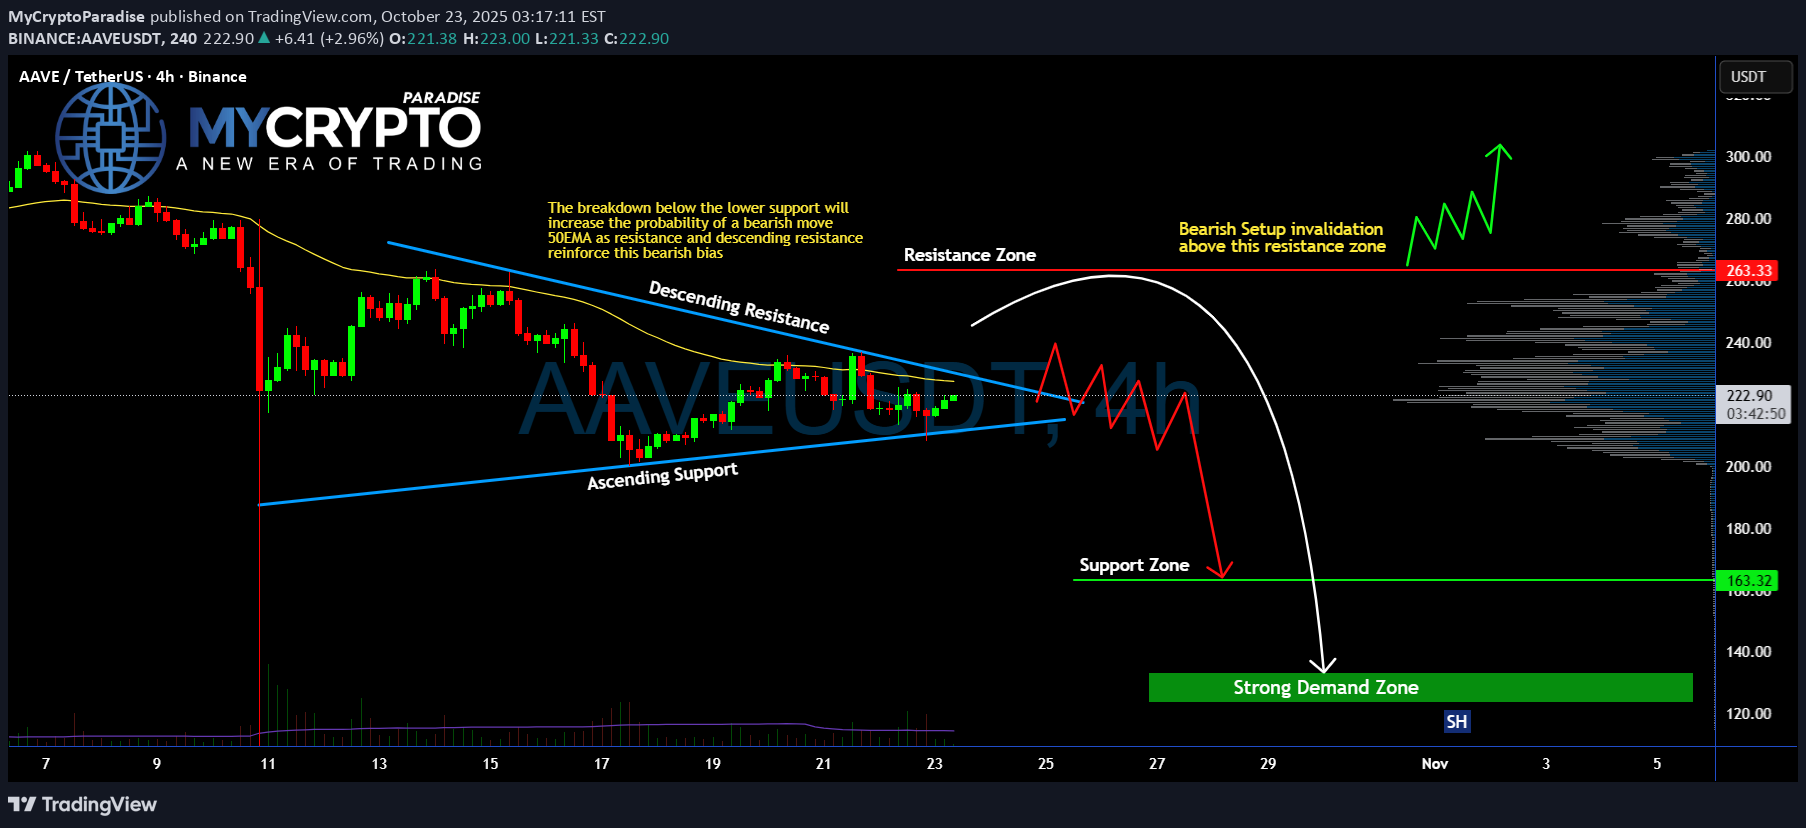
Yello Paradisers! Are you watching what’s unfolding on #AAVEUSDT right now? Because if you’re not, this could catch you completely off guard. There’s a potential bearish breakdown brewing that could send #AAVE into much deeper territory. Let’s dive in before it's too late: 💎#AAVE has been trading inside a symmetrical triangle, caught between a descending resistance and ascending support. Each test of the upper boundary has been weaker, showing fading bullish momentum. Now, we’re pressing against the lower support line with sellers gaining control. 💎The current price is $222, and we’re right on the edge. A confirmed breakdown below the ascending support will flip the entire structure bearish. The 50 EMA is now acting as resistance, reinforcing this downward pressure and aligning with the broader setup. 💎If this bearish scenario confirms, the next downside target becomes the Support Zone around $195–180, but the real liquidity lies deeper. A sharp move could easily send #AAVEUSD into the Strong Demand Zone between $133–123, where we expect stronger buyers to finally show up. 💎However, this setup is invalidated if #AAVE breaks back above the Resistance Zone at $263. That would signal strength and likely trigger a fast bullish reversal targeting higher levels above $280. Trade smart, Paradisers. This setup will reward only the disciplined. MyCryptoParadise iFeel the success🌴

SwallowAcademy
خرید AAVE: منتظر بهترین نقاط ورود با تحلیل دقیق!

AAVE had a solid reaction from the lower support area, where buyers stepped back in and held control. As long as this zone holds, we’re looking at two potential trades — first being the short-term move toward EMAs, and second, a larger continuation setup once a proper market structure break forms. Both setups depend on buyers keeping momentum here, so we’ll stick to the plan and watch how price reacts around the EMAs next. Swallow Academy

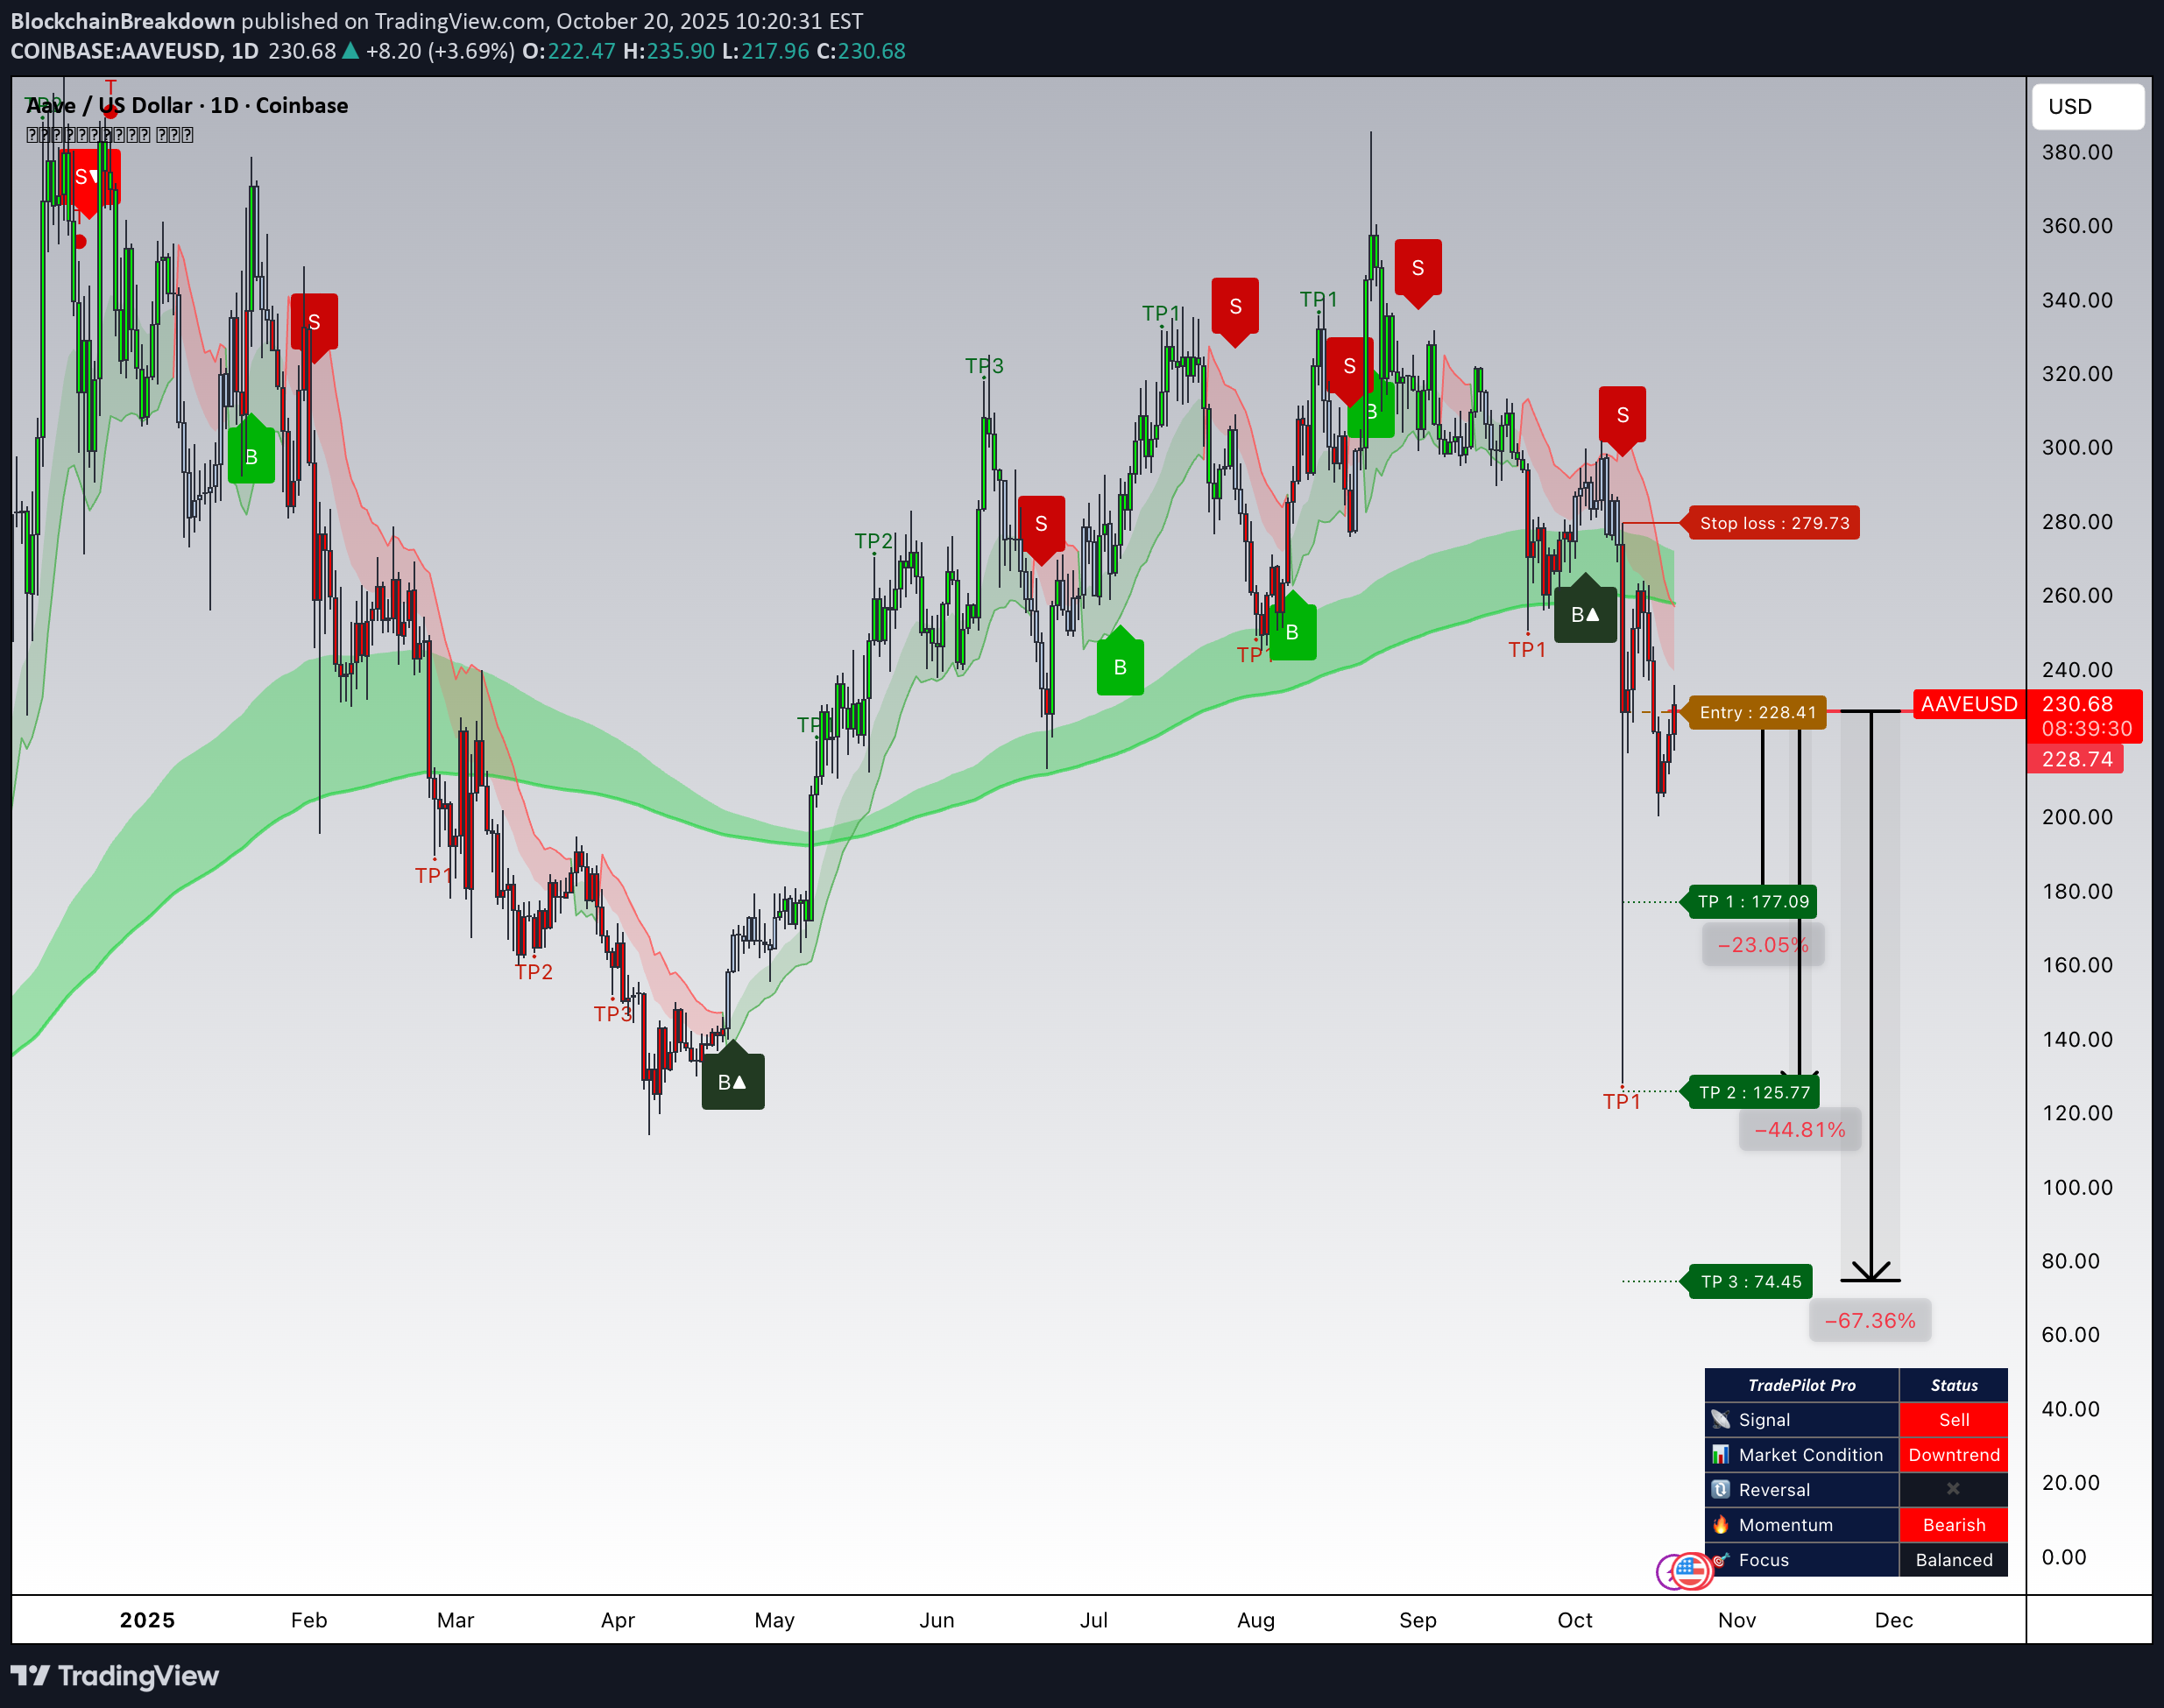
BlockchainBreakdown
تست الگوریتم جدید در جفت ارز AAVE/USD: سیگنالهای متناقض روزانه و 4 ساعته!
Disclaimer
Any content and materials included in Sahmeto's website and official communication channels are a compilation of personal opinions and analyses and are not binding. They do not constitute any recommendation for buying, selling, entering or exiting the stock market and cryptocurrency market. Also, all news and analyses included in the website and channels are merely republished information from official and unofficial domestic and foreign sources, and it is obvious that users of the said content are responsible for following up and ensuring the authenticity and accuracy of the materials. Therefore, while disclaiming responsibility, it is declared that the responsibility for any decision-making, action, and potential profit and loss in the capital market and cryptocurrency market lies with the trader.