
XCH
چیا نتورک
| تریدر | نوع سیگنال | حد سود/ضرر | زمان انتشار | مشاهده پیام |
|---|---|---|---|---|
نتیجه ای یافت نشد. | ||||
نمودار قیمت چیا نتورک
سود ۳ ماهه :
سیگنالهای چیا نتورک
فیلتر
مرتب سازی پیام براساس
نوع پیام
نوع تریدر
فیلتر زمان

grizzle
رمزگشایی حرکتهای نجومی طلا: راز صلیبهای قرمز فراموششده چیست؟
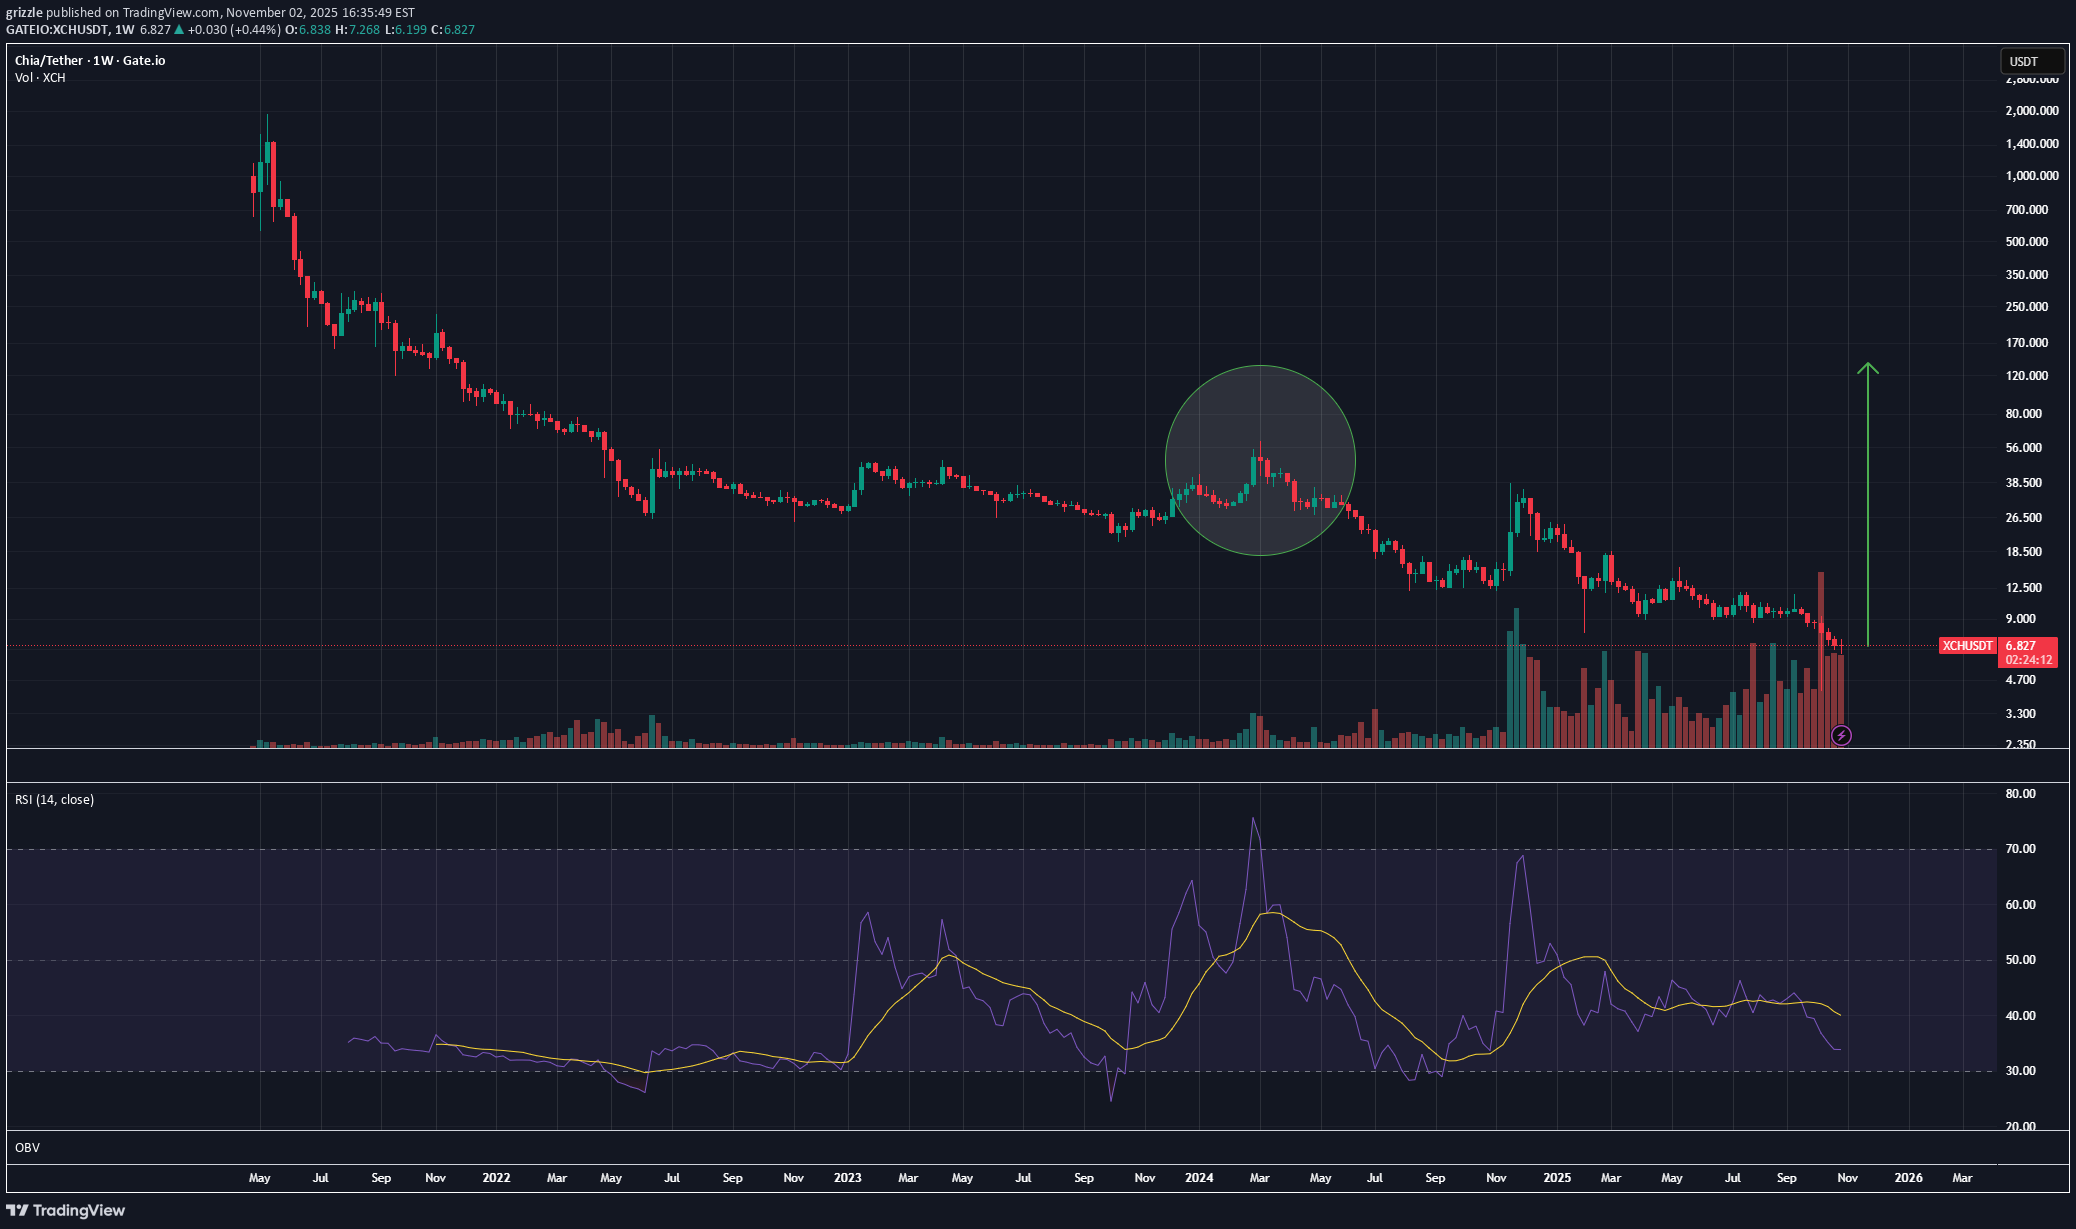
من بازگشت <۰> به این تقاطعهای <۱> (و فراتر از آن) را به کرات مشاهده میکنم. دقیقاً مطمئن نیستم که این الگو چیست و اشکال هندسی زیادی در اینجا ترسیم نکردهام، اما از همین روش برای پیشبینی جهشهای نجومی طلا (GOLD) و چند دارایی دیگر استفاده کردم. نظر شما چیست؟

SpartaBTC
XCH Secondary Trend 11 05 2025

لگاریتم بازه زمانی 3 روز. دارایی در حال مرگ که "ایمان فرقه ها" و در نتیجه نقدینگی را از دست می دهد. پیش از این ، بازاریابی تهاجمی و فریب فعال وبلاگ نویسان ، با قیمت های بسیار بالا پس از لیست وجود داشت. از حداکثر ، یعنی لیست ، کاهش -97 ٪. بنابراین ، هنگام تجارت چنین ، خطرات را کنترل کنید. روند اصلی اکنون در حال حاضر است. پس از پمپ +140 ٪ ، پایین super این رمزنگاری کم مایع دوباره به روز شد. در حال حاضر با -38 ٪ به فشار توجه کنید (در بازار ادغام شده ، بدون نقدینگی ، قیمت کاهش یافته است). اکنون منطقه وارونگی دیگری است. درصد محلی نشان داده شده است. با افت بازار ، نقدینگی پایین در حال حاضر کاهش ٪ بالایی را کاهش می دهد ، به همین ترتیب ، این قانون در جهت مخالف کار می کند. هنگام کار با چنین ارزهای رمزنگاری از نظر نقدینگی ، به یاد داشته باشید که اینها دارایی های "در حال مرگ" هستند ، بنابراین ، خطرات را کنترل کرده و اهداف کافی را تعیین می کنند.

Zorroreny
XCH - reversal incoming

اصلاح پیچیده XCH در حال اتمام است، جایی که هنوز منتظر یک افت نهایی - درست زیر آخرین سایه شمعی هستم. منطقه اشباع فروش داریم، واگرایی صعودی و الگویی مشابه AIOZ مشاهده میشود. انتظار دارم روند معکوس شود و به سمت بالا حرکت کنیم تا محدوده فیبوناچی ۰.۶۱۸ را تست کنیم و پس از آن یک اصلاح بزرگتر رخ دهد. اهداف بالاتر تنها زمانی فعال میشوند که بتوانیم محدوده حمایت/مقاومت فیبوناچی ۰.۳۸۲ را به حمایت تبدیل کنیم.


Nyskohuz
XCH/USDT 1W

🩸 XCH ⁀➷ #chia نمودار کلان دیگری 💯 هدف میانی - 65 دلار 🚩 هدف کلان 1 - 94 دلار 🚩 هدف ماکرو 2 - 153 دلار 🚩 هدف کلان 3 - 236 دلار - نه مشاوره مالی ، تجارت با احتیاط. #crypto #chianetwork #XCH #سرمایه گذاری on در اخبار بازار و پیشرفت هایی که ممکن است بر قیمت chianetwork تأثیر بگذارد ، به روز شوید. اخبار مثبت یا منفی می تواند به طور قابل توجهی بر ارزش رمزنگاری تأثیر بگذارد. ✅ هنگام اجرای برنامه معاملاتی خود ، صبر و نظم را اعمال کنید. از تصمیم گیری های تحریک آمیز ناشی از احساسات خودداری کنید و حتی در دوره های نوسانات بازار به استراتژی خود پایبند باشید. ✅ به یاد داشته باشید که تجارت همیشه شامل ریسک است و هیچ تضمینی برای سود وجود ندارد. تحقیقات کامل را انجام دهید ، شرایط بازار را تجزیه و تحلیل کنید و برای سناریوهای مختلف آماده شوید. تجارت فقط با بودجه ای که می توانید از دست بدهید و از ریسک بیش از حد جلوگیری کنید.

WaveRiders2
$XCH ANALYSIS!

XCH در حال آزمایش منطقه مقاومت قرمز است. اگر شکست موفقیت آمیز باشد ، اولین هدف سطح خط سبز است.

SHARK1318
XCH new wave

دیدگاه من در مورد مدل موج برای این دارایی و هدف آن ارائه شده است. چرخه نزول در 5 دقیقه به پایان رسید و موجی از رشد جهانی آغاز می شود که به شدت تکانشی و با دامنه بالا بود. دارایی Frome USA


جفت معاملاتی XCH/USD در Crypto.com فعالیت نزولی قابل توجهی را در نمودارهای روزانه و هفتگی نشان داده است که نشان دهنده یک روند نزولی بالقوه بلندمدت است. پس از رسیدن به اوج در 5 مارس 2024، این جفت ارز نزولی پیوسته را آغاز کرد و در نهایت در 21 نوامبر 2024 به بالاترین حد خود رسید و احساسات نزولی را تقویت کرد. در حال حاضر، قیمت در 18.978 دلار قرار دارد و منعکس کننده یک مسیر نزولی است که با روند گسترده تر شاخصهای فنی حاکی از فقدان حرکت صعودی است، به طوری که اوجها و پایینهای پایینتر بر نمودار غالب هستند. این الگو حاکی از ادامه روند نزولی فعلی است و هرگونه تغییرات غیرمنتظره بازار یا عوامل خارجی را ممنوع می کند. با توجه به پویایی بازار فعلی، کاهش بیشتر قیمت محتمل به نظر می رسد. پیشبینی من قیمت XCH/USD را تا 3 ژوئیه 2025 در 4.490 دلار قرار میدهد. این پیشبینی بر اساس تداوم احساسات نزولی و عدم وجود سیگنالهای معکوس قابلتوجه در بازههای زمانی روزانه یا هفتگی است. سطوح کلیدی برای WatchResistance: جدیدترین پایینتر بالاترین سطح از نوامبر 2024 ممکن است act به عنوان یک سطح مقاومت قابل توجه باشد. پشتیبانی: سطح روانی 10.00 دلار می تواند قبل از کاهش احتمالی بیشتر، پشتیبانی موقتی را ارائه کند. افکار نهایی معامله گران XCH/USD باید احتیاط کنند و این چشم انداز نزولی را هنگام برنامه ریزی معاملات خود در نظر بگیرند. مثل همیشه، مطلع ماندن و تجزیه و تحلیل منابع متعدد data برای پیمایش بازارهای بی ثبات ارزهای دیجیتال بسیار مهم است.

Skyrexio
Chia Network XCH Is Ready For Altseason!

سلام، Skyrexians! در حالی که آلتکوین ها هنوز در حال اصلاح هستند و ما فرصت های خرید عالی را داریم، به مشاهده آلت کوین ها ant اهداف آنها برای اجرای صعودی ادامه می دهیم. امروز XCHUSDT را برای تجزیه و تحلیل داریم. من می دانم که اکثر مردم از این سکه به دلیل زباله دائمی آن متنفرند. امروز سعی کرد بفهمیم که آیا دارندگان چیا فرصتی برای دیدن نقطه سربهسر یا سود سرمایهگذاری خود دارند یا خیر. بیایید نگاهی به بازه زمانی هفتگی بیاندازیم. این سکه قطعا در روند نزولی قرار دارد و ما نمی توانیم منتظر ATH جدید باشیم. حرکت رو به پایین دارای ساختار واضح 5 Elliott waves است که احتمالاً قبلاً تمام شده است. نشانگر سبز dot در پایین برای معکوس صعودی/نزولی Bar [Skyrexio] قوی ترین تایید برای شروع روند صعودی است. مانند همیشه، هشدارهای این نشانگر به طور خودکار در حساب های من تکرار می شود. شما می توانید اطلاعات را در مقاله ما در TradingView بیابید. هدف برای روند صعودی منطقه بین فیبوناچی 0.5 و 0.61 در 200 و 340 دلار است. این سکه روند نزولی جهانی است، بنابراین ما انتظار داریم که پس از رسیدن به این هدف در طول فصل آلت فصل به پایین ترین حد خود برسد. با احترام، تیم Skyrexio______________________________________________________ لطفاً، این مقاله را تقویت کنید و اگر تجزیه و تحلیل را دوست دارید، صفحه ما را مشترک کنید!

MISANTHROPE3
Good days are coming up for CHIA

نمودار واضح است. خرید در خط سبز تیره فروش در نقطه مشخص شده سپس منتظر نقطه ورود بعدی که خط سبز روشن است، خرید و HODL. من پس از عقب نشینی قیمت به آن جعبه با خط قرمز به روز رسانی می کنم. جدا از همه این چیا پروژه خوبی است و ممکن است آینده روشنی در پیش داشته باشد، بنابراین من آن را توصیه می کنم. 💚🌱🚀
سلب مسئولیت
هر محتوا و مطالب مندرج در سایت و کانالهای رسمی ارتباطی سهمتو، جمعبندی نظرات و تحلیلهای شخصی و غیر تعهد آور بوده و هیچگونه توصیهای مبنی بر خرید، فروش، ورود و یا خروج از بازارهای مالی نمی باشد. همچنین کلیه اخبار و تحلیلهای مندرج در سایت و کانالها، صرفا بازنشر اطلاعات از منابع رسمی و غیر رسمی داخلی و خارجی است و بدیهی است استفاده کنندگان محتوای مذکور، مسئول پیگیری و حصول اطمینان از اصالت و درستی مطالب هستند. از این رو ضمن سلب مسئولیت اعلام میدارد مسئولیت هرنوع تصمیم گیری و اقدام و سود و زیان احتمالی در بازار سرمایه و ارز دیجیتال، با شخص معامله گر است.