
MOCA
موکا نتورک
| تریدر | نوع سیگنال | حد سود/ضرر | زمان انتشار | مشاهده پیام |
|---|---|---|---|---|
نتیجه ای یافت نشد. | ||||
نمودار قیمت موکا نتورک
سود ۳ ماهه :
سیگنالهای موکا نتورک
فیلتر
مرتب سازی پیام براساس
نوع پیام
نوع تریدر
فیلتر زمان

behdark
MOCA Looks Bullish (4H)
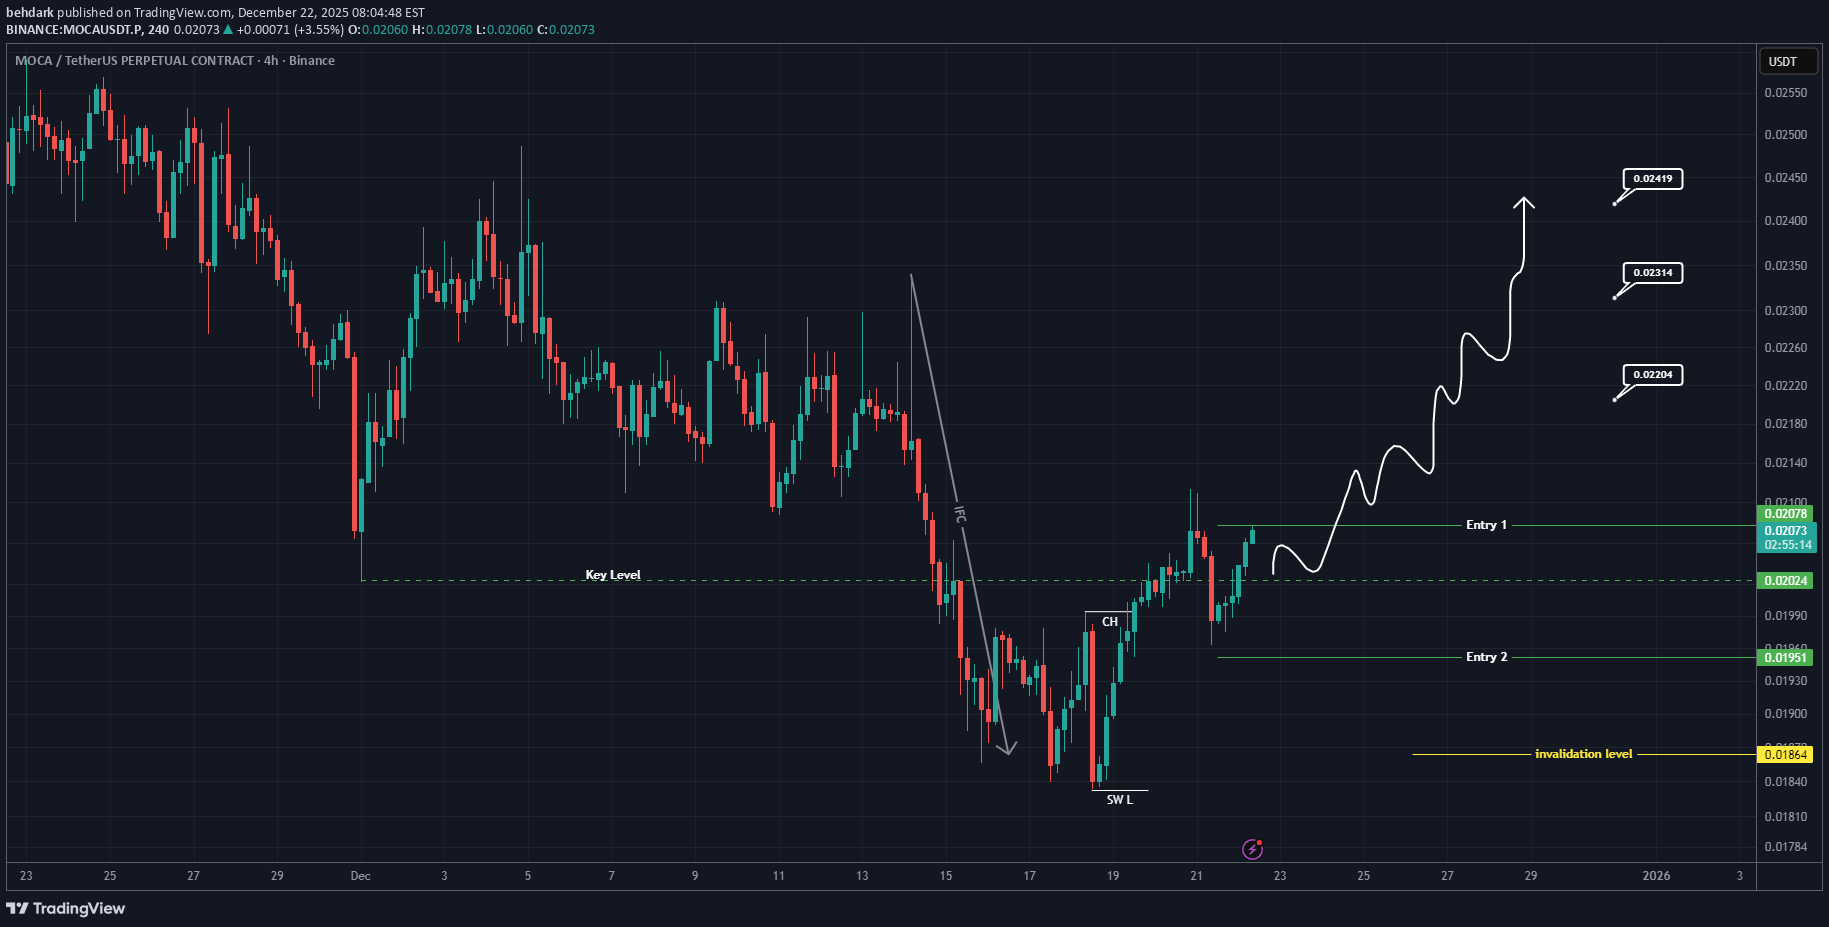
با توجه به اینکه سطح کلیدی را پس گرفته است، CH صعودی را در نمودار تشکیل داده است و عرضه قابل توجهی نزدیک به قیمت فعلی وجود ندارد، میتوانیم موقعیت خرید/لنگ را در MOCA در نظر بگیریم. We have two entry points where you should enter using DCA, and the targets are marked on the chart. بستن شمع 4 ساعته زیر سطح بی اعتباری این تحلیل را باطل می کند. برای مدیریت ریسک، لطفا توقف ضرر و مدیریت سرمایه را فراموش نکنید هنگامی که به اولین هدف رسیدیم، مقداری سود ذخیره کنید و سپس توقف را به ورودی تغییر دهید اگر سوالی دارید کامنت کنید Thank YouAfter hitting the entry zone, price pumped 10% from our average entry, and the first target was hit

DefiWolf
MOCA Trade Setup – Eyeing 0.16–0.17 Target Zone
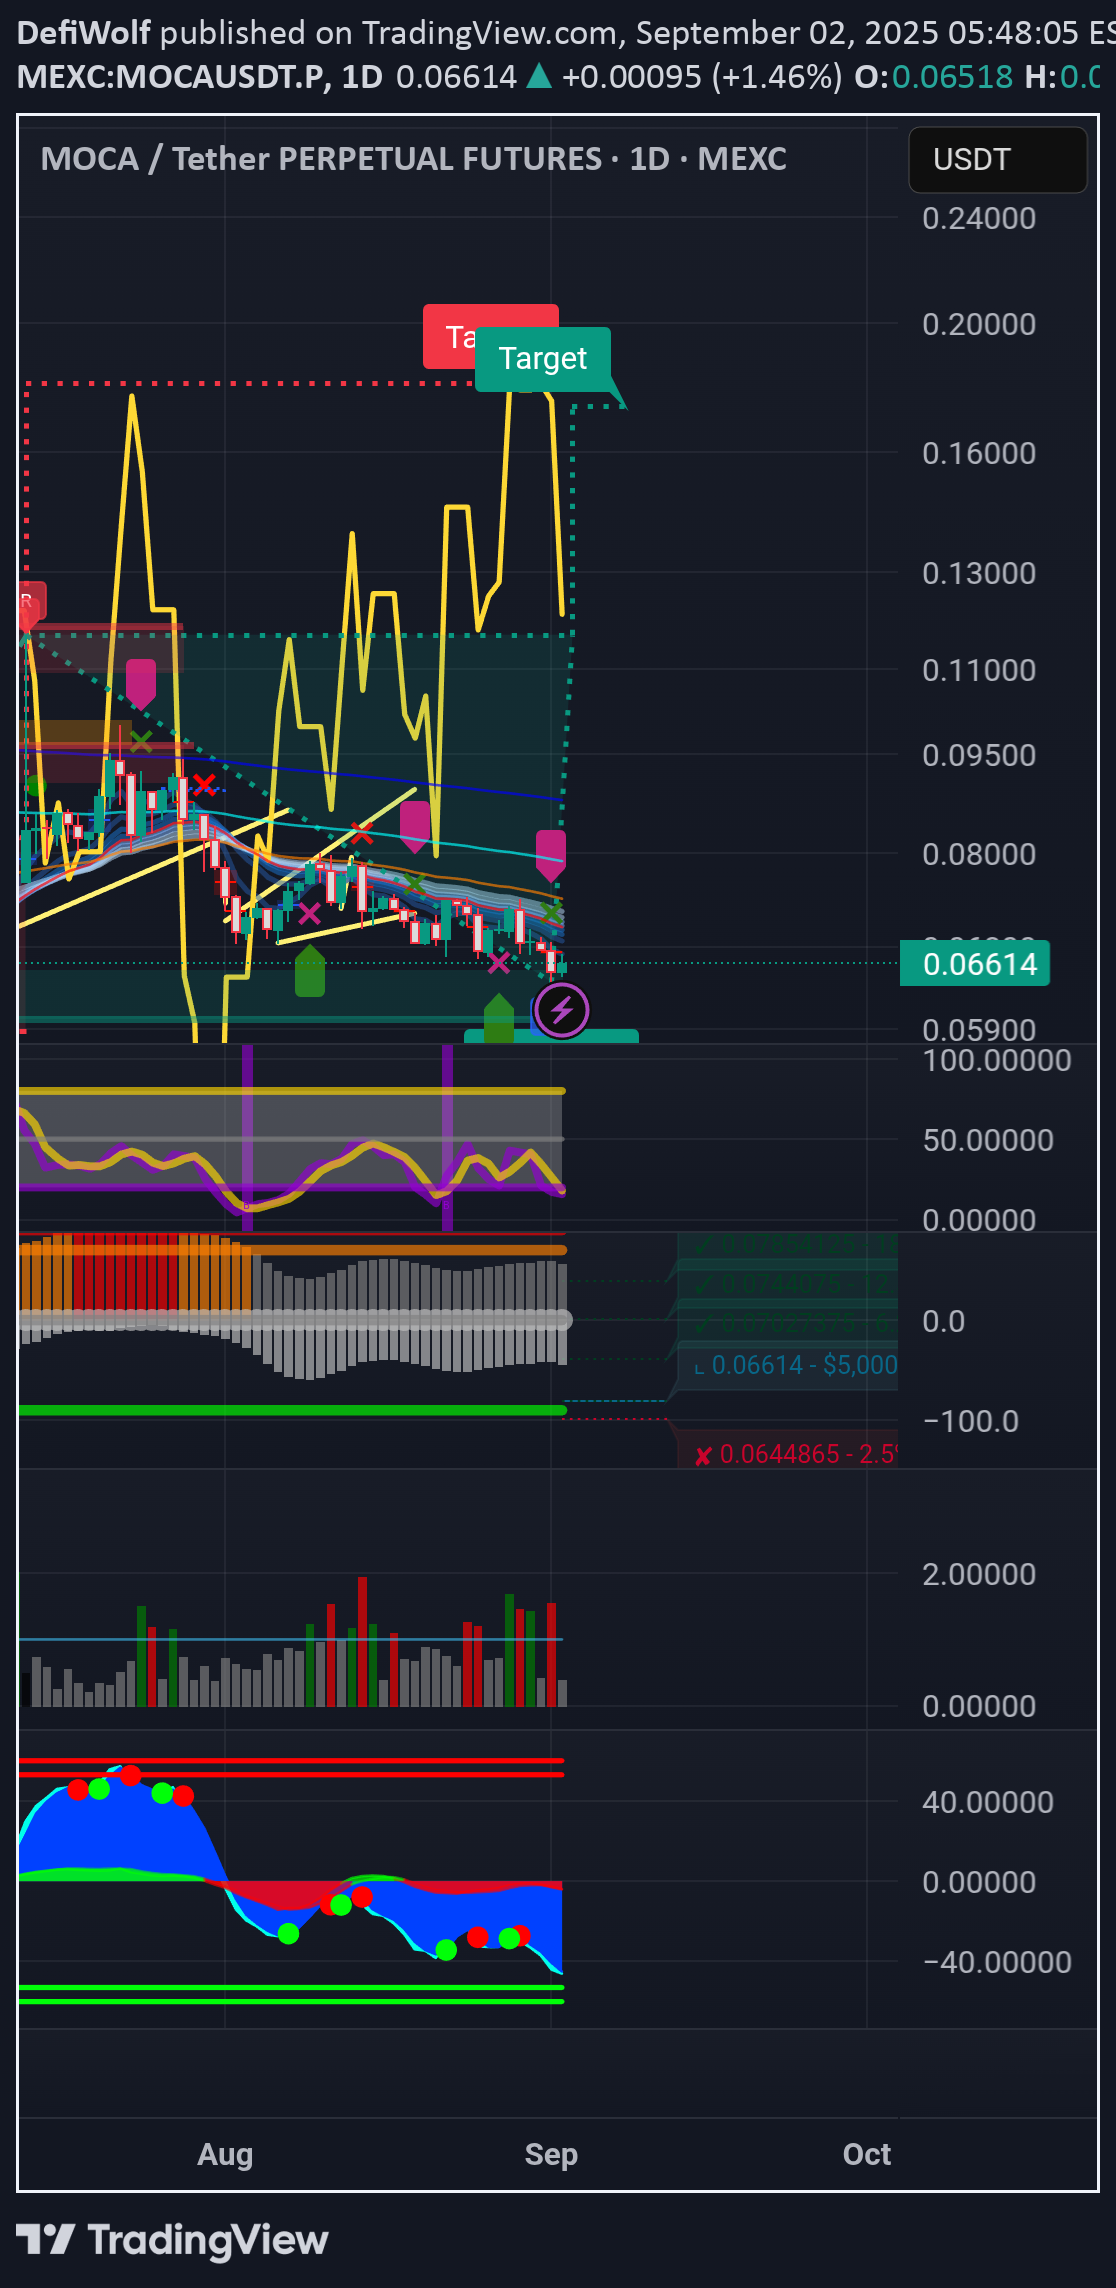
با نگاهی به نمودار روزانه معاملات آتی دائمی MOCA/USDT، ساختار برای یک move میانمدت بالقوه آماده میشود که میتواند بسیاری از کسانی را که هنوز بر محدوده فعلی متمرکز هستند شگفتزده کند. 🔍 تحلیل فنی ۱. ناحیه حمایت و انباشت قیمت در حدود ۰.۰۶۶ دلار تثبیت میشود، با نشانههای قوی انباشت که در حجم معاملات قابل مشاهده است. سایههای پایینی در حدود ۰.۰۶۴–۰.۰۶۶ دلار نشان میدهد که خریداران برای دفاع از این ناحیه وارد عمل میشوند. ۲. اندیکاتورها علامت معکوس شدن میدهند Stoch RSI از منطقه اشباع فروش در حال برگشت است، که اغلب پیشدرآمد حرکات انفجاری است. نوسانگرهای مومنتوم، واگرایی صعودی را در حالی نشان میدهند که قیمت در حمایت تثبیت میشود. هیستوگرام روزانه و اندیکاتورهای موج در حال مسطح شدن هستند و نشان دهنده خستگی فروشندگان هستند. ۳. سطوح کلیدی برای تماشا مقاومت فوری: ۰.۰۷۵–۰.۰۹ دلار (منطقه فشار کوتاهمدت). هدف میانمدت: ۰.۱۱–۰.۱۳ دلار (عرضه تاریخی). هدف Major: ۰.۱۶–۰.۱۷ دلار (پیشبینی move اندازهگیری شده و خوشه مقاومت قبلی). 📈 سناریوی صعودی اگر MOCA بتواند با قاطعیت بالاتر از محدوده ۰.۰۷۵–۰.۰۸ دلار بسته شود، معاملهگران مومنتوم و الگوریتمها میتوانند باعث شکست به سمت منطقه ۰.۱۱–۰.۱۳ دلار شوند. هنگامی که بالاتر از ۰.۱۳ دلار قرار گرفت، مسیر به سمت منطقه هدف کلان ۰.۱۶–۰.۱۷ دلار باز میشود، که نشاندهنده بیش از ۲.۵ x صعودی از سطوح فعلی است. ⚠️ مدیریت ریسک در صورتی که MOCA بشکند و زیر حمایت ۰.۰۶۴ دلار تثبیت شود، این تحلیل نامعتبر بود. معاملهگران اهرمی باید نرخهای تامین مالی را زیر نظر داشته باشند، زیرا افزایش ناگهانی ممکن است نشان دهنده ازدحام بیش از حد باشد. کاهش تدریجی سود در ۰.۱۱، ۰.۱۳ و هدف نهایی ۰.۱۶–۰.۱۷ دلار محتاطانه است. 🧭 جمعبندی نهایی MOCA در یک نقطه محوری قرار دارد: انباشت نزدیک به کفها با اندیکاتورهای فنی که نشاندهنده یک معکوس صعودی هستند. صبر کلیدی بود، اما اگر مومنتوم تغییر کند، این تنظیم پتانسیل سوار شدن بر یک موج قوی تا ۰.۱۶–۰.۱۷ در جلسات آینده را دارد.

AkinC
#Moca usdt $Moca
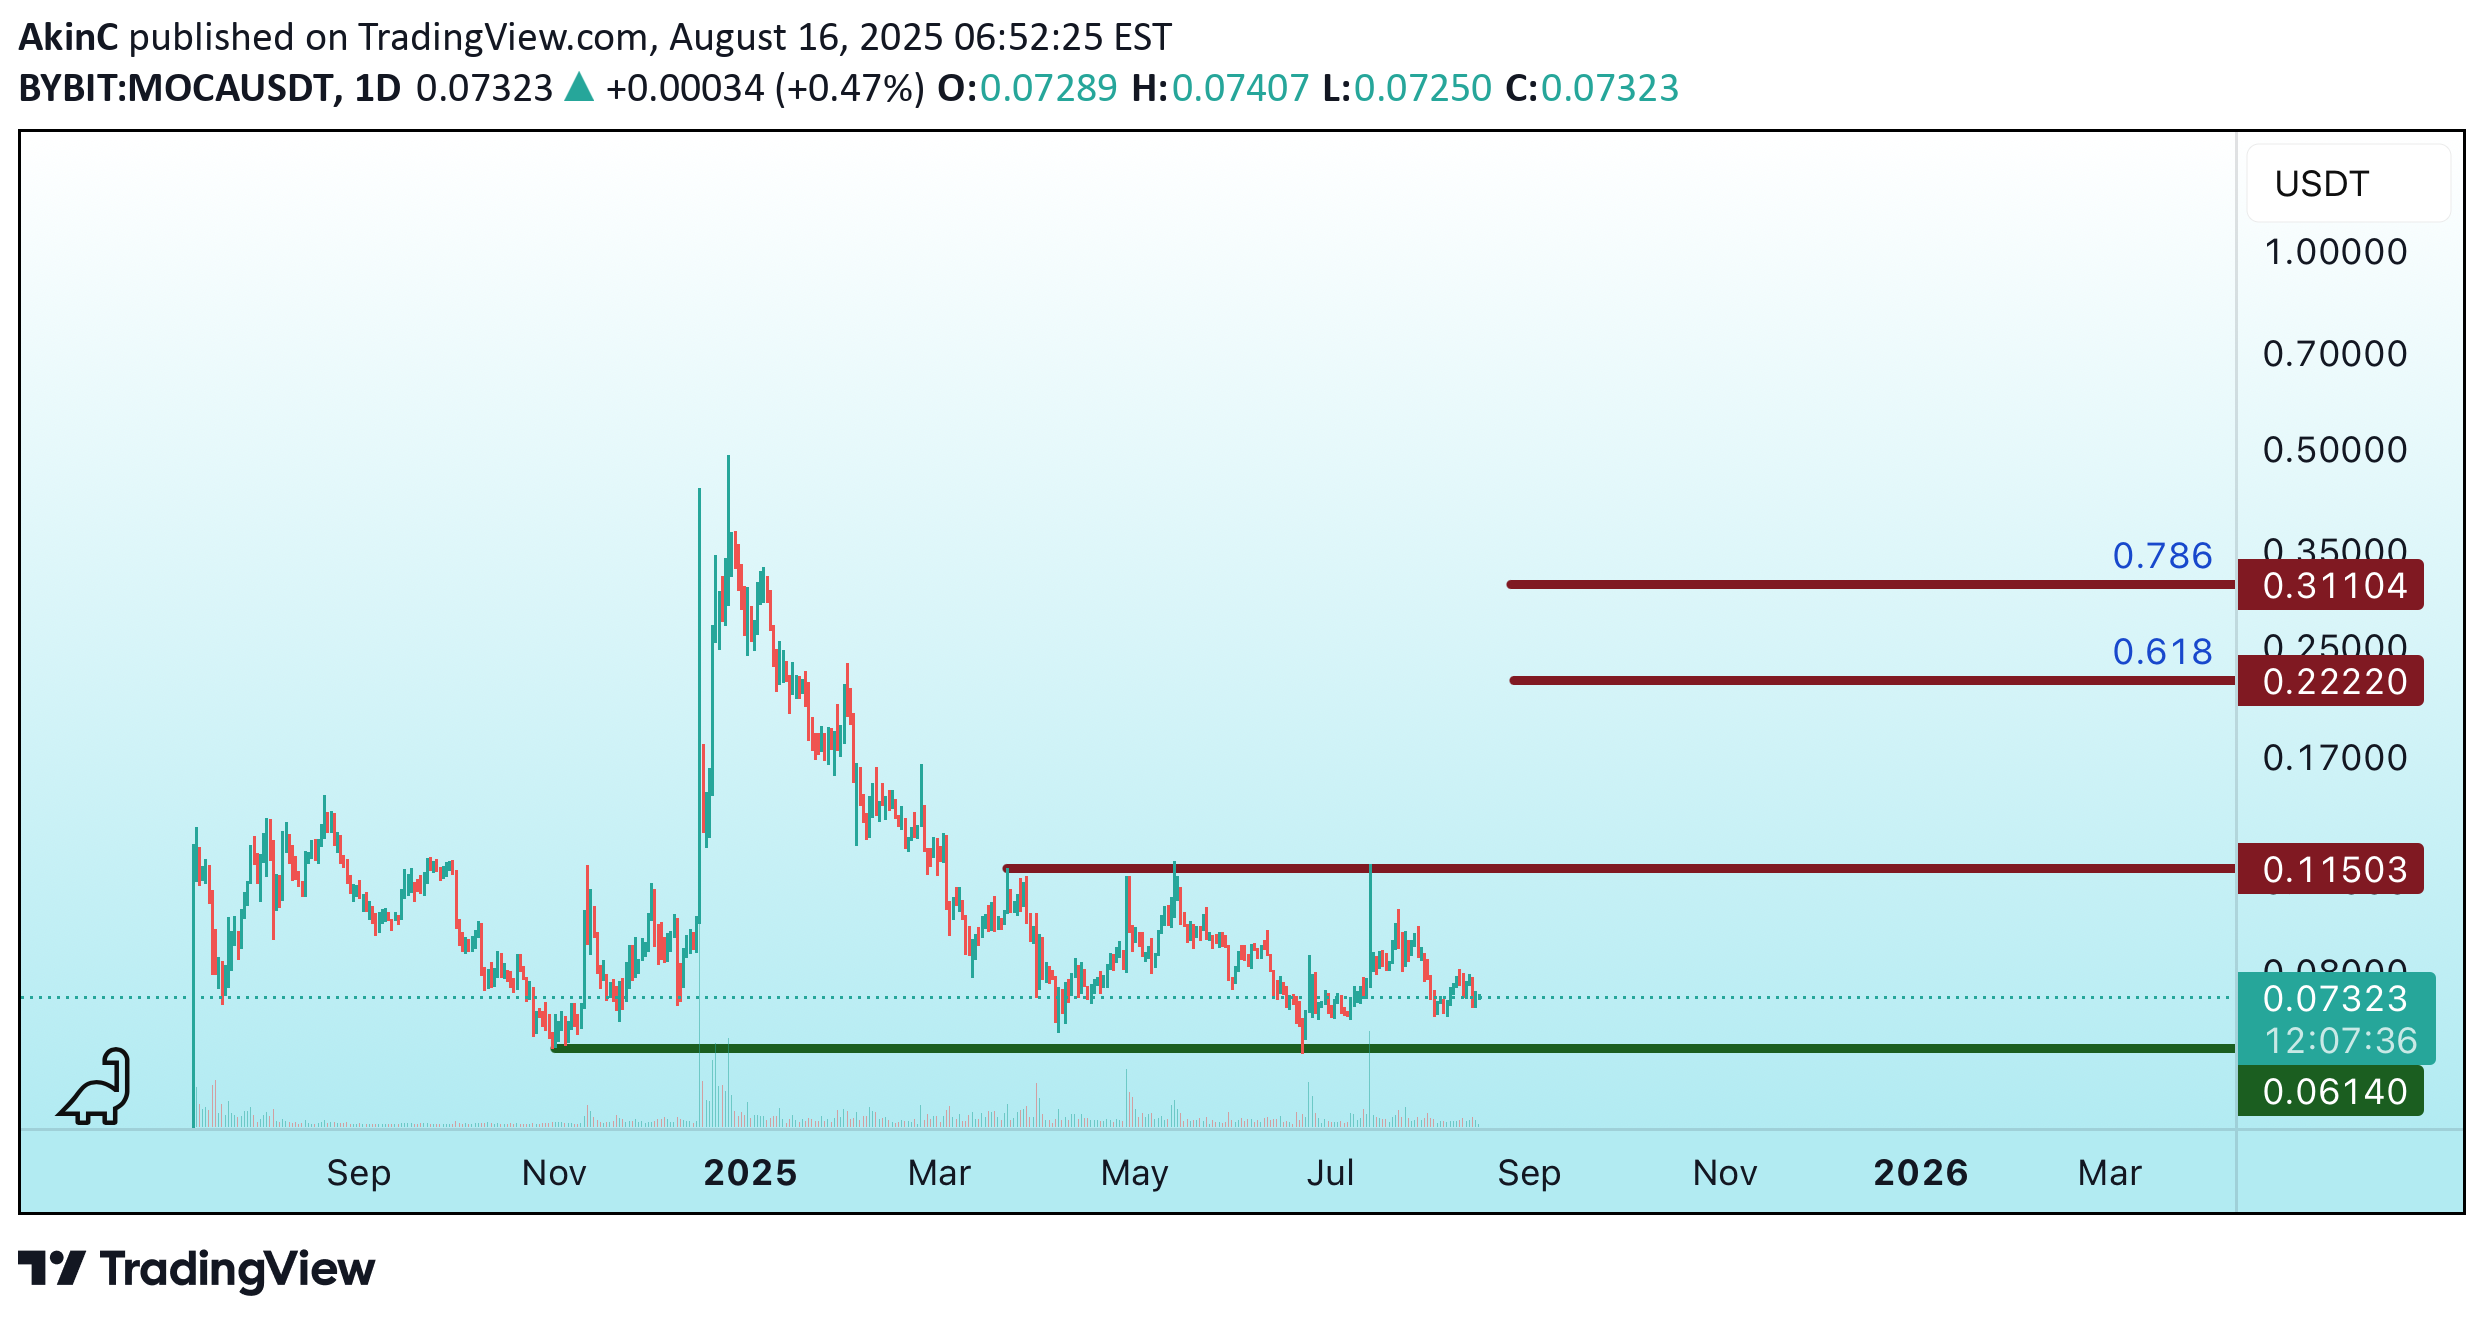
حمایت مهم: ۰.۰۶۱۴ دلار مقاومت مهم: ۰.۱۱۵ دلار اگر کندل بالاتر از مقاومت مهم بسته شود، اهداف متوالی عبارتند از: هدف ۱: ۰.۲۲۲ دلار هدف ۲: ۰.۳۱۱ دلار

brandlabelden
MOCAUSDT: Oversold, Yet Ready to Explode? The Market Decides!

Is the Bottom In? MOCAUSDT Flashes Buy Signals! The crypto market never sleeps, and neither do opportunities. MOCAUSDT is currently hovering at $0.18582, down a staggering 62% from its all-time high of $0.48845 recorded just 39 days ago. But is this decline setting the stage for a major comeback? Technical indicators suggest we are at a make-or-break moment. The RSI14 is at 33.2, approaching oversold territory, while MFI60 sits at 43.8, indicating potential buying momentum. Moreover, the price is struggling near the 200 MA (0.18844), a critical level that could dictate the next major move. Interestingly, a series of VSA Buy Patterns have emerged over the past 48 hours, hinting at accumulation by smart money. Will this trigger the much-anticipated breakout, or is another dip inevitable? One thing is certain—the next move will be decisive. Are you ready to take advantage of it? MOCAUSDT Roadmap: Smart Money Moves and Key Market Reversals Understanding the market is all about catching the right waves at the right time. Let’s break down how MOCAUSDT moved recently, which patterns played out, and what traders can learn from these price shifts. * January 29: VSA Buy Pattern 3 – The market showed signs of a manipulation buy, signaling the start of an upward move from $0.17241 to $0.1772. This pattern was validated as price continued rising, confirming the bulls were stepping in. * January 30: Buy Volumes Max → Sell Volumes – A massive buying volume spike from $0.17809 pushed the price up to $0.19745, but sellers quickly took control, leading to a sharp reversal. This switch from buy to sell dominance marked a critical liquidity grab before the next wave. * January 31: VSA Sell Pattern 1 & 3 – A textbook manipulation sell setup, where price hit $0.22752 before retracing. This was the first major rejection confirming that the bullish move had peaked. Following this, VSA Buy Pattern Extra 2nd appeared at a lower price point, signaling accumulation near $0.20923. * February 1: VSA Manipulation Buy Pattern 4th – Smart money stepped back in, sending the price higher from $0.19388 to $0.19525, reinforcing the long bias. The key takeaway? Every strong dip in this cycle was met with aggressive buybacks. * February 2: VSA Buy Pattern Extra 2nd – The latest signal showed another attempt at accumulation, with price stabilizing around $0.18867. However, the move lacked the aggressive momentum seen in previous buy setups, meaning traders should watch for confirmations before jumping in. Conclusion: Reading the Tape MOCAUSDT has been in a highly reactive accumulation-distribution cycle, where every liquidity grab led to a strong price reaction. The roadmap suggests smart money is accumulating, but not in a rush to push the price up aggressively. For traders, the key levels to watch are whether buyers step in at the recent $0.185 range, or if we see another liquidity grab before the real move. Are we gearing up for a breakout, or is another shakeout on the horizon? Stay sharp, and trade smart. Technical & Price Action Analysis: Key Levels to Watch MOCAUSDT is playing the range game, bouncing between key levels. Here’s what traders need to keep on their radar: Support Levels: * 0.17241 – If buyers don’t defend this level, expect it to flip into resistance, trapping late longs. * 0.16567 – A critical retest zone; failure to hold means lower bids will get tested. * 0.16455 – The last line of defense before deeper corrections. Resistance Levels: * 0.25966 – The first real battle for bulls; if price rejects, expect a fade back into the range. * 0.2951 – Major liquidity zone; breaking above could trigger a trend shift. * 0.31409 – If bulls clear this, game on for the next leg up. Powerful Support Levels: * 0.2371 – Big money has been watching this level. If it doesn’t hold, sellers will start dictating the trend. Powerful Resistance Levels: * 0.08949 & 0.06603 – Levels that could cap any weak breakouts. If price stalls here, expect consolidation or a fakeout before the next real move. Trade Logic: If support levels don’t hold, they flip into resistance, and every failed breakout becomes a new short opportunity. The market isn’t giving out free money—trade smart, wait for confirmations, and don’t get caught chasing weak moves. Trading Strategies Using Rays: Navigating MOCAUSDT Moves with Precision The market moves in waves, but instead of relying on static levels, we focus on Fibonacci Rays—dynamic price structures that outline the natural rhythm of movements. These rays, based on mathematical and geometric principles, give us a predictive roadmap where price reacts, either bouncing or breaking through. Key takeaway? Trade after price interacts with a ray and confirms direction. The movement will continue from one ray to the next, forming the key targets of our trade. Optimistic Scenario: Bulls Take Control If buyers step in at key Fibonacci ray intersections, we can expect a continuation to higher levels. The first confirmation will be the price breaking above MA200 (0.18844) and staying above. Entry: Buy after price interacts with a ray at 0.17241, forming a reversal. First target: 0.2371 – The next ray and powerful support turned resistance. Second target: 0.25966 – A strong resistance level where a pullback could occur. Final bullish target: 0.2951 – If momentum stays strong, this is the next major liquidity grab zone. Pessimistic Scenario: Sellers in Control If the price fails to hold MA200 (0.18844) and breaks below Fibonacci rays, expect a move lower to the next liquidity zone. Entry: Sell after rejection at 0.18844 if price fails to reclaim it. First target: 0.17241 – The closest ray where buyers might step in. Second target: 0.16567 – If weakness persists, this is the next stop. Final bearish target: 0.16455 – The ultimate support before deeper losses. Trade Ideas: Key Setups to Watch Ray-to-Ray Bullish Breakout: Buy above 0.18844, target 0.2371, stop-loss below 0.17241. Ray-to-Ray Bearish Breakdown: Sell below 0.18844, target 0.17241, stop-loss above 0.19525. Range Rebound Trade: Buy near 0.17241, take profits at 0.18844, stop-loss below 0.16567. Momentum Scalping: If price bounces at 0.2371, buy and target 0.25966, stop-loss below 0.225. All these setups are backed by VSA rays, which are already plotted on the chart—so stay patient, wait for interaction, and ride the move from ray to ray. Your Move, Traders! 🚀 That’s the full breakdown—now it’s your turn! Got questions? Drop them right in the comments below, and let’s discuss the best trading setups together. If you found this analysis useful, hit Boost and save this idea—you’ll want to check back and see how price respects these rays. Trading isn’t about guessing, it’s about understanding key reaction points, and now you have them. My private strategy automatically plots all rays and levels, making trade setups clear and structured. If you’re interested in using it, shoot me a private message—it’s exclusive, but we can discuss how you can get access. Need analysis on a different asset? I can chart any market with precision. Some ideas I share for free, while others can be done privately—depends on what you need. Let me know in the comments which asset you want covered next, and if there’s enough interest, I’ll make it happen! And of course, if you’re serious about trading—follow me on TradingView. That’s where all the real-time updates and insights go first. See you in the next one! 🔥

kozalakfirat
Mocausdt
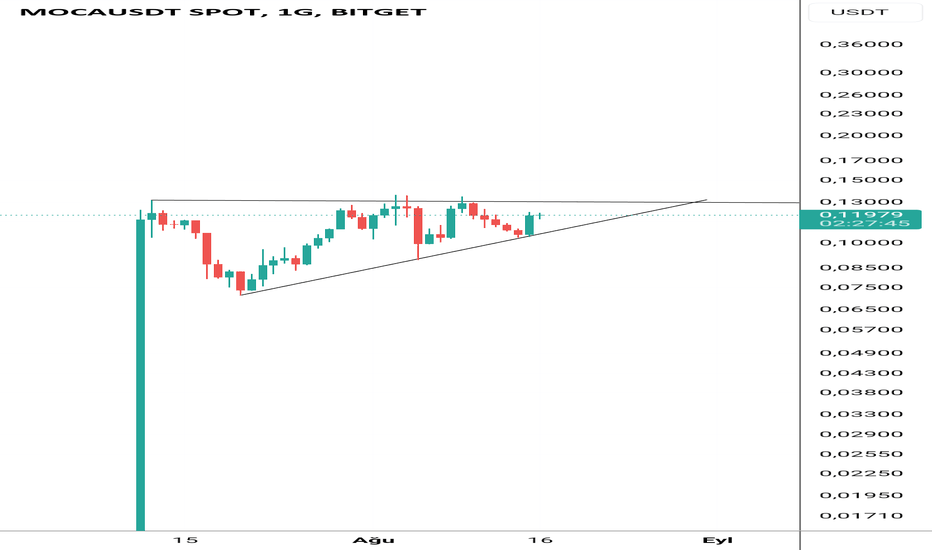
همه چیز برای استراحت آماده من آماده است. اگر قرار است این سرمایه گذاری باشد ، این سرمایه گذاری لزوماً یک محقق نیست ، ایده این است که آلودگی و بسته شدن روز وجود دارد.
سلب مسئولیت
هر محتوا و مطالب مندرج در سایت و کانالهای رسمی ارتباطی سهمتو، جمعبندی نظرات و تحلیلهای شخصی و غیر تعهد آور بوده و هیچگونه توصیهای مبنی بر خرید، فروش، ورود و یا خروج از بازارهای مالی نمی باشد. همچنین کلیه اخبار و تحلیلهای مندرج در سایت و کانالها، صرفا بازنشر اطلاعات از منابع رسمی و غیر رسمی داخلی و خارجی است و بدیهی است استفاده کنندگان محتوای مذکور، مسئول پیگیری و حصول اطمینان از اصالت و درستی مطالب هستند. از این رو ضمن سلب مسئولیت اعلام میدارد مسئولیت هرنوع تصمیم گیری و اقدام و سود و زیان احتمالی در بازار سرمایه و ارز دیجیتال، با شخص معامله گر است.