
GOOGLX
گوگل
| تریدر | نوع سیگنال | حد سود/ضرر | زمان انتشار | مشاهده پیام |
|---|---|---|---|---|
 EPSMomentumرتبه: 1024 | خرید | حد سود: تعیین نشده حد ضرر: تعیین نشده | ۱۴۰۴/۸/۱۵ | |
 TopgOptionsرتبه: 167 | خرید | حد سود: تعیین نشده حد ضرر: تعیین نشده | ۱۴۰۴/۸/۷ |
نمودار قیمت گوگل
سود ۳ ماهه :
سیگنالهای گوگل
فیلتر
مرتب سازی پیام براساس
نوع پیام
نوع تریدر
فیلتر زمان

تحلیل جامع: روندهای اصلی بیت کوین، اتریوم و استیبل کوینها در بازار کریپتو
1. Bitcoin Trends Bitcoin (BTC), the world’s first and most widely recognized cryptocurrency, remains the benchmark for the entire digital asset market. Several recent trends shape its behavior: A. Institutional Adoption Accelerates Institutional involvement has grown consistently, driven by exchange-traded products, corporate investments, and hedge funds using Bitcoin as an alternative asset. The approval of spot Bitcoin ETFs in major economies (primarily the US and a growing list of other countries) has created new channels of capital inflow. These funds have attracted billions of dollars in assets under management, making Bitcoin more accessible to traditional investors. B. Bitcoin as a Macro-Driven Asset Bitcoin is increasingly treated like a risk-on macro asset influenced by: Global interest rates Inflation expectations U.S. Federal Reserve monetary policy Liquidity cycles During periods of rate cuts or economic uncertainty, Bitcoin often attracts attention as “digital gold” or a hedge against currency debasement. Conversely, when rates rise and liquidity tightens, BTC experiences downward pressure. C. Halving Cycles and Supply Shock Bitcoin operates on a fixed supply of 21 million coins, with block rewards halving every four years. Each halving reduces the rate of new BTC entering the market. Historically, these events lead to: Reduced selling pressure from miners Increased scarcity-driven demand Potential long-term bullish cycles Even after each halving, the narrative of Bitcoin as a scarce, deflationary asset strengthens. D. Growing Role in Global Money Transfers Bitcoin usage in cross-border payments has surged due to: Lower transaction fees via the Lightning Network Faster settlement times Limited dependency on traditional banking systems This trend is especially prominent in countries facing currency crisis, inflation, or capital controls. E. Market Maturity and Reduced Volatility Compared to earlier years, Bitcoin’s volatility has begun to moderate as liquidity increases and institutional participation grows. This does not eliminate major price swings, but BTC is gradually moving toward being a more established asset class. 2. Ethereum Trends Ethereum (ETH) dominates the smart contract and decentralized application ecosystem. It serves as the backbone for decentralized finance (DeFi), NFTs, tokenization, and much more. Ethereum trends include: A. Transition to Proof of Stake (PoS) The successful transition from Proof of Work (PoW) to Proof of Stake (PoS)—known as the Merge—has permanently shifted Ethereum’s energy consumption and security model. The PoS upgrade has: Reduced energy usage by ~99% Made staking a core yield-generating activity Enhanced network security through validator decentralization ETH staking continues to grow, locking a significant portion of supply away from active circulation. B. Surge in Ethereum Layer-2 Ecosystems Ethereum’s scalability challenges led to the rise of Layer-2 chains like: Arbitrum Optimism Base zkSync StarkNet These chains: Reduce transaction fees Increase processing speed Expand Ethereum’s usability for retail users The long-term trend is toward Ethereum becoming the settlement layer while L2s handle high-volume activity. C. Tokenization of Real-World Assets (RWA) One of the fastest-growing sectors on Ethereum is asset tokenization. Institutions are issuing blockchain-based representations of: Government bonds Real estate Corporate debt Money-market funds Tokenized U.S. Treasury products on Ethereum have grown rapidly, showing real institutional use beyond speculation. D. Ethereum as the Base Layer for DeFi Even after market cycles and volatility, Ethereum remains the dominant chain for: Lending protocols (Aave, Compound) Decentralized exchanges (Uniswap, Curve) Price oracles (Chainlink) Yield staking Total Value Locked (TVL) tends to rise and fall with overall market sentiment, but Ethereum consistently holds the largest share. E. Shift Toward Deflationary Supply After EIP-1559 introduced base fee burning, Ethereum sometimes becomes deflationary, meaning more ETH is burned than issued—especially during periods of high network activity. This creates a long-term bullish supply dynamic similar to Bitcoin’s scarcity. 3. Stablecoin Trends Stablecoins are the foundation of global crypto liquidity. They provide stability, enable global transactions, and serve as a bridge between traditional finance (TradFi) and decentralised finance (DeFi). A. Rapid Growth in Market Capitalization Stablecoins like USDT, USDC, and emerging decentralized alternatives have seen strong growth. They are increasingly used for: Trading pairs on crypto exchanges Remittances Yield generation On-chain settlement DeFi collateral USDT continues to dominate due to its wide availability and high adoption in cross-border markets. B. Regulatory Tightening and Transparency Governments worldwide are enforcing stricter oversight of stablecoins. The aim is to ensure: 1:1 reserve backing Independent audits Stronger disclosure requirements These regulations help institutional adoption and reduce risks associated with opaque issuers. C. Rise of On-chain Payments Stablecoins are rapidly emerging as a global payments infrastructure. Businesses and fintech companies increasingly use stablecoins for: Payroll B2B transfers E-commerce Cross-border settlements Their speed, low cost, and 24/7 availability make them an attractive alternative to SWIFT. D. Competition from CBDCs Central banks globally are experimenting with Central Bank Digital Currencies (CBDCs). Although CBDCs will coexist with stablecoins, they may compete in retail and wholesale payments. Stablecoins, however, retain the advantage of flexibility, programmability, and cross-chain mobility. E. Decentralized Stablecoins Return Decentralized options like DAI and FRAX are evolving to become more resilient. The trend is toward: Overcollateralized models Multi-asset backing Algorithmic governance with strong safety features This helps reduce dependence on centralized issuers. 4. Combined Crypto Market Themes A. Institutionalization of Crypto Bitcoin, Ethereum, and stablecoins together form the backbone for large institutions entering the market. Their maturity and regulatory clarity provide confidence for long-term investment. B. Integration with Traditional Finance Crypto is increasingly merging with traditional financial rails: Tokenized stocks Tokenized treasury bonds Crypto payment cards Stablecoin-powered banking services C. Market Cycles Driven by Liquidity Crypto markets remain heavily influenced by global liquidity. When monetary conditions ease, capital flows into BTC and ETH first, then spreads to altcoins. D. On-Chain User Growth Wallet creation, transaction counts, staking participation, and L2 adoption are rising steadily. Crypto is shifting from speculation to real-world usage. Conclusion Bitcoin, Ethereum, and stablecoins represent the three fundamental pillars of the modern cryptocurrency ecosystem. Bitcoin leads as a global digital store of value, Ethereum powers decentralized applications and financial innovation, while stablecoins act as the liquidity engine for global on-chain activity. Together, these sectors continue to grow due to institutional adoption, technological advancements, and increased global demand for decentralized alternatives to traditional financial systems. As regulatory clarity emerges and more real-world uses develop, these assets are positioned to drive the next phase of crypto market expansion.

quantsignals
پیشبینی صعودی گوگل (GOOGL): سطوح ورود کلیدی برای تریدهای کوتاهمدت
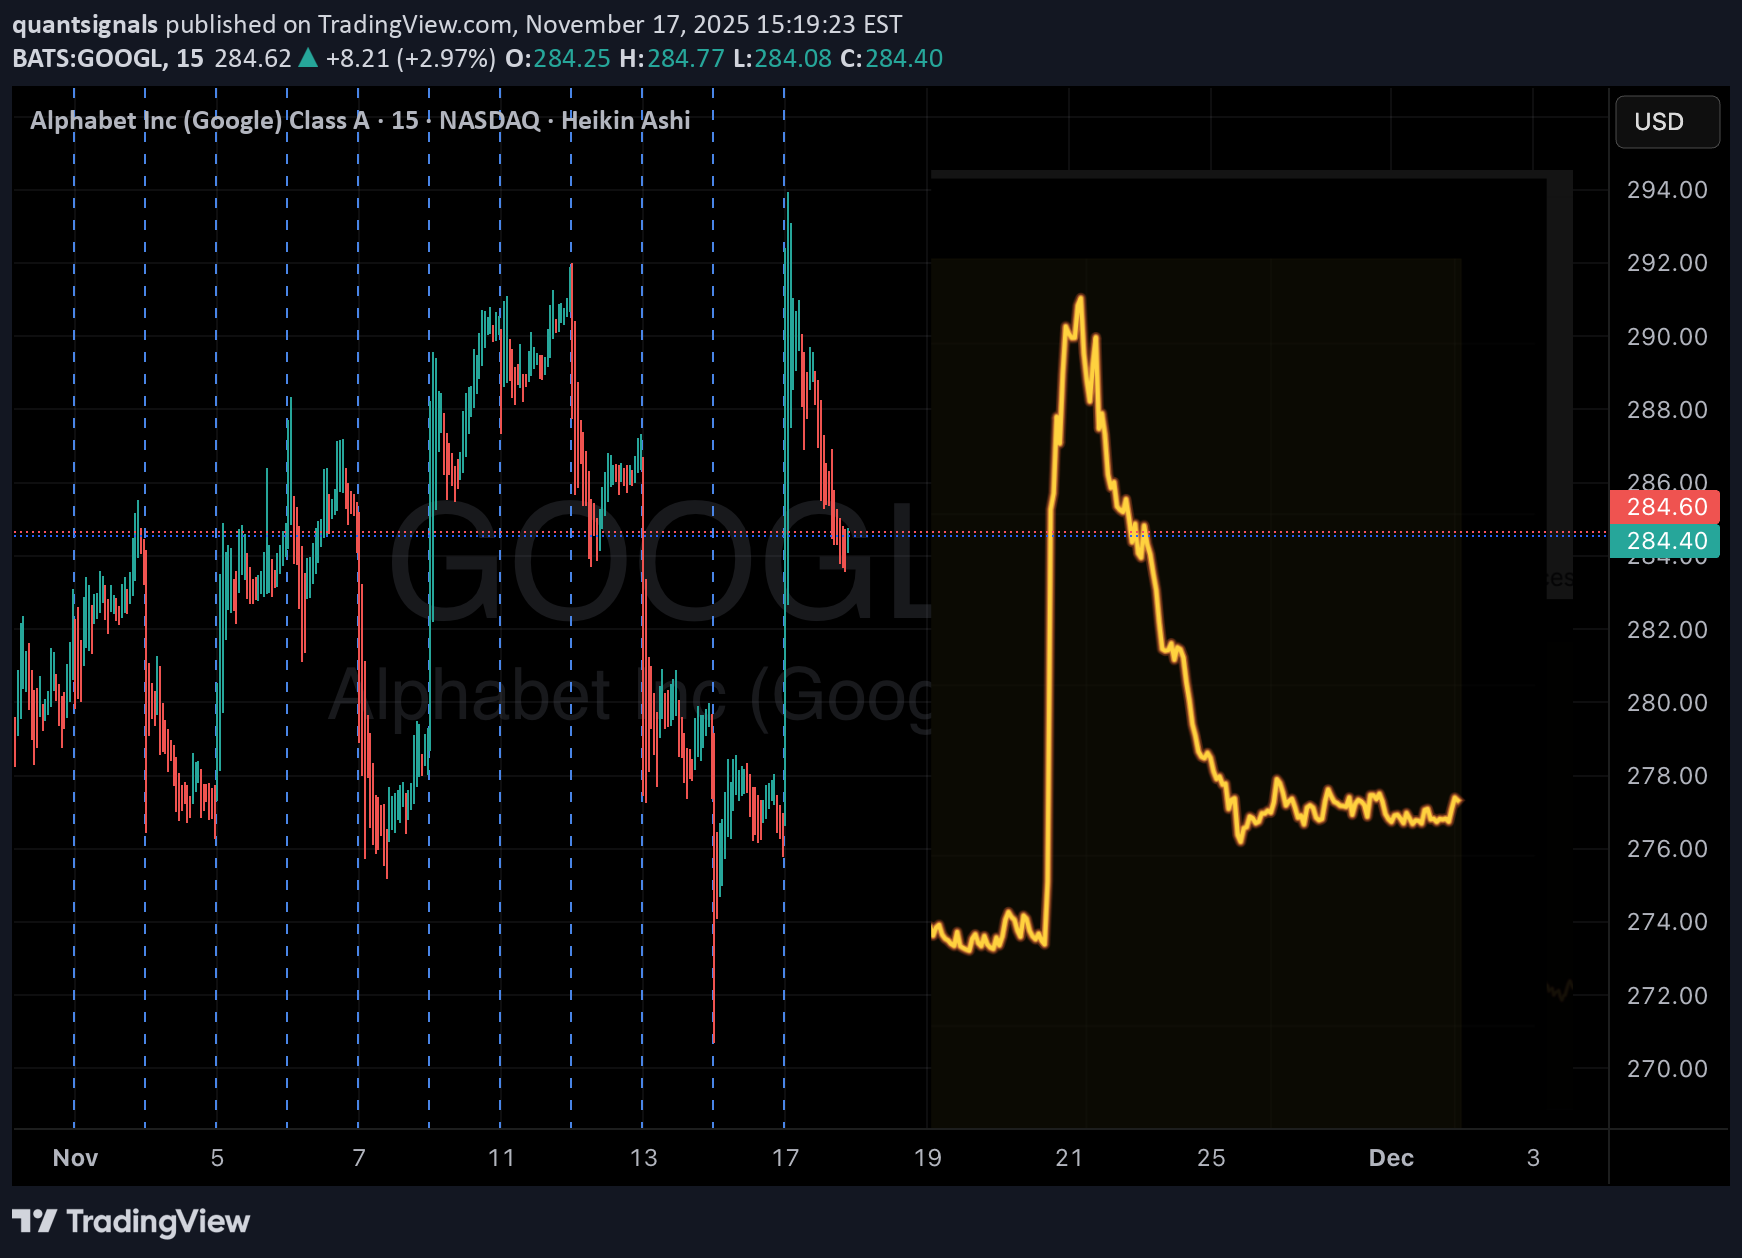
تیکر: GOOGL تاریخ: 2025-11-17 روند: صعودی اطمینان: 64.5٪ - 69.8٪ نوسانات: 14.4٪ - 38.3٪ سیگنال تجاری شماره 1 جهت: LONG ورودی: 286.07 دلار هدف: 287.63 دلار توقف ضرر: 281.78 دلار مورد انتظار Move: +0.68٪ سیگنال تجاری شماره 2 جهت: LONG ورودی: 284.14 دلار هدف: 287.47 دلار توقف ضرر: 279.88 دلار مورد انتظار Move: +1.47٪ خلاصه تحلیل: Katy AI روند صعودی را در هر دو سیگنال با اطمینان متوسط نشان می دهد. اهداف کوتاه مدت 30 دقیقه ای قبل از ادامه، عقب نشینی های جزئی درون روزی (285.71 دلار / 286.90 دلار) را نشان می دهند. نوسانات بین 14.4٪ - 38.3٪ است که نشان دهنده پتانسیل نوسانات روزانه است. مدیریت ریسک پیشنهادی: اندازه موقعیت کوچک را حفظ کنید، استاپ ضرر را به دقت بررسی کنید. نکات کلیدی: هر دو سیگنال حرکت تدریجی به سمت بالا با صعودی متوسط را نشان می دهند. برای معامله گرانی که به دنبال قرار گرفتن در معرض کوتاه مدت بلندمدت در راستای روند AI هستند، بهینه است. مراقب تغییرات درون روز باشید. سطوح توقف ضرر نقاط خروجی کلیدی را فراهم می کند.

ContraryTrader
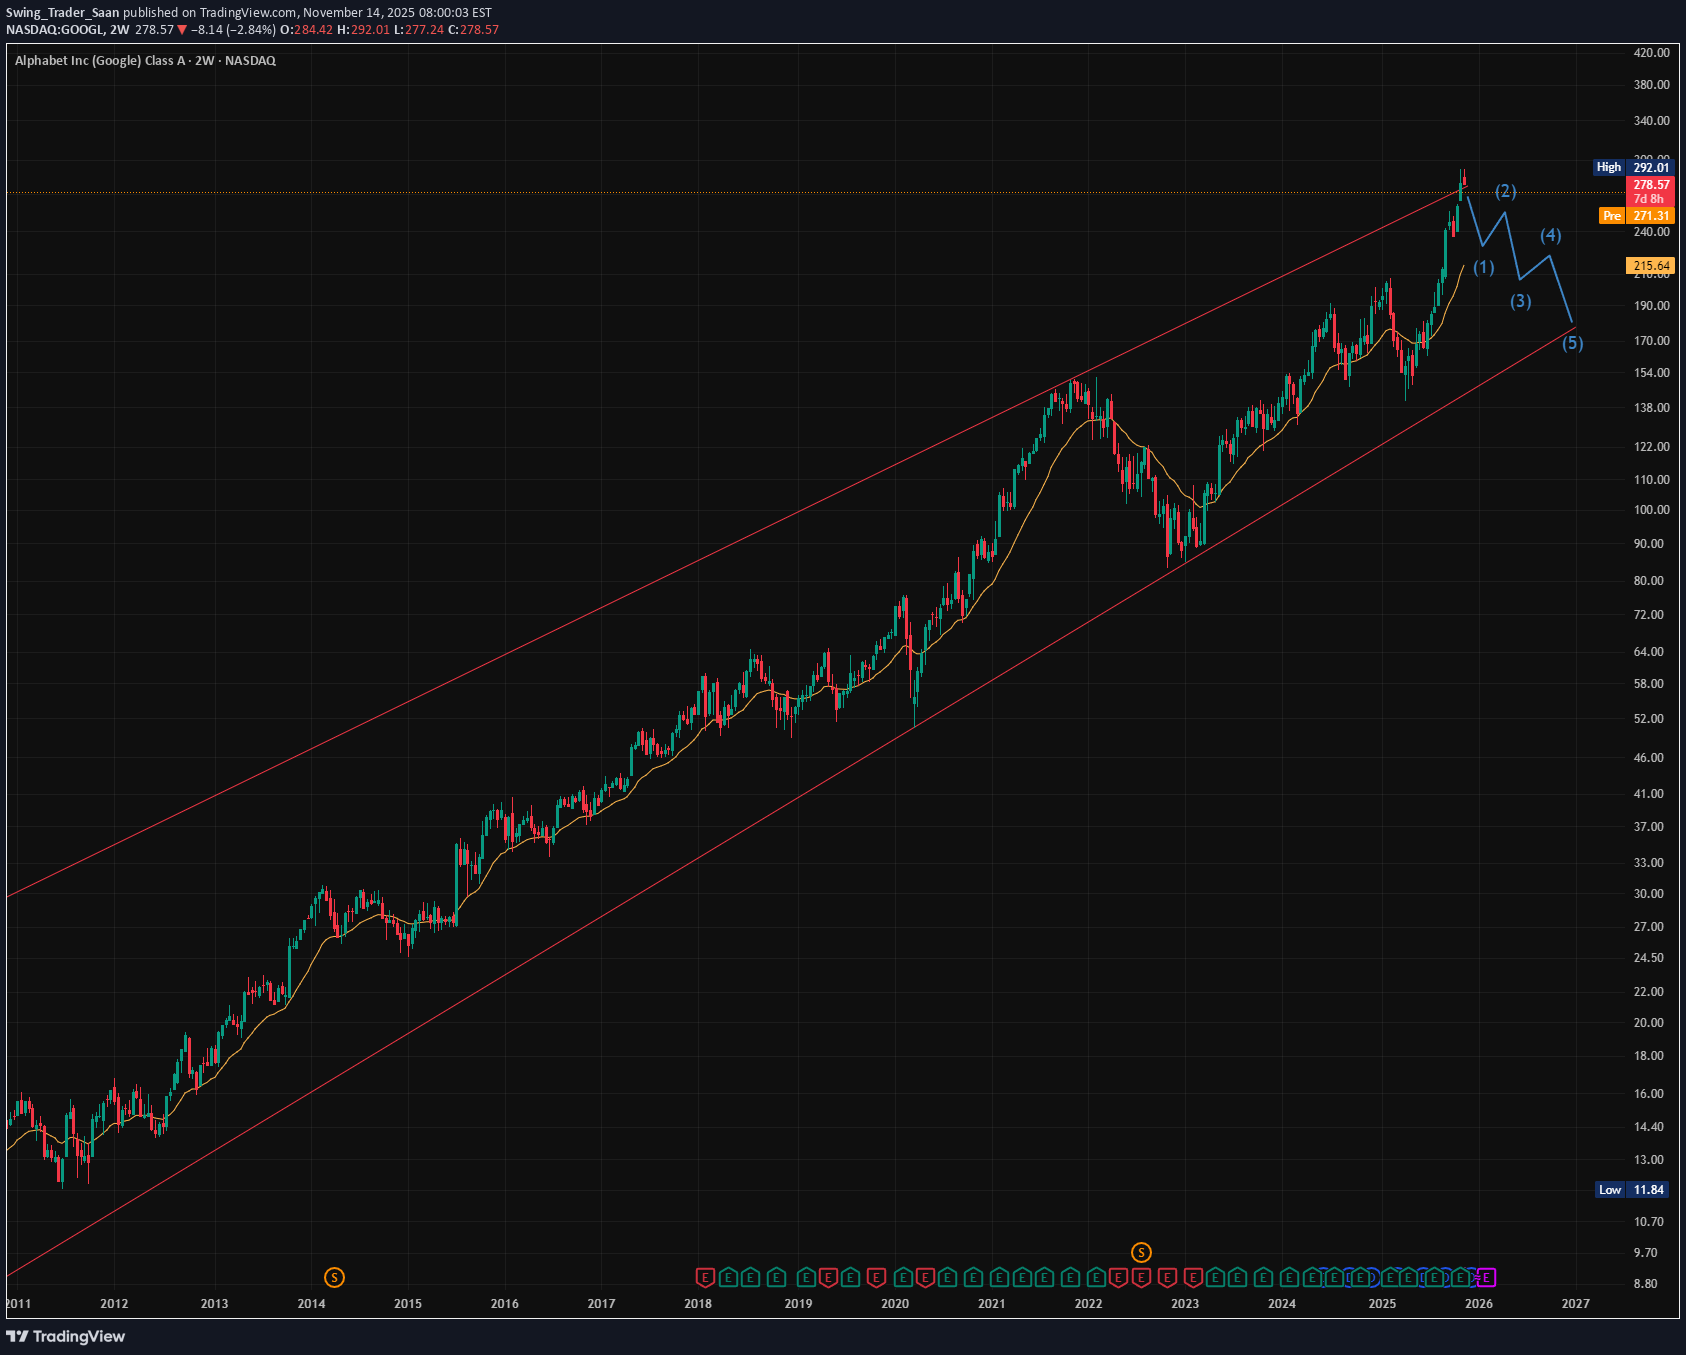
تحلیل تکنیکال گوگل: هشدار فروش! سقوط سنگین در راه است؟
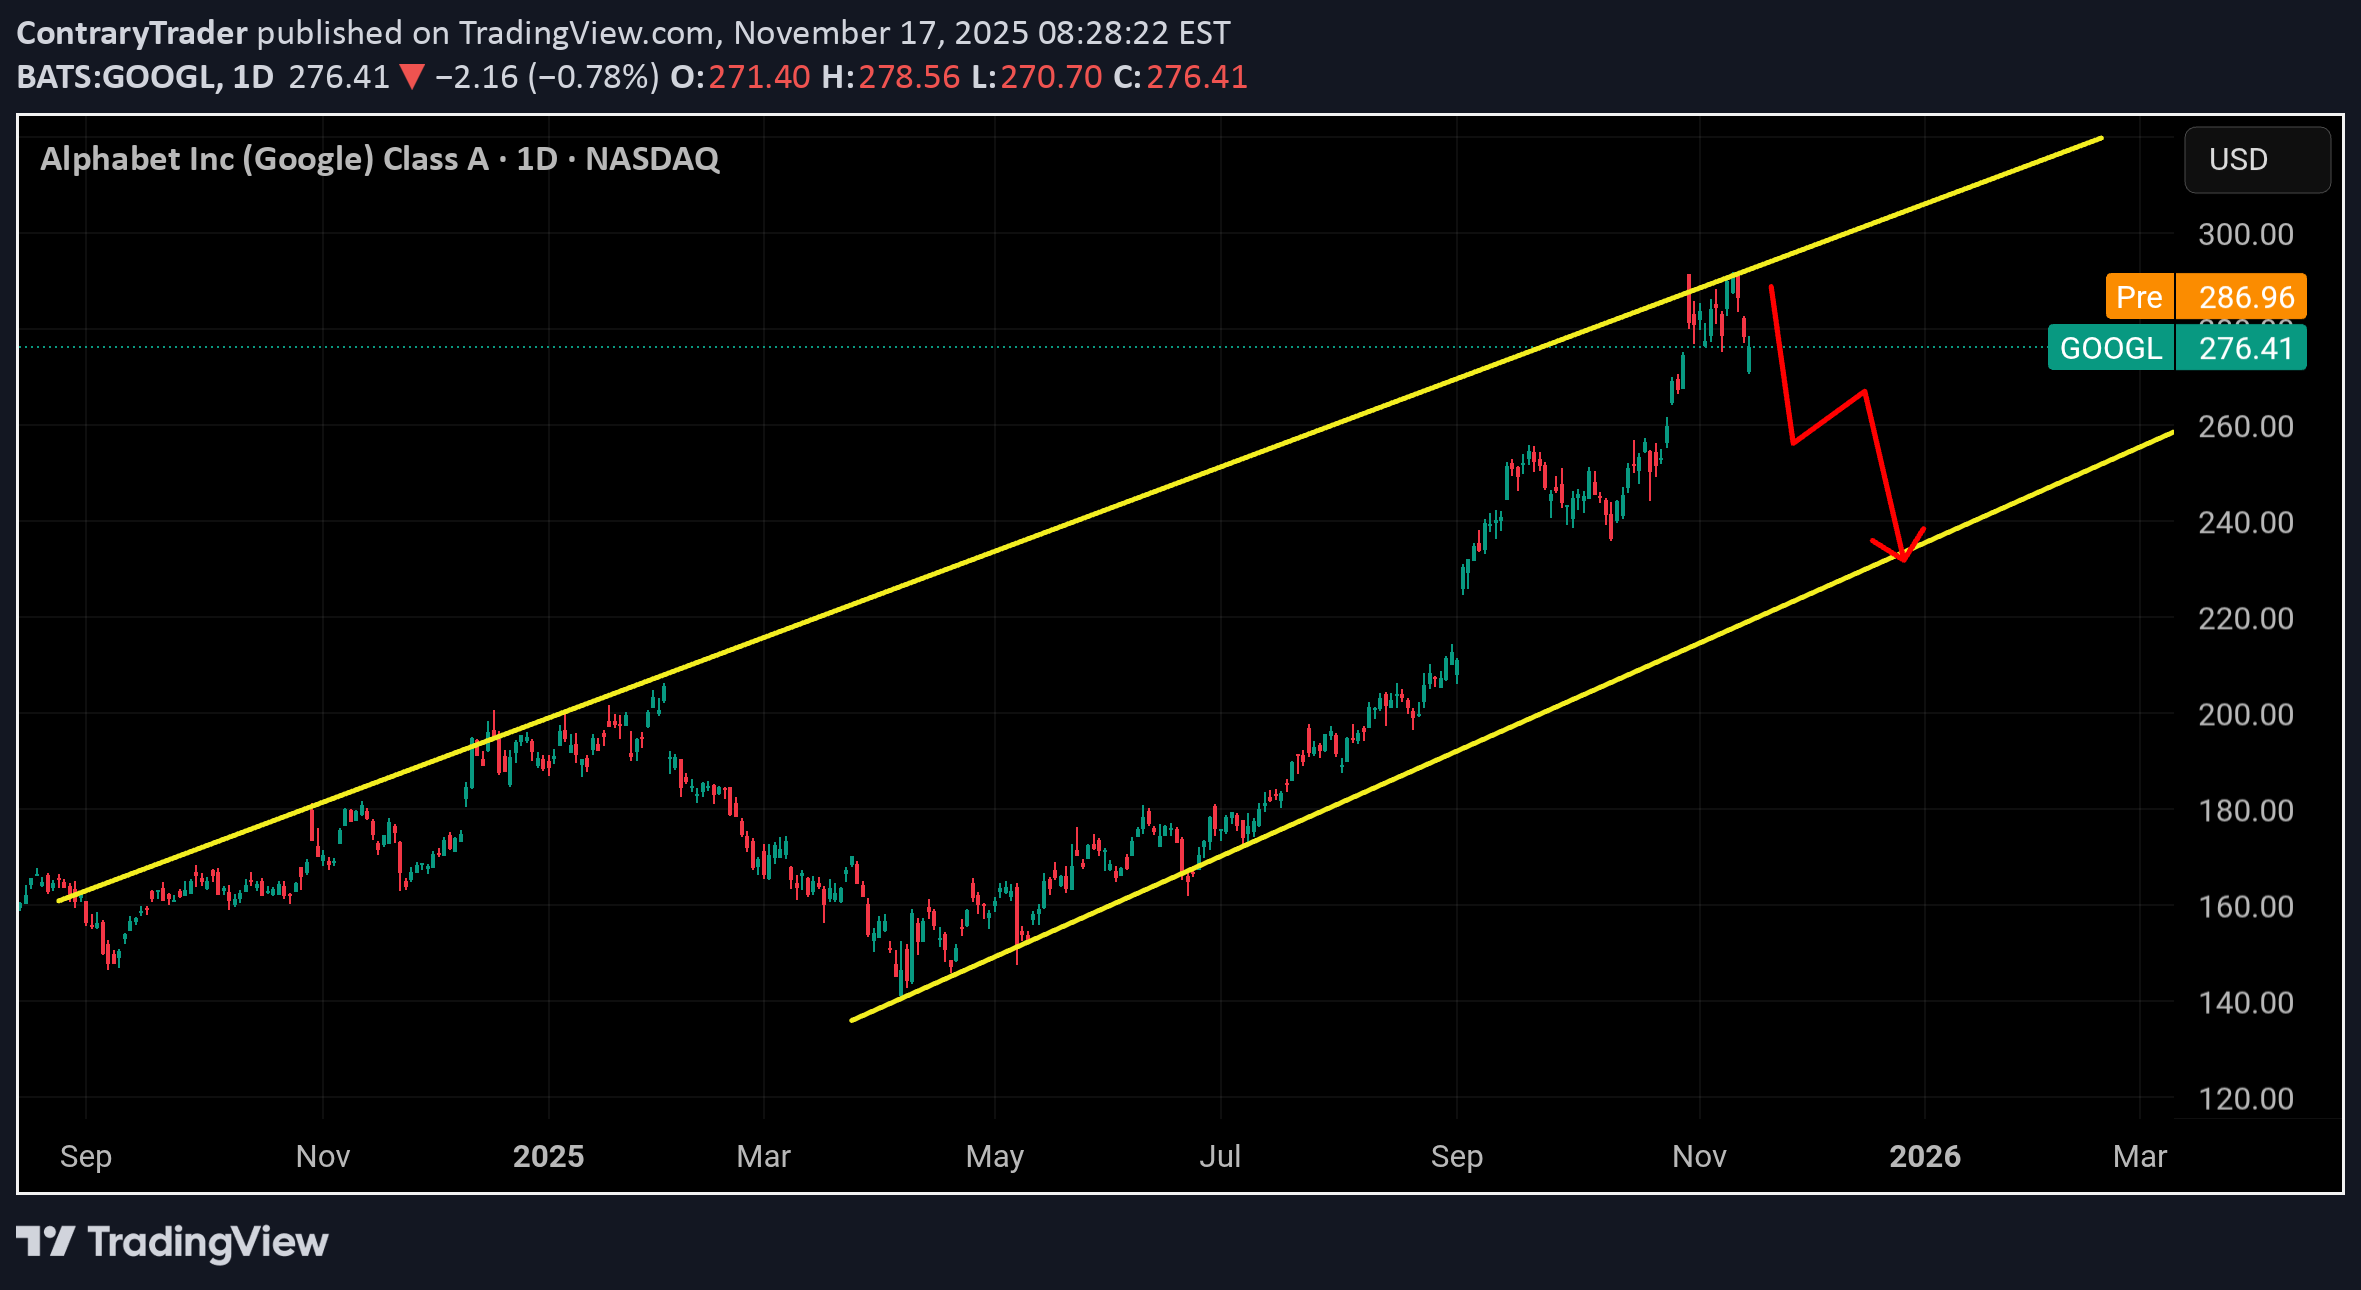
گوگل با نزولی هفتگی پایان داد این اولین بار از مارس 2025 است در حال حاضر 25% از 20sma هفتگی خود تمدید شده است .. 3 بار آخر که googl از 20sma خود گذشته است بیش از 16% کاهش می یابد. به طور کامل از Bollingerband ماهانه خود جدا شده است. این یک پرچم بزرگ red است! تو اینجا تعقیب نمیکنی اما به یاد داشته باشید که باید بازه زمانی را که تجزیه و تحلیل می کنید معامله کنید. از آنجایی که این خرید ماهانه تمام شده است و فکر نمیکنم تا دسامبر ادامه یابد، شورت شما باید حداقل 45 تا 60 روز در انقضا داشته باشد. من انتظار عقب نشینی به 240-255 را در 30-45 روز آینده دارم برای مقاصد ورودی، شما باید به دنبال ورودی نزدیک به 290 باشید. مایل باشید با توقف ضرر بالای 300 به 300 اضافه کنید. هدف اول 270 و سپس 250 زیر آن بود

DEXWireNews
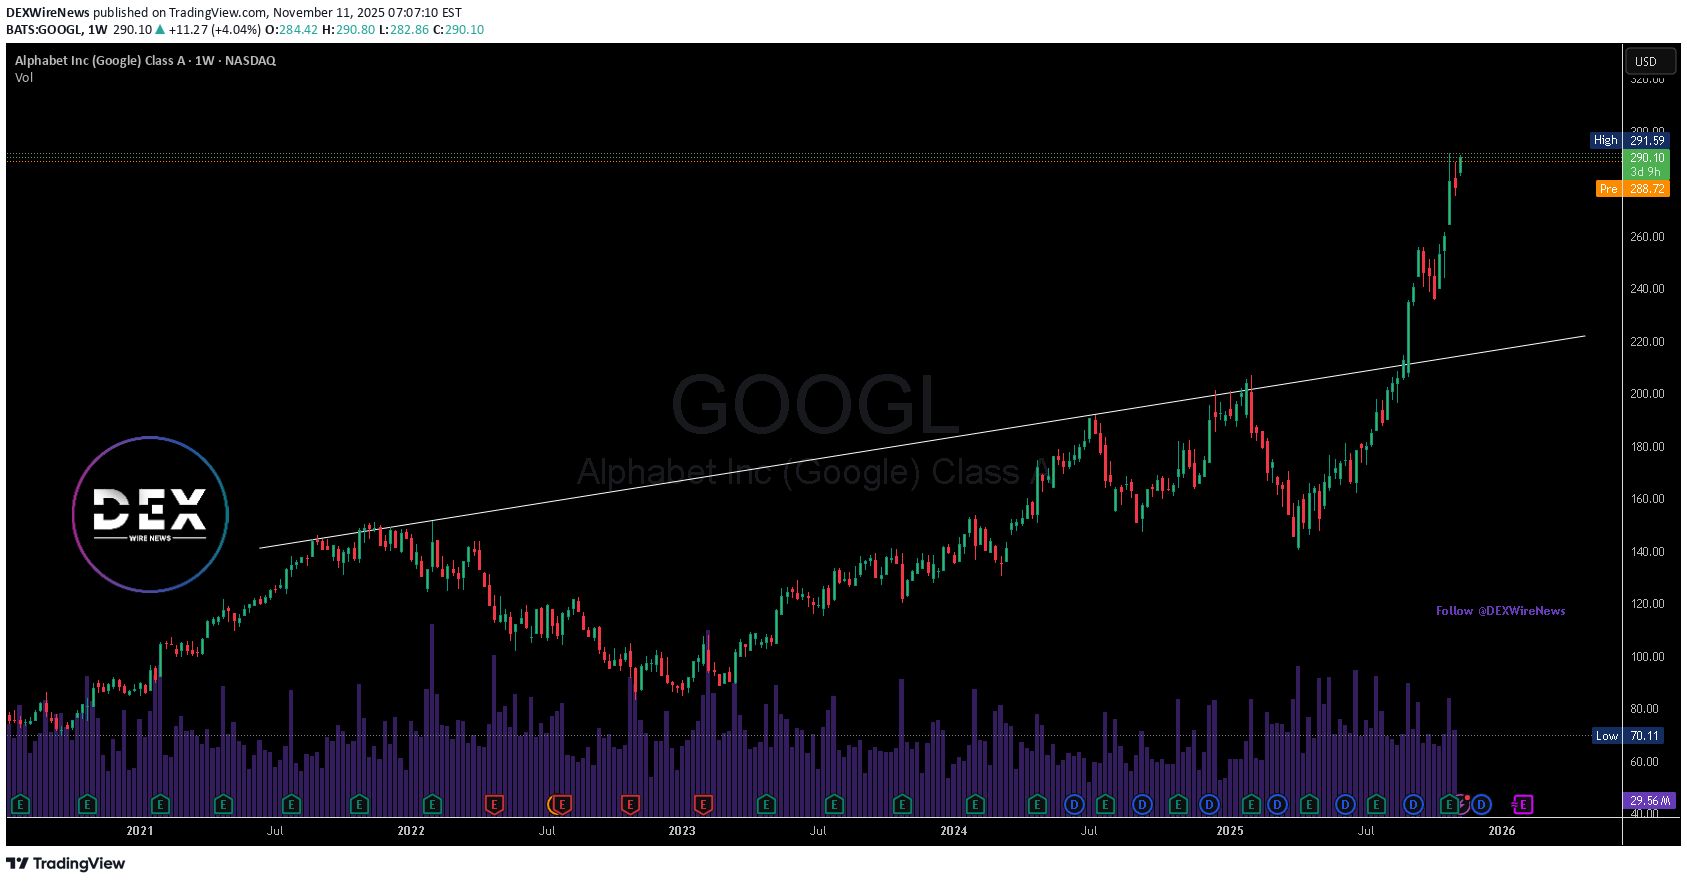
جریمه سنگین گوگل: دادگاه آلمان غول جستجو را مجازات کرد، اما آینده سهام GOOG همچنان صعودی است!
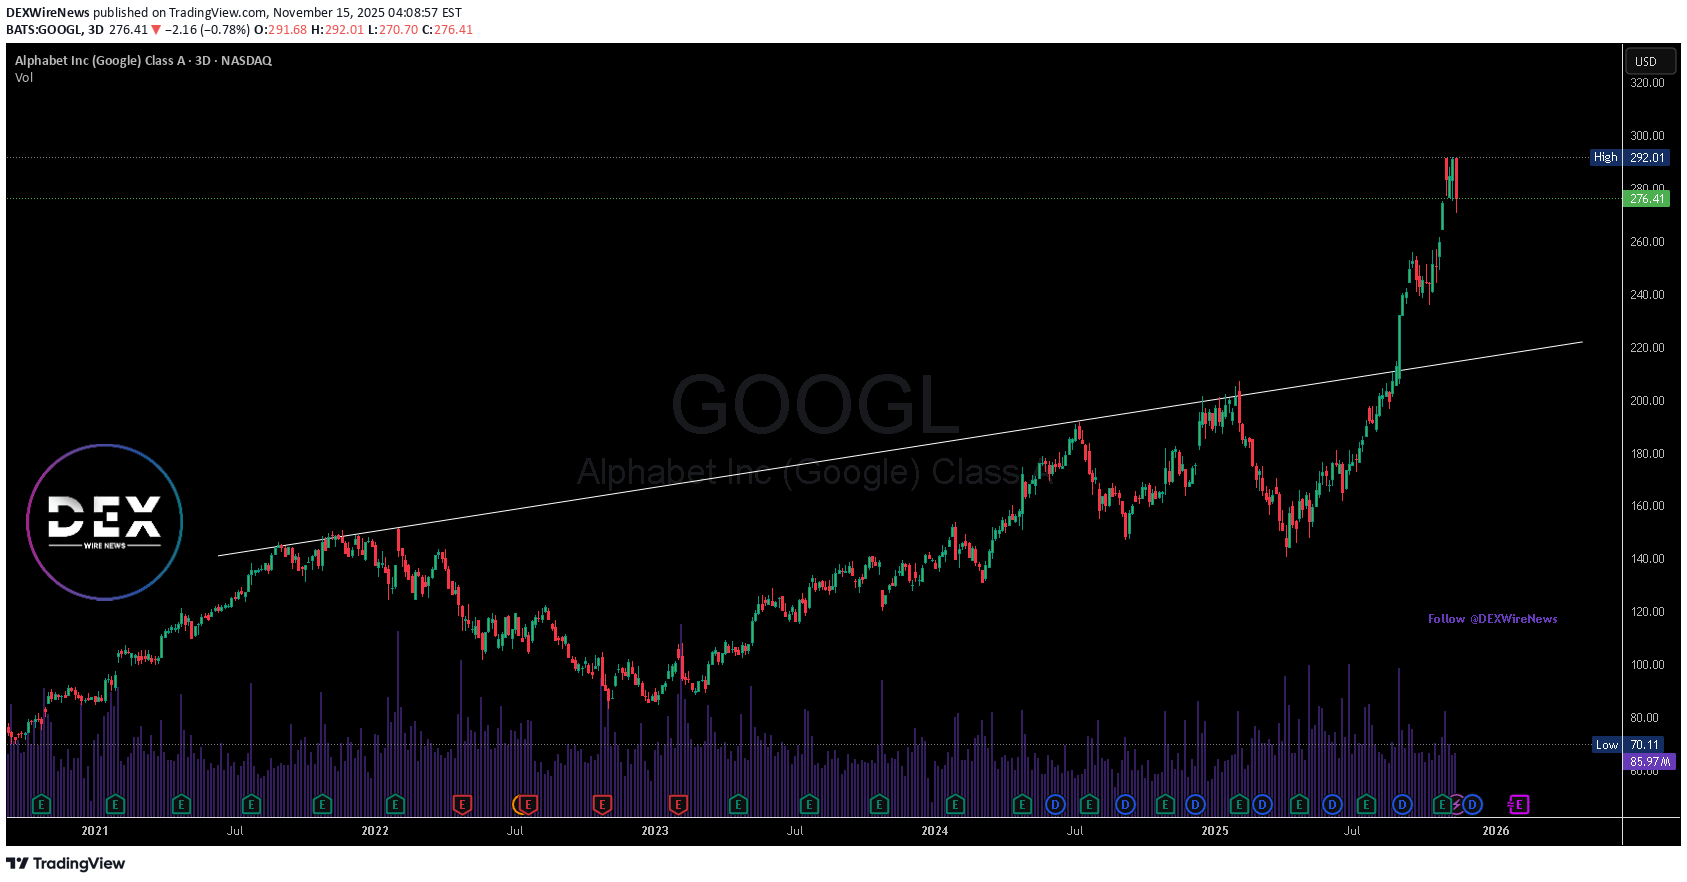
گوگل (GOOG) پس از آنکه دادگاهی در برلین این شرکت را موظف کرد که ۵۷۳ میلیون یورو (۶۶۶ میلیون دلار) بابت غرامت به دو پلتفرم آلمانی مقایسه قیمت بپردازد، با یک شکست حقوقی مواجه شده است. این پرونده از اختلافات دیرینه ضدانحصاری نشأت میگیرد که مرتبط با رویه ادعایی گوگل مبنی بر ترجیح دادن سرویس خرید خود بر رقبا است—موضوعی که کمیسیون اروپا در ابتدا در سال ۲۰۱۷ آن را با جریمه ۲.۴ میلیارد یورویی مجازات کرده بود. دادگاه مبلغ ۳۷۴ میلیون یورو به علاوه ۹۱ میلیون یورو سود را به شرکت ایدئالو (Idealo) اختصاص داد، در حالی که پرودوکتو (Producto GmbH) مبلغ ۸۹.۷ میلیون یورو به علاوه ۱۷.۷ میلیون یورو سود دریافت کرد. هر دو شرکت استدلال کردند که سلطه گوگل در جستجو، دیدپذیری آنها را محدود کرده و سالها از درآمد آنها را از بین برده است. اگرچه گوگل از رد شدن بخش عمدهای از مبلغ ۳.۳ میلیارد یورویی که ایدئالو در ابتدا طلب کرده بود ابراز رضایت کرد، اما همچنان بر این موضع است که با این حکم مخالف بوده و درخواست تجدید نظر داد. این شرکت اصرار دارد که تدابیر اصلاحی سال ۲۰۱۷، نگرانیها را برطرف کرده و نظارت اتحادیه اروپا نیز این دیدگاه را تأیید میکند. با این حال، قضات برلین به این نتیجه رسیدند که تغییرات گوگل برای از بین بردن آسیبهای رقابتی کافی نبوده است—حتی پس از سال ۲۰۱۷. این اولین باری است که یک دادگاه ملی اروپایی به طور صریح اعلام میکند که راهحل اصلاحی گوگل در پایان دادن به سوءاستفاده شکست خورده است، و به طور بالقوه راه را برای میلیاردها یورو ادعاهای تبعی در سراسر اروپا باز میکند. شاکیان ممکن است برای توافقهای بزرگتر فشار بیاورند، که این موضوع به یک چالش حقوقی در حال تحول برای آلفابت (شرکت مادر گوگل) تبدیل شده است. **چشمانداز فنی** علیرغم اخبار حقوقی، نمودار GOOG از نظر ساختاری همچنان صعودی (بولیش) باقی مانده است. این سهام در یک روند صعودی ثابت قرار داشته و توسط کفهای بالاتر و تقاضای قوی در بخش فناوری حمایت میشود. اخیراً، قیمت از یک خط روند کلیدی فراتر رفته است که نشاندهنده شتاب صعودی مجدد است. GOOG در روز جمعه، با انتشار اخبار شاهد یک عقبنشینی بود، اما جهتگیری کلی همچنان دستنخورده باقی مانده است. تا زمانی که سهام در بالای منطقه شکست و خط روند خود باقی بماند، ادامه روند صعودی سوگیری غالب بود و خریداران در هر افت قیمت وارد عمل میشوند.

largepetrol
گوگل با شاخص TrenVantage LITE: صعود ادامهدار یا سقوط قریبالوقوع؟
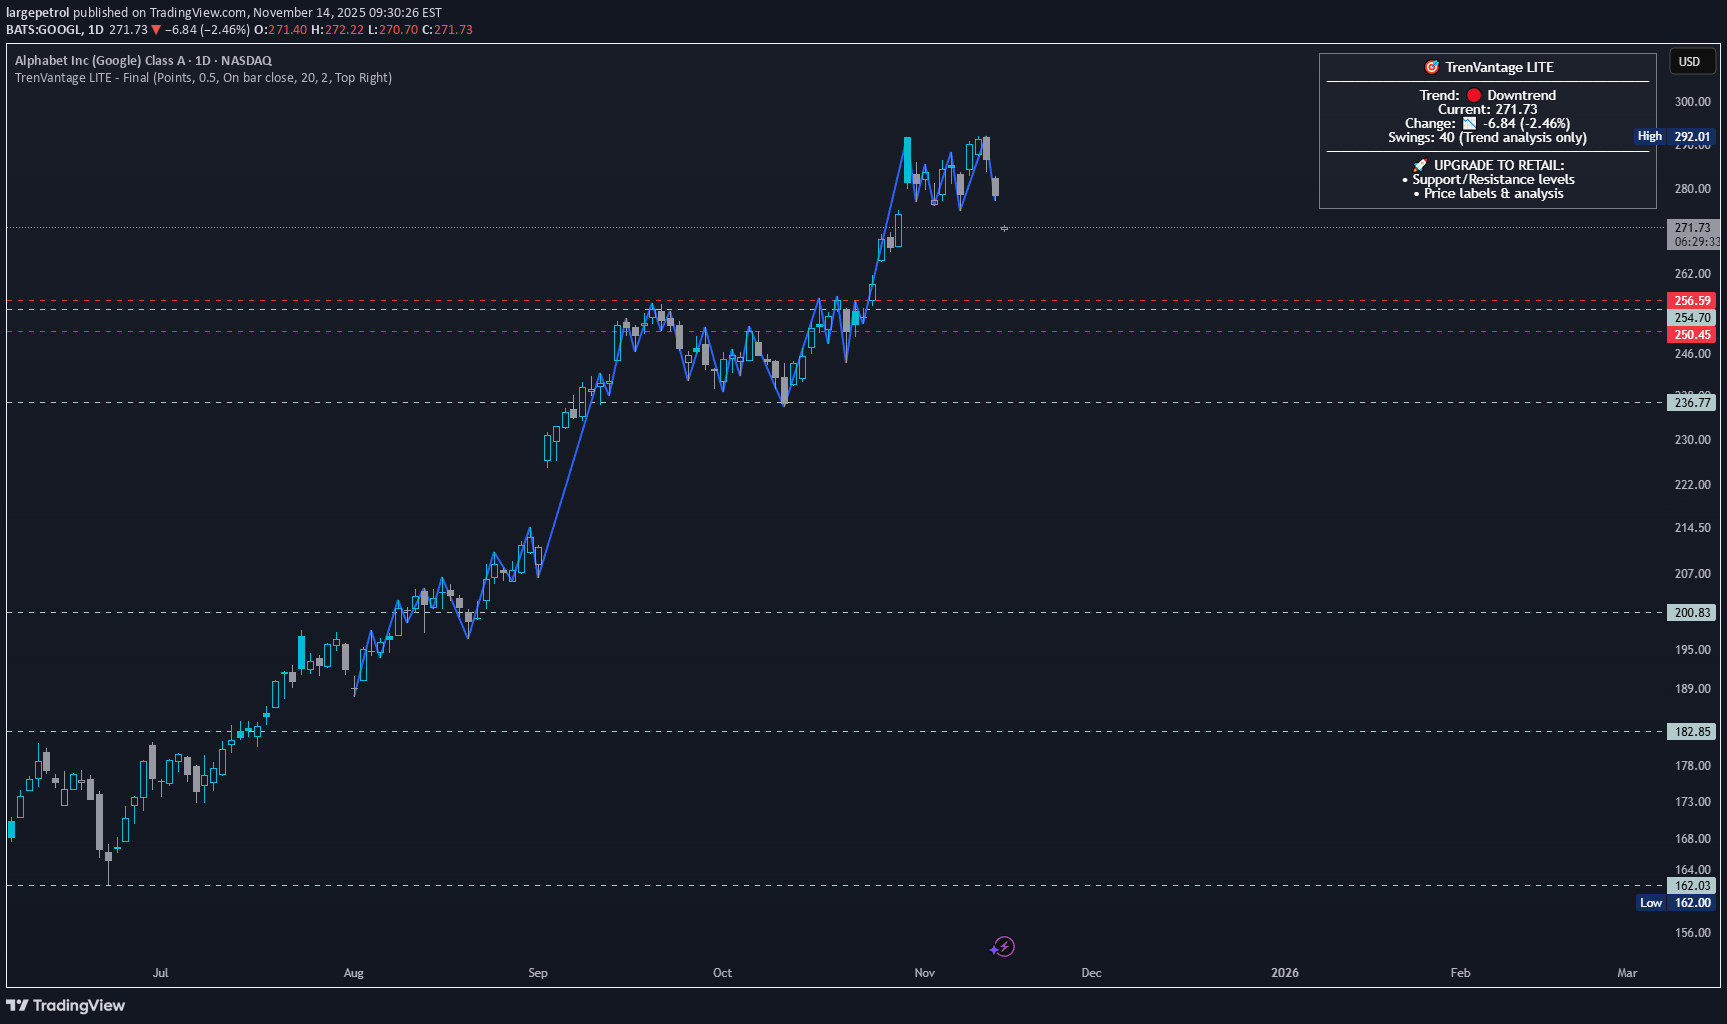
در یک بررسی سریع از گوگل، که پیشتاز بخش فناوری است و با استفاده از شاخص TrenVantage LITE، مشاهده میکنیم که سهم در حال حاضر در روند صعودی قرار دارد. با این حال، ریسک نزولی قابل توجهی برای یک اصلاح قیمتی (پولبک) وجود دارد. افق زمانی این تحلیل چند ماه است؛ اگر سهم شروع به ریزش کند، این سطوح کلیدی را زیر نظر داشته باشید.

گوگل از کانال 2007 خارج شد؛ آیا سقوط در راه است؟
به طور معمول، هنگامی که قیمتها کانالها را بیش از حد میشکنند (overshoot میکنند)، حداقل تا سمت دیگر کانال بازگشت میکنند: GOOG، SPY.
DEXWireNews
سرمایهگذاری ۶ میلیارد دلاری گوگل در آلمان؛ آیا سهام GOOGL از مرز ۳۰۰ دلار عبور میکند؟
آلفابت اینک. (NASDAQ: GOOGL) این هفته به اوجهای جدیدی جهش یافت؛ چرا که گزارشهایی منتشر شد مبنی بر اینکه گوگل قصد دارد حدود ۵ میلیارد یورو (معادل ۵.۸ میلیارد دلار) در آلمان سرمایهگذاری کند تا ردپای مرکز داده و زیرساختهای خود را گسترش دهد. بر اساس منابعی که رویترز به آنها استناد کرده است، این طرح شامل ساخت یک مرکز داده جدید در دیتسنباخ، نزدیک فرانکفورت، و همچنین توسعه یک تأسیسات موجود در هانائو است. هر دوی این پروژهها تعهد فزاینده گوگل به بزرگترین اقتصاد اروپا و حرکت بلندمدت آن به سوی هوش مصنوعی و نوآوری با بیطرفی اقلیمی را تقویت میکنند. این سرمایهگذاری یکی از مهمترین اقدامات گوگل در اروپا محسوب میشود و همسو با استراتژی گستردهتر آن برای افزایش قدرت پردازش محاسباتی و پایداری است. کنفرانس مطبوعاتی برای روز سهشنبه برنامهریزی شده است که انتظار میرود لارس کلینگبایل، وزیر دارایی آلمان، جزئیات بیشتری ارائه دهد. تحلیلگران این توسعه را نشانهای قوی از اعتماد به اقتصاد دیجیتال اروپا و تحول مبتنی بر هوش مصنوعی میدانند. در جبهه فنی، سهام گوگل در یک روند صعودی قدرتمند قرار داشته و اخیراً پس از شکستن مقاومت بلندمدت، به حدود ۲۹۰ دلار رسیده است. این مومنتوم صعودی نشانه کمی از کند شدن دارد و معاملهگران سطح روانی کلیدی ۳۰۰ دلار را به عنوان هدف اصلی بعدی در نظر دارند. حجم معاملات و ساختار روند همچنان حمایتی باقی ماندهاند، به طوری که یک خط روند صعودی در صورت عقبنشینی (اصلاح قیمت)، به عنوان ناحیه حمایتی بالقوه عمل میکند. جهش از آن منطقه میتواند ادامه حرکت به سمت اوجهای رکورد جدید را بیشتر تقویت کند. با وجود مبانی بنیادی قوی که توسط یک سرمایهگذاری راهبردی اروپایی و یک آرایش تکنیکال صعودی پشتیبانی میشود، به نظر میرسد گوگل آماده است تا رالی خود را ادامه دهد. سرمایهگذاران نظارهگر این بود که آیا این شتاب میتواند GOOGL را از ۳۰۰ دلار فراتر ببرد، نقطهعطفی که میتواند فصل بعدی رشد برای یکی از پیشروترین غولهای فناوری جهان را رقم بزند.
ترید فرکانس بالا: راز سودآوری از شکافهای زمانی بازارهای جهانی
Introduction High-Frequency Trading (HFT) has transformed global financial markets by introducing ultra-fast algorithmic strategies that execute thousands of trades in microseconds. With advancements in technology, fiber optics, and low-latency infrastructure, HFT firms continuously search for even the smallest market inefficiencies. One of the lesser-known but increasingly significant strategies in HFT is the exploitation of time zone gaps—leveraging differences in trading hours across global markets to gain arbitrage opportunities. As global financial systems operate around the clock, markets in Asia, Europe, and North America function in different time zones. This asynchronous operation creates brief windows—known as time zone gaps—where information, price movements, or sentiment from one region can be exploited before it fully reflects in another. HFT algorithms capitalize on these moments to generate profit, often within fractions of a second. Understanding Time Zone Gaps Time zone gaps arise because not all markets operate simultaneously. For example: Asian markets (like Tokyo, Hong Kong, or Singapore) open first. European markets (like London or Frankfurt) open after Asia closes. North American markets (like New York or Toronto) open last. Between these openings and closings, there exist periods of overlap (such as the London-New York overlap) and non-overlap windows, when one region’s market reacts to information while another remains closed. These non-overlap periods create price differentials—temporary inefficiencies in related assets, currencies, or commodities. For instance, if U.S. stocks close higher due to strong tech earnings, Asian futures or ETFs linked to the same companies might open higher the next morning. HFT systems exploit these predictable movements during the microseconds after Asian markets open, before manual traders can respond. Mechanism of Exploitation HFT firms deploy advanced cross-market arbitrage algorithms to identify and act on price discrepancies caused by time zone differences. The process generally follows these steps: Global Data Synchronization HFT systems continuously monitor data feeds from exchanges worldwide. They record closing prices, index movements, commodity futures, and currency pairs. Predictive Modeling Algorithms use machine learning and statistical models to predict how an asset in one market should move when another related market opens. For example, if the S&P 500 rises by 2% overnight, the Nikkei 225 futures might be expected to rise proportionally. Latency Arbitrage Execution The key lies in speed. HFT systems execute trades the instant a market opens—often milliseconds before conventional traders—taking positions in stocks, ETFs, or derivatives that are likely to adjust based on global cues. Market Neutral Positions These trades are often market neutral, meaning they do not depend on overall market direction. Instead, they rely on capturing the small, temporary mispricing between two correlated assets across time zones. Exit Strategy Once the market adjusts (usually within seconds or minutes), HFT systems exit positions, locking in profits from the price convergence. Examples of Time Zone Arbitrage Equity Index Futures Consider futures contracts on the Nikkei 225 and S&P 500. When the U.S. market closes with a strong rally, HFT systems anticipate that Japanese futures will open higher. They buy Nikkei futures moments before the Tokyo Stock Exchange opens, profiting from the predictable uptick. Currency Pairs (FX Market) Although the forex market operates 24/5, liquidity fluctuates with regional business hours. HFTs exploit cross-currency correlations—for example, between USD/JPY and EUR/USD—when one region’s liquidity dries up, creating a slight pricing lag before another market compensates. Commodity Markets Oil or gold futures traded in New York often influence Asian commodity prices the next morning. HFT algorithms scan U.S. closing data and place instant orders on Asian commodity exchanges at open, capitalizing on the delayed reaction. ETF vs. Underlying Asset Arbitrage Exchange-Traded Funds (ETFs) that track international markets (like “iShares MSCI Japan ETF” listed in New York) can diverge from their underlying asset prices when the foreign market is closed. HFT systems arbitrage these gaps as soon as the foreign market reopens. Technological Infrastructure Behind HFT To exploit time zone gaps effectively, HFT firms invest heavily in technology, as speed and precision are critical. Key components include: Low-Latency Networks: Fiber-optic or microwave communication links that transmit data across continents in milliseconds. Co-Location Services: Placing servers physically close to exchange data centers to reduce transmission delay. Predictive Algorithms: AI and machine learning models trained on years of cross-market data to forecast short-term movements. Real-Time Analytics: Systems capable of processing terabytes of financial data per second for instant decision-making. Smart Order Routing (SOR): Algorithms that determine the optimal exchange and timing for order execution across markets. Advantages of Exploiting Time Zone Gaps Arbitrage Efficiency – Profiting from predictable market reactions without directional risk. Liquidity Provision – HFT often adds liquidity to markets during low-volume periods. Price Discovery – By quickly integrating global information, HFT helps align asset prices across time zones. Diversification of Opportunities – Allows firms to operate continuously, taking advantage of 24-hour trading across the globe. Challenges and Risks While profitable, exploiting time zone gaps comes with significant risks and operational hurdles: Technological Costs The infrastructure required for global, low-latency trading is extremely expensive. Only large institutions can afford these systems. Regulatory Scrutiny Different regions have different trading regulations. Ensuring compliance across jurisdictions (e.g., the U.S. SEC vs. Japan’s FSA) is complex and risky. Market Fragmentation Data synchronization across multiple time zones can lead to inaccuracies due to latency or bandwidth issues, resulting in potential trading losses. Competition As more HFTs target the same inefficiencies, profit margins shrink rapidly. The competition becomes a “race to zero” in terms of latency. Flash Crashes and Instability Rapid algorithmic trading across interconnected markets can amplify volatility. A shock in one market can instantly ripple across others, causing flash crashes. Regulatory and Ethical Considerations Global regulators have expressed concern that exploiting time zone gaps might create unfair advantages for technologically advanced firms. Critics argue that HFTs manipulate speed rather than true economic value. To address this, some exchanges have introduced speed bumps or randomized order delays to reduce the impact of latency-based strategies. Moreover, cross-border coordination is limited. Without harmonized regulation, firms can operate in regulatory “gray zones,” exploiting markets with weaker oversight. This has led to ongoing debates about transparency, fairness, and market stability. The Future of HFT in Global Time Zone Trading The evolution of global markets suggests that HFT will continue to refine time zone gap strategies. Key future trends include: AI-Powered Prediction Models: Advanced neural networks will better anticipate inter-market reactions, making time zone exploitation even more precise. Quantum Computing: Future breakthroughs in computational speed could make latency arbitrage almost instantaneous. 24/7 Trading Models: As more markets (like cryptocurrencies) adopt round-the-clock trading, traditional time zone gaps may shrink, pushing HFTs to adapt. Regulatory Convergence: International cooperation could create unified frameworks, balancing innovation with market integrity. Conclusion High-Frequency Trading’s ability to exploit time zone gaps showcases how technology, data, and speed converge in modern finance. By leveraging global time differences, HFT firms transform tiny inefficiencies into consistent profits. While such strategies enhance liquidity and price discovery, they also raise concerns about market fairness, systemic risk, and unequal access to technology. In essence, exploiting time zone gaps represents both the brilliance and the fragility of today’s interconnected markets—a reflection of how milliseconds can define success in a 24-hour global trading ecosystem.

The-Thief
گوگل (GOOGL) تا مقاومت 320 دوام میآورد؟ استراتژی خرید لایهای!
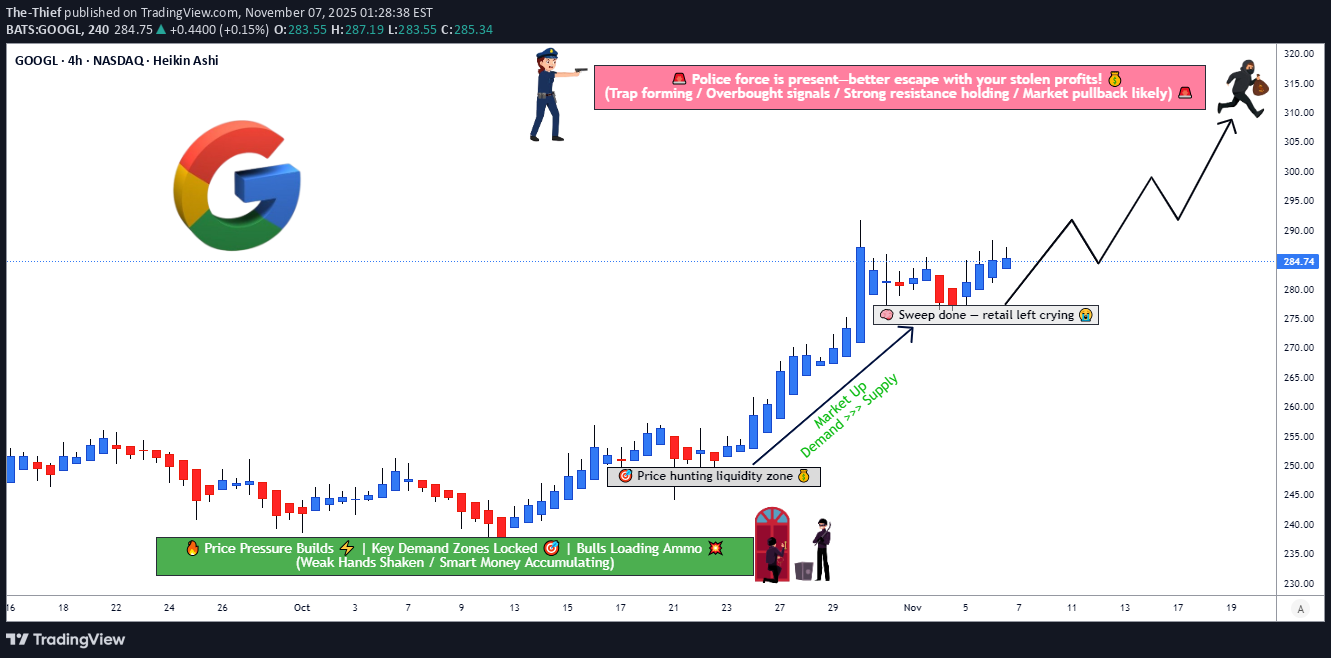
🎯 سرقت GOOGL: عملیات طرح فرار آلفابت 💰 شرکت آلفابت (نزدک) - معامله نوسانی | استراتژی ورود چند لایه 📊 ساختار معاملاتی (SETUP) احساسات (جو بازار): 🟢 صعودی (گاوی) | چارچوب زمانی: معامله نوسانی | سطح ریسک: متوسط 🎲 استراتژی ورود: «لایهبندی سارق» انباشت استراتژیک خرید در چند سطح با استفاده از دستورات محدود (Limit Orders) رویکرد لایه به لایه: 🔵 لایه ۱: ۲۷۰.۰۰ دلار (ورود اولیه - ۳۰٪ پوزیشن) 🔵 لایه ۲: ۲۷۵.۰۰ دلار (منطقه حمایتی - ۳۵٪ پوزیشن) 🔵 لایه ۳: ۲۸۰.۰۰ دلار (سازنده قدرت - ۳۵٪ پوزیشن) چرا این روش کار میکند؟ ورودیهای چندگانه، میانگین قیمت تمام شده شما را کاهش میدهند و کارایی حداکثری سرمایه را فراهم میکنند. اگر قیمت از بالا رد شود، شما در مناطق پایینتر خرید کردهاید. اگر قیمت جهش کند (پامپ کند)، شما از قبل وارد شدهاید! 💡 🛑 محافظت با حد ضرر (STOP LOSS) حد ضرر: 🚨 ۲۶۵.۰۰ دلار (زیر ساختار حمایتی) این سطح نشاندهنده ریسک ۱.۹٪ از اولین ورود است — مدیریت ریسک منضبط در بهترین حالت خود. ⚠️ اقرار به ریسک: حد ضرر شما، قوانین شماست. ما معاملهگر هستیم، نه مشاور مالی. آن را بر اساس تحمل ریسک و اندازه حساب خود تنظیم کنید. این یک اشتراکگذاری استراتژی آموزشی است، نه توصیه مالی شخصی. 🎖️ اهداف سود و مسیرهای فرار هدف اصلی: 📈 ۳۱۰.۰۰ دلار منطقه مقاومت قوی در حال شکلگیری شرایط اشباع خرید در حال توسعه عملکرد: ۵۰ تا ۶۰ درصد سود را در این سطح ذخیره کنید هدف ثانویه: 🏆 ۳۲۰.۰۰ دلار منطقه سد پلیس (مقاومت شدید) احتمال زیاد تله (بازگشت ناگهانی) در این سطح عملکرد: خروج تدریجی از ۴۰ تا ۵۰ درصد باقیمانده یا سفت کردن حد ضرر تا نقطه سر به سر فلسفه خروج: طمع، معاملهگران را نابود میکند. سود را به صورت سیستماتیک ذخیره کنید. بهترین معامله آنی است که شب راحت بخوابید. 😴 ⚠️ نکته سود: اهداف شما، زمانبندی شماست. خروجهای تدریجی را بر اساس شرایط بازار، تأیید حجم و سطح آسایش خود تنظیم کنید. 🔗 جفتهای مرتبط برای نظارت (ردیابی همبستگی) 🔵 MSFT 📱 — همبستگی بالا (بخش تکنولوژی) | اگر MSFT سقوط کند، GOOGL با موانع بخش روبرو میشود. ابتدا سیگنالهای واگرایی را در اینجا زیر نظر بگیرید. 🔵 QQQ 🔺 — همبستگی ۰.۸۵+ (نزدک ۱۰۰) | ضعف QQQ = سیگنال بالقوه عقبنشینی GOOGL. این بررسی سلامت بخش شما قبل از ورود است. 🔵 IWM 📊 — همبستگی معکوس (ریسک چرخش) | قدرت راسل ۲۰۰۰ = خروج پول رشد از مگاکپها. اگر سهام کوچک جهش کنند، تکنولوژی ممکن است سرد شود. 🔵 TLT 💳 — نماینده نرخ بهره | افزایش اوراق قرضه = فشار بر تکنولوژی؛ کاهش اوراق قرضه = دوستدار تکنولوژی. سیاست فدرال رزرو مستقیماً از اینجا جریان مییابد. 🔵 VIX 😰 — شاخص نوسانات | جهش VIX = گریز از ریسک، انحلال احتمالی GOOGL. بالای ۲۰ = کاهش میزان در معرض ریسک پوزیشن. نکته کلیدی: ابتدا QQQ و MSFT را تماشا کنید. آنها قناری شما در معدن زغالسنگ هستند. اگر بخش (تکنولوژی) ضعیف است، در قاطعیت ورود خود تجدید نظر کنید. 🚨 💎 خلاصه استراتژی ✅ سوگیری صعودی با انباشت چند ورودی منضبط ✅ ریسک تعریف شده با حد ضرر در ۲۶۵ دلار ✅ ذخیره سود مرحلهای برای قفل کردن سیستماتیک دستاوردها ✅ آگاهی از همبستگی، از چرخشهای ناگهانی بخش جلوگیری میکند 🎬 کلام پایانی به یاد داشته باشید: این استراتژی سارق™ است — یک چارچوب آموزشی و سرگرمکننده برای معاملات نوسانی، و نه توصیه مالی. با مسئولیت خودتان معامله کنید. اندازه پوزیشن، حد ضررها و اهداف سود باید منعکسکننده شرایط، تحمل ریسک و اندازه حساب منحصربهفرد شما باشند. این سرقت تنها در صورتی موفقیتآمیز است که با سود فرار کنید. با گیر افتادن و نگهداری زیان (Holding the Bag) گرفتار نشوید! 💼🚪 ✨ اگر تحلیل من برای شما ارزشمند است، یک 👍 و 🚀 کمک بزرگی بود — این به من کمک میکند تا ساختارهای معاملاتی بیشتری را با جامعه به اشتراک بگذارم! #GOOGL #AlphabetInc #SwingTrade #TechAnalysis #TradingStrategy #NASDAQ #TradingIdeas #MultiLayers #RiskManagement #Bullish #ThiefStrategy #TradingCommunity #TradingView #Technical #StockMarket
EPSMomentum
پیشبینی صعودی گوگل (GOOGL) پس از گزارش درآمد: دقت ۷۹٪!
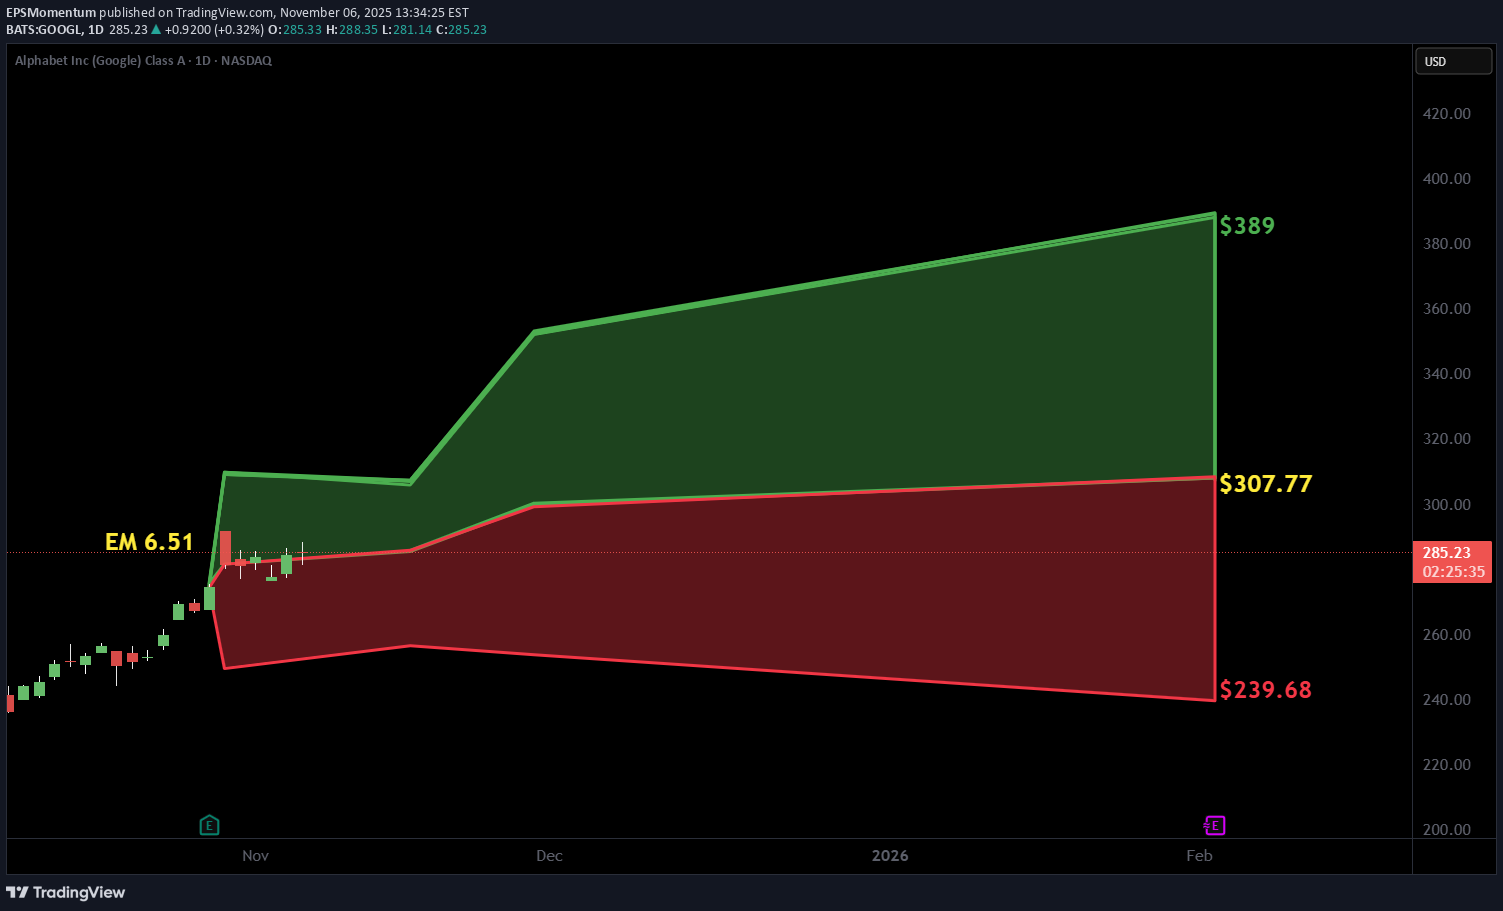
PEAD چشم انداز صعودی را پیش بینی کرد GOOGL پس از یک واکنش مثبت بیش از حد پس از انتشار سود، سهام را در drift A با دقت مورد انتظار 78.95٪ قرار داد.
سلب مسئولیت
هر محتوا و مطالب مندرج در سایت و کانالهای رسمی ارتباطی سهمتو، جمعبندی نظرات و تحلیلهای شخصی و غیر تعهد آور بوده و هیچگونه توصیهای مبنی بر خرید، فروش، ورود و یا خروج از بازارهای مالی نمی باشد. همچنین کلیه اخبار و تحلیلهای مندرج در سایت و کانالها، صرفا بازنشر اطلاعات از منابع رسمی و غیر رسمی داخلی و خارجی است و بدیهی است استفاده کنندگان محتوای مذکور، مسئول پیگیری و حصول اطمینان از اصالت و درستی مطالب هستند. از این رو ضمن سلب مسئولیت اعلام میدارد مسئولیت هرنوع تصمیم گیری و اقدام و سود و زیان احتمالی در بازار سرمایه و ارز دیجیتال، با شخص معامله گر است.