
FWOG
Fwog (SOL)
| تریدر | نوع سیگنال | حد سود/ضرر | زمان انتشار | مشاهده پیام |
|---|---|---|---|---|
نتیجه ای یافت نشد. | ||||
نمودار قیمت Fwog (SOL)
سود ۳ ماهه :
سیگنالهای Fwog (SOL)
فیلتر
مرتب سازی پیام براساس
نوع پیام
نوع تریدر
فیلتر زمان

jpkxyz
تحلیل کوتاه: اشتباه در معامله فروش (Short) و اصلاح به سمت نقطه کنترل (POC)
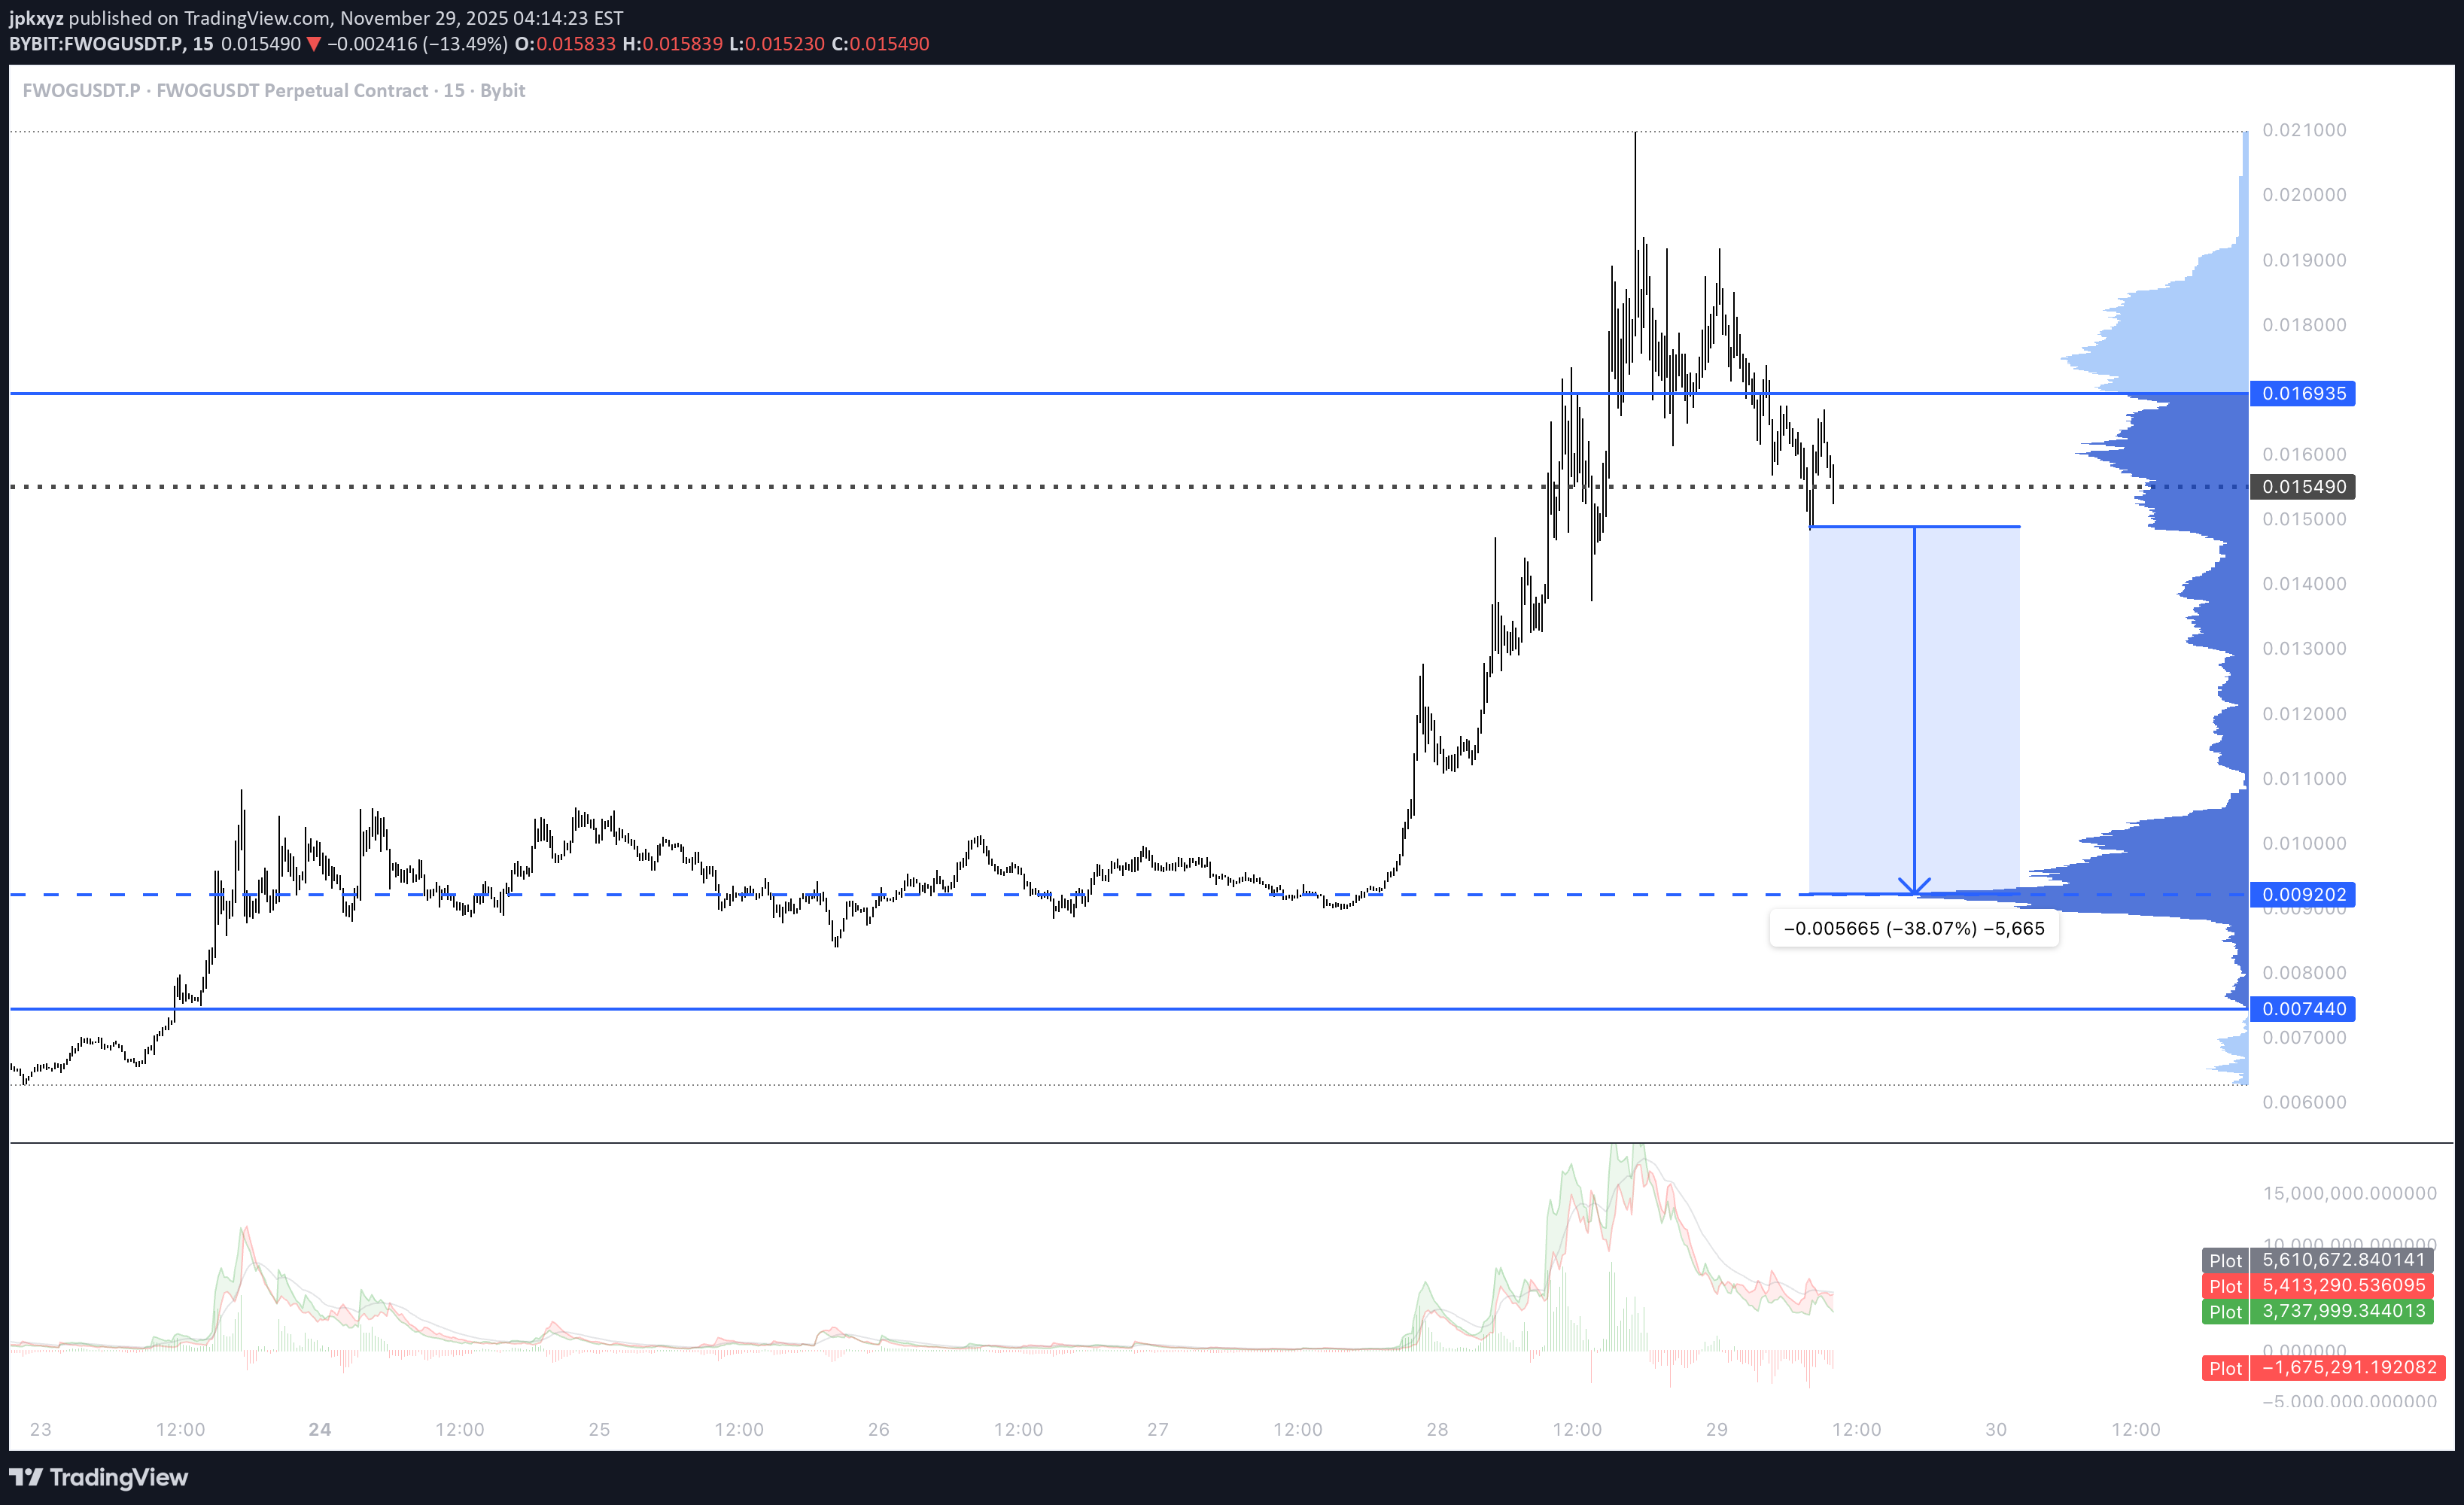
وارد کردن یک Short at break در زیر پشتیبانی با هدف قرار دادن POC.Trade Entry سرانجام پس از 18 ساعت تاخیر انجام شد. در حال حاضر سود خوبی دارید و SL عقب مانده است. بیایید ببینیم چقدر پایین می آییم.

SevenStarBuySell
فروش کوتاه (Short) در FWOG: استراتژی دقیق و اهداف معاملاتی آینده
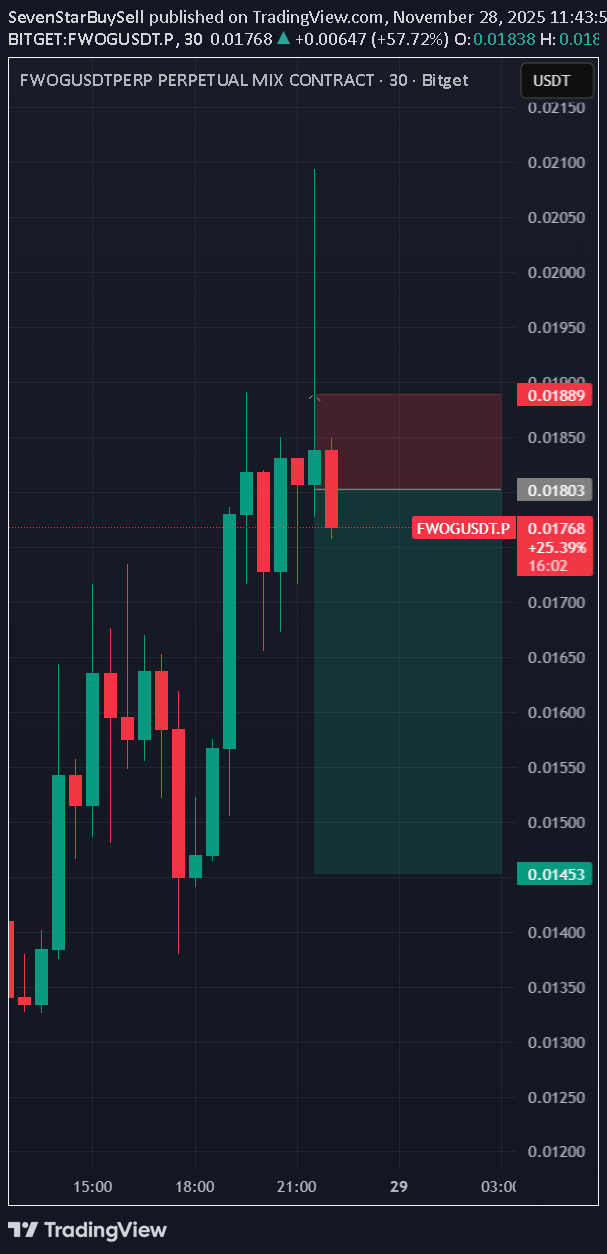
بر اساس استراتژی، یک موقعیت شورت (فروش) در FWOG ثبت شده است. اهداف روی چارتها مشخص هستند. بررسی و تحقیق شخصی را انجام دهید (DYOR).

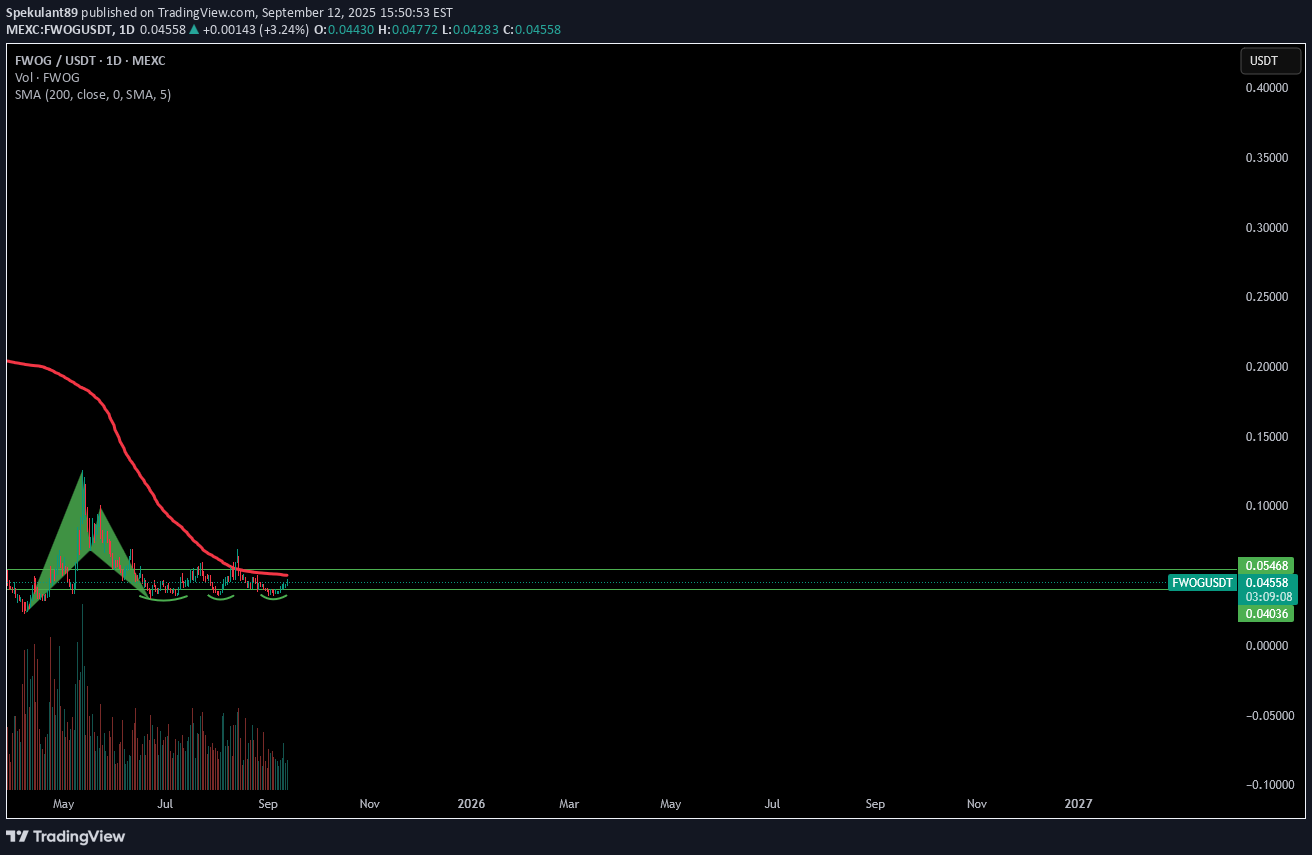
Spekulant89

porterstone
short idea $FWOG
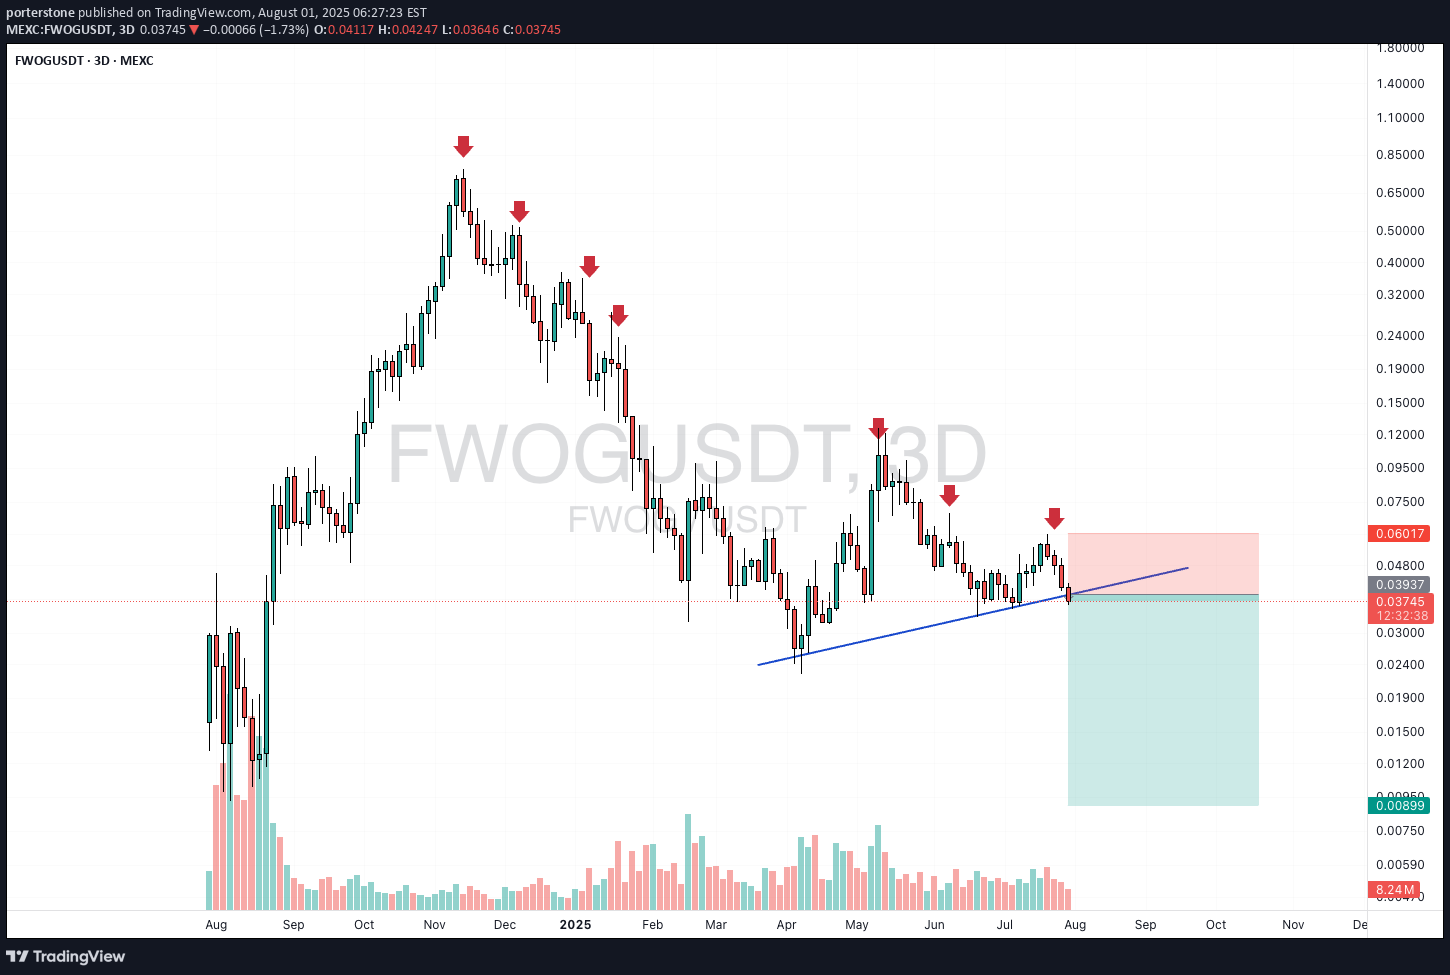
خیلی خوشبینانه است که این معامله رو انجام بدیم هنوز. فقط یه ایدهست.

achooooooooool
Charts talk

با توجه به برنامه ، هیچ چیز زیاد نیست. بیایید بعدی را ببینیم.

Tealstreet
$FWOG - Long Trade Idea

fwogusdt | 4 ساعت قیمت پشتیبانی پایه خود را در 0.0050 در بازه های زمانی پایین دوباره انجام داده است. 052-.050 را نگه دارید ، ما به طور بالقوه می توانیم با 0.065-0.068 به سمت میانه فشار بیاوریم اگر حرکت ادامه یابد و Bitcoin بالاتر از 104k باشد ، می توانیم سطح 0.074-0.080 را هدف قرار دهیم

stanleycrypto_1
$FWOG/USDT Ready to Fly

FWOGUSDT رسماً از روند نزولی طولانیمدت خود خارج شده و ناحیه مقاومت کلیدی را به حمایت تبدیل کرده است. پس از یک آزمایش مجدد تمیز از سطح شکست در حدود ۰.۰۷۰۲۱ دلار، قیمت دوباره قدرت نشان میدهد. با افزایش حرکت صعودی، این تنظیمات یک پتانسیل صعودی قوی ارائه میدهد و منطقه ۰.۵۲۴۲۴ دلار را هدف قرار میدهد که یک حرکت ۶۴۳ درصدی از اینجا است. تا زمانی که قیمت بالاتر از منطقه تقاضای سبز رنگ باقی بماند، این نمودار برای یک رالی قوی آماده به نظر میرسد. DYRO، NFA

raj231
Short term - FWOG -retrachment

الگوی FWOG سیگنال برگشت صعودی را نشان میدهد که با یک اصلاح جزئی همراه بود.

heszkewmeszkerampampam
Random Memecoin 500% or reset position

هر کی بزرگ بازی میکنه باید ببره. ارزهای دیجیتال بی فایده هستند و ارزش اونها بر اساس جامعه و تبلیغات بنا شده. BTC و بقیه به این زودی رشدی داشت. پس من میخوام پس اندازمو برای خرید 20 میم کوین تصادفی نابود کنم.

bullstraders7
FWOG LONG

همه ایدههای معاملاتی شامل نقطه ورود، حد ضرر، حد سود و سطح ریسک هستند. سلام معاملهگران، این تحلیل کامل این جفت ارز است. اگر سوالی دارید در بخش نظرات زیر بپرسید. ورود به معامله فقط در صورتی انجام میشود که تمام قوانین استراتژی رعایت شده باشد. پیشنهاد میکنم این جفت ارز را در لیست پیگیری خود نگه دارید و ببینید آیا قوانین استراتژی شما رعایت میشود یا خیر. لطفاً به «اطلاعیه مهم ریسک» که در زیر لینک شده است نیز مراجعه کنید. سلب مسئولیت
سلب مسئولیت
هر محتوا و مطالب مندرج در سایت و کانالهای رسمی ارتباطی سهمتو، جمعبندی نظرات و تحلیلهای شخصی و غیر تعهد آور بوده و هیچگونه توصیهای مبنی بر خرید، فروش، ورود و یا خروج از بازارهای مالی نمی باشد. همچنین کلیه اخبار و تحلیلهای مندرج در سایت و کانالها، صرفا بازنشر اطلاعات از منابع رسمی و غیر رسمی داخلی و خارجی است و بدیهی است استفاده کنندگان محتوای مذکور، مسئول پیگیری و حصول اطمینان از اصالت و درستی مطالب هستند. از این رو ضمن سلب مسئولیت اعلام میدارد مسئولیت هرنوع تصمیم گیری و اقدام و سود و زیان احتمالی در بازار سرمایه و ارز دیجیتال، با شخص معامله گر است.