
truepersonal
@t_truepersonal

ما هو الشيء الذي ننصحك بشراءه من المواد الغذائية؟
سابق في الشراء
پیام های تریدر
مرشح
truepersonal
BTC – History Doesn’t Repeat, but It Sure Rhymes
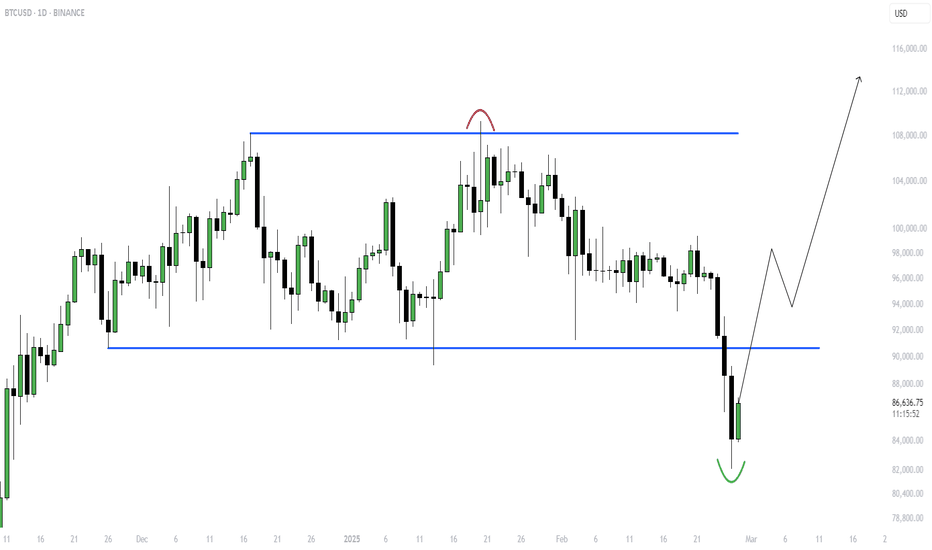
BTCUSD: بازبینی ساختارهای گذشته بازار، بسیار قابل توجه است که چگونه حرکت قیمت بیت کوین در اوایل سال 2025 شبیه الگوهای مشاهده شده در اوایل سال 2024 است. مقایسه بین این دو نمودار یک فراکتال واضح را نشان میدهد - یک انحراف تقریباً یکسان بالاتر از سقفهای محدوده، به دنبال آن یک رویداد نقدشوندگی زیر کفهای محدوده قبل از یک معکوس شدن. در اوایل سال 2024، قیمت بیت کوین بالاتر از محدوده تثبیت شده منحرف شد و معامله گران شکست را به دام انداخت، قبل از اینکه به سرعت رد شود و نقدینگی را زیر کفهای محدوده پاکسازی کند. آن انحراف، پایین ترین حد مطلق قبل از یک بهبود قوی را رقم زد، زیرا بازار کسانی را که منتظر قیمت های حتی پایین تر بودند، پشت سر گذاشت. اکنون، در اوایل سال 2025، ما شاهد یک تنظیمات به طرز عجیبی مشابه هستیم: 🔹 انحراف بالاتر از مقاومت که خریداران دیرهنگام را جذب کرد، به دنبال آن یک سقوط شدید زیر حمایت. 🔹 پاکسازی نقدینگی زیر کفهای محدوده، جایی که موقعیتهای خرید اهرمی بیش از حد متزلزل میشوند. 🔹 احساسات دوباره نزولی شده است، با این حال معاملهگران اکنون انتظار 70-75 هزار دلار را دارند، همانطور که سال گذشته 35-31 هزار دلار را پیشبینی میکردند. در حالی که من به طور کامل قیمت های پایین تر را رد نمی کنم، اما بعید می دانم که قیمت Bitcoin به اندازه ای که بسیاری انتظار دارند کاهش یابد. این فراکتال نشان می دهد که ممکن است در حال حاضر به کف نزدیک باشیم و برای یک معکوس شدن آماده شویم. به همین دلیل است که من در حال کاهش موقعیت های فروش حفاظتی خود و جمع آوری موقعیت های اسپات هستم. مثل همیشه، صبر کلیدی است - معکوس شدن های بازار زمانی اتفاق می افتد که اکثر افراد کمترین انتظار را دارند. مراقب همگراییها باشید، هوشیار بمانید و از قافله عقب نمانید.
truepersonal
RISK MANAGEMENT the most important setting?

Trading without a structured risk management strategy turns the market into a game of chance—a gamble with unfavorable odds in the long run. Even if you possess the skill to predict more than half of the market's movements accurately, without robust risk management, profitability remains elusive. Why? Because no trading system can guarantee a 100% success rate. Moreover, the human element cannot be disregarded. Over your trading career, maintaining robotic discipline, free from emotional or impulsive decisions, is challenging. Risk is inherently linked to trading—it represents the potential for financial loss. Continually opening positions without considering risk is a perilous path. If you're inclined to take substantial risks, perhaps the casino is a more fitting arena. In trading, excessive risk doesn't correlate with greater profits. This misconception often leads beginners to risk excessively for minimal gains, jeopardizing their entire account. While eliminating all risk is impossible, the goal is to mitigate it. Implementing sound risk management practices doesn't guarantee profits but significantly reduces potential losses. Mastering risk control is pivotal to achieving profitability in trading. A risk management system is a structured framework designed to safeguard trading capital by implementing specific rules. These rules aim to mitigate potential losses resulting from analytical errors or emotional trading decisions. While market predictions can be flawed, the margin for error in risk management should be minimal. Key Principles of Risk Management: 1. **Implement a Stop Loss:** - While this might seem elementary, it's often overlooked. - Many traders, especially when emotions run high, are tempted to remove or adjust their stop loss when the market moves unfavorably. - Common excuses include anticipating a market reversal or avoiding a "wasted" loss. - However, this deviation from the original plan often leads to larger losses. - Remember, adjusting or removing a stop loss is an acknowledgment that your initial trade idea might be flawed. If you remove it once, the likelihood of reinstating it when needed diminishes, clouded by emotional biases. - Stick to your predetermined stop loss and accept losses as part of the trading process, void of emotional influence. 2. **Set Stop Loss Based on Analysis:** - Never initiate a trade without a predetermined stop loss level. - Placing a stop loss arbitrarily increases the risk of activation. - Each trade should be based on a specific setup, and each setup should define its stop loss zone. If there's no clear setup, refrain from trading. 3. **Adopt Moderate Risk Per Trade:** - For novice traders, a recommended risk per trade is around 1% of the trading capital. - This means that if your stop loss is hit, the loss should be limited to 1% of your total account balance. - Note: A 1% risk doesn't translate to opening a trade for 1% of your account balance. Position sizing should be determined individually for each trade based on the stop loss level and total trading capital. By adhering to these risk management principles, traders can build a solid foundation for long-term success in the markets, safeguarding their capital while allowing for growth opportunities. In the scenario of a losing streak—let's say five consecutive losses—with a conservative risk of 1% per trade, the cumulative loss would amount to slightly less than 5% of your trading capital. (The calculation of 1% is based on the remaining balance after each loss.) However, if your risk per trade is set at 10%, enduring five consecutive losses would result in losing nearly half of your trading capital. Recovering from such losses, especially with a high-risk approach, presents a significant challenge. The table below illustrates this challenge: if you lose 5% of your capital (approximately five losing trades), you would need to generate a mere 5.3% profit to break even—equivalent to just one or two successful trades. However, if you overextend your risk and suffer, for instance, a 50% loss, you would need to double your remaining capital to restore your original deposit. 4. Utilize a Fixed Percentage of Risk, Not a Fixed Amount for Position Sizing Position sizing should be dynamic, tailored to both your predetermined risk percentage and the distance to your stop-loss level. This approach ensures that each trade is individually assessed and sized according to its unique risk profile. In the following section, we will delve into the methodology for calculating position size for each trade. 5. Maintain Consistent Risk Across All Positions While different trading styles like scalping, intraday, and swing trading may warrant varying risk levels, it's crucial to cap your risk at a reasonable threshold. A general guideline is to not exceed a 5% risk per trade. For those in the early stages of trading or during periods of uncertainty, a risk of 1% or less is advisable. The table below offers an illustrative example of the outcomes achievable by adhering to risk percentages tailored to individual trades. Regardless of your confidence level in the potential profitability of a trade, maintaining consistent risk per trade is paramount. 6. Avoid Duplicating Trades Based on the Same Setup Opening identical trades based on a single setup doubles your exposure to risk. This principle is especially pertinent when dealing with correlated assets. If you identify a favorable combination of factors across multiple trading pairs, opt to execute the trade on the pair where the setup is perceived to have a higher probability of success. 7. Aim for a Risk-to-Reward Ratio of at Least 1:3 The Risk-to-Reward (RR) ratio measures the potential profit of a trade relative to its inherent risk. A RR ratio of 1:3 signifies that for every 1% risked through a stop-loss activation, a trader stands to gain 3% of their deposit upon a successful trade. With a 1:3 RR ratio, a trader doesn't need to be correct on every trade. Achieving profitability in just one out of every three trades can result in a net positive outcome. While RR ratios of 1:1 or 1:2 can also be profitable, they typically require a higher win rate to maintain profitability. For instance, if you're willing to risk 1% to gain 1%, you'd need at least 6 out of 10 trades to be profitable to yield a positive return. It's worth noting that a high RR ratio doesn't guarantee profitability. It's possible to have trades with a 1:6 or greater RR ratio and still incur losses if the win rate is insufficient.
truepersonal
BTC - Expecting new all-time highs soon

یعد التحلیل الکفء للأنماط التاریخیة أمرًا بالغ الأهمیة؛ غالبًا ما یؤدی الفشل فی استخلاص الأفکار من الماضی إلى تکرار الأخطاء. هذه البدیهیة لا تنطبق فقط على مجال التداول ولکنها تمتد إلى جوانب أوسع من الحیاة. تتکشف القصة مع انهیار خط الاتجاه الهابط، وبعد ذلک یتشکل مثلث صاعد تتبعه حرکة اتجاه جدیدة بعد الخروج من المثلث الصاعد، ننتقل إلى خای العالمی، ونجمع نقاط التوقف (التوحید)، ونتماسک فی الأعلى ونتبع الاتجاه
truepersonal
The whole truth about trading - playing against fate

It is apparent that your interest in trading stems from a desire to transcend the conventional 9 to 6 work regimen or to establish an additional revenue stream for enhanced financial stability. Regardless of the impetus, trading imbues one with a sense of hope—a hope for attaining financial autonomy and catering to the exigencies of one's familial responsibilities. Nevertheless, hope unaccompanied by acumen proves inadequate in the realm of trading. Are you prepared to delve into the intricacies of trading in its entirety? Can you harness the mechanisms of trading to your advantage and prosper therein? Trading is a means of slow enrichment For many, the following assertion may not be warmly received, yet it warrants acknowledgment: Trading serves as a gradual enrichment scheme. While anecdotes exist of traders who commenced with modest capital and ascended to seven-figure balances, such instances are rare. The reality is stark: the odds of such success are exceedingly slim. The allure of amassing substantial wealth swiftly is tempting, but it often necessitates assuming excessive risk. Only those blessed with exceptional luck may realize significant gains in short order. Conversely, the vast majority—99.99%—who pursue this path find themselves depleting their initial investment. Merely a fortunate minority attain even modest profits, and their success is often attributed more to chance than skill. Consider the perspective of Warren Buffett, whose wealth is renowned: "My wealth is a product of American residency, fortuitous genetics, and the power of compound interest." The crux lies in compound interest—the gradual accumulation of profits over time. Buffett's ascent to becoming the world's wealthiest investor spanned decades, not mere weeks or months. Hence, if one views trading as a shortcut to affluence, disillusionment is inevitable. You need money to make money from trading One of the most pervasive trading fallacies is the belief that possessing a profitable trading strategy guarantees the potential to amass millions in the market—a notion that has ensnared many traders. While it is feasible to develop a lucrative strategy, its profitability alone does not guarantee the attainment of vast wealth. Why? Because the magnitude of your initial deposit plays a pivotal role. Consider this scenario: Suppose you possess a trading strategy yielding a 20% annual return. With an account balance of $1,000, your potential earnings amount to $200 per year. With $10,000, your potential earnings escalate to $2,000 annually. Scaling up further, with a $1 million account, potential earnings soar to $200,000 per year. This illustrates that while a trading strategy is undeniably significant, it represents only one facet of the equation. Equally crucial is the size of your trading account. This elucidates why hedge funds attract vast sums—often in the millions, if not billions of dollars—since substantial capital is indispensable for maximizing returns from trading endeavors. Trading is one of the worst ways to earn a regular income Trading is often sought out by individuals seeking an alternative income stream, aiming to liberate themselves from the confines of a conventional 9 to 6 job in pursuit of pursuing their passions. However, it is crucial to confront a sobering reality: trading stands as one of the least reliable avenues for securing a consistent income. Why? The dynamics of financial markets are inherently mercurial. A strategy that yields profits one week may falter the next. This isn't to suggest that such strategies become entirely obsolete, but rather that market conditions necessitate adaptability. Realigning a strategy to suit evolving market dynamics demands time—a commodity not readily available in the fast-paced world of trading. This adjustment period could extend over several weeks or even months. Consequently, anticipating profits on a daily, weekly, or even monthly basis proves unrealistic. Success in trading hinges upon one's ability to capitalize on market opportunities as they arise, accepting the yields bestowed by the market, and refraining from unrealistic expectations of consistent returns. You're always studying the markets Continuous learning is indispensable for success in trading. Reflecting on my own journey, I initially gravitated towards indicators and price action trading, convinced that these tools alone would suffice for profitability. However, this mindset hindered my progress, as I neglected broader market perspectives. Recognizing the limitations of my approach, I embarked on a journey of exploration. I delved into the practices of accomplished traders, discovering diverse strategies such as trend trading, system trading, and mean reversion trading. Today, my repertoire encompasses multiple trading strategies across various markets. This diversified approach has engendered a more consistent capital curve, enhancing my overall returns. The pivotal lesson gleaned from this experience is clear: achieving profitability in trading does not signify the culmination of one's learning curve. On the contrary, ongoing education and exploration of the markets remain imperative for sustained success. How do you become a successful trader when all the odds are against you? Embrace Existing Solutions: Attempting to forge your own path in trading can prove both time-consuming and costly. Instead, seek out established trading algorithms equipped with tested and proven trading rules. Consider investing in algorithms like mine, which come backed by historical testing results. Maintain Financial Stability: Relying solely on trading for income places undue psychological pressure on yourself. The imperative to generate monthly income often leads to hasty and ill-advised trading decisions. Many seasoned traders, therefore, diversify their income streams. For instance, some engage in mentorship or operate hedge funds that levy management fees irrespective of market performance. By securing a stable income through alternate means, you can focus on trading without financial anxiety. Harness the Power of Compound Growth: Albert Einstein hailed compound interest as the eighth wonder of the world. Yet, I propose introducing you to the ninth wonder: the regular infusion of funds to augment profits. Consider this scenario: with an initial $5,000 investment earning an average annual return of 20%, you would amass $191,688 over 20 years. However, by adding an additional $5,000 to your account annually and compounding profits, your total would skyrocket to $1,311,816 over the same period. Witness the transformative potential of consistent contributions and compounding gains.Define Clear Goals and Plans: Set specific, measurable, achievable, relevant, and time-bound (SMART) trading goals. Develop a well-defined trading plan that outlines your strategies, entry and exit criteria, risk management rules, and contingencies for various market scenarios.
truepersonal
ALL ABOUT FIBONACCI
تعمل مستویات تصحیح فیبوناتشی کأدوات لا غنى عنها لتقییم احتمالات الارتداد وتحدید الأهداف هذا المخطط التحلیلی هو الأکثر فعالیة فی اتجاهات السوق. فی السوق ذات الاتجاه التصاعدی، هدف المتداولین هو تحدید إمکانیة التصحیح وتحدید نقاط الدخول بشکل استراتیجی للصفقات الطویلة. على العکس من ذلک، فی الاتجاه الهبوطی، یتحول الترکیز إلى تقییم إمکانات التصحیح وتحدید نقاط الدخول التکتیکیة للمراکز القصیرة. من خلال استخدام مستویات فیبوناتشی بدقة وبصیرة، یمکن للمتداولین التنقل فی دینامیکیات السوق بمزید من الوضوح والبصیرة الاستراتیجیة. قواعد التشغیل: ● تحدید الاتجاه والعمل وفقاً له ● لتحدید إمکانیة التصحیح للاتجاه الصعودی، استخدم الشبکة الموجودة بالأسفل للأعلى. ● لتحدید إمکانیة التصحیح للاتجاه الهبوطی، استخدم شبکة من أعلى إلى أسفل. ●ابحث عن التأرجح العالی والتأرجح المنخفض لتصحیح استخدام الأداة. 1. بالنسبة للاتجاه الصعودی، تمتد شبکة فیبوناتشی من HL إلى HH. بعد کسر الاتجاه الهبوطی من LL إلى HH. 2. بالنسبة للاتجاه الهبوطی، تمتد شبکة فیبوناتشی من LH إلى LL. بعد کسر الاتجاه الصعودی من HH إلى LL. إعدادات الحرکات التصحیحیة: 0.5 - السعر العادل (التوازن). 0.62؛ 0.705؛ 0.79 - منطقة OTE (الدخول الأمثل فی الصفقة). على عکس القیم القیاسیة، هذه نسخة معدلة مع أعلى توقع ریاضی لانعکاس السعر. لفتح مرکز، نحن مهتمون دائمًا بسلوک السعر أعلى أو أقل من القیمة 0.5. سوف تتطلع الأموال الذکیة دائمًا إلى الشراء بسعر مخفض والبیع بسعر أعلى. لذلک، لفتح مرکز بیع، ننظر دائمًا إلى السعر فوق 0.5، والذی یعتبر علاوة. ولفتح صفقات طویلة، ننظر إلى سلوک الأسعار أقل من 0.5، والتی تعتبر أسعار مخفضة. منطقة OTE عبارة عن شبکة ممتدة تکون دائمًا فی السوق المتمیزة عندما تبحث عن مرکز بیع، أو فی سوق الخصم عندما تبحث عن مرکز طویل. هذه المستویات act کمنطقة لنقطة الدخول المثالیة. تصحیح الاندفاع الصاعد. خطوط فیبوناتشی نفسها لا act کمستویات دعم أو مقاومة. ولا یجوز التجارة إلا على أساسها. یتحول السعر من مناطق محددة یتم عرضها على الرسم البیانی. تصحیح الاندفاع الصاعد. قد یتجاوز السعر OTE، وهذا لا ینفی أهمیة الإعداد، ولا یزال HL قید التشکیل فی سوق الخصم. تصحیح الاندفاع الصاعد. لیس فی جمیع الحالات، یصحح السعر إلى منطقة OTE: عندما یصل إلى منطقة الدعم عند مستوى 50٪ (التوازن) أو أقل بقلیل من ذلک، قد یبدأ الانعکاس بالفعل، لأن هذه اللحظة تعنی بالفعل بدایة الشراء أو البیع المال الذکی. تصحیح الاندفاع الهبوطی. اجعل من القاعدة عدم فتح المراکز إلا بعد التصحیح فی سوق العلاوة أو الخصم، وتخطی الفرص الأخرى. جنی الأرباح وفقا لفیبوناتشی من أجل تحدید المکان الذی ستأخذ منه الأرباح، یمکنک استخدام القیم السلبیة. إعدادات الإعداد تستغرق: -0.27 - خذ 1 -0.62 - خذ 2 -1 - خذ 3 أو أغلق المرکز -1.5 / -2 - خذ 4 خذ فیبوناتشی یمکن استخدام قیم فیبوناتشی السلبیة بشکل فعال فی کل صفقة، ولکن حاول إعطاء الأولویة للرسم البیانی لتحدید مناطق أکثر دقة حیث قد ینعکس السعر. التجارة النشطة: مثال جید ومنتظم
truepersonal
MFI INDICATOR - STRATEGY FOR TRADING
Indicator MFI — model Incorporating technical indicators into your trading system requires a clear understanding of their fundamental principles. An innovative solution developed by Gene Cuong and Avrum Sudak allows the use of volumetric data in metric analysis. The Cash Flow Index serves as a graphical representation of the "cash ratio", requiring a preliminary derivation of the "cash ratio" and subsequent calculations, including the determination of typical price and cash flow. Similar to the relative strength index, the cash flow index is based on the concept of a “typical price,” calculated as the average of the high, low, and closing prices over a specified period of time. For example, if the daily time frame has a high of 70,000, a low of 65,000, and a closing price of 68,000, the typical daily price is calculated as follows: Typical daily price = (70000 + 65000 + 68000)/3 = 67666 Cash flow is then determined by multiplying typical price by volume: Cash Flow = Typical Daily Price * Volume. Comparing the resulting cash flow with the previous day's cash flow makes it easier to identify positive or negative trends. Positive cash flow indicates an increase, while a negative cash flow indicates a decrease. Cases of equivalent cash flow values are not taken into account. When positive and negative cash flows can be distinguished, the cash ratio is calculated by dividing the former by the latter: Cash Ratio = (Positive Cash Flow / Negative Cash Flow). Using this data, the cash flow index (MFI) can be calculated using the formula: MFI = 100 - (100/(1 + Money Factor)). Gene Cuong and Avrum Sudak have delineated three primary signals employed by the Cash Flow Index: Overbought or Oversold Levels: Traders strategically monitor for overbought or oversold conditions as indicators of unsustainable price extremes, signaling potential market corrections. Bullish and Bearish Divergences: Analysis of bullish and bearish divergences serves as a predictive tool for identifying potential trend reversals. Discrepancies between the direction of price movements and corresponding Cash Flow Index trends can offer valuable insights into shifting market dynamics. Fluctuations at 80 or 20 Levels: Observing fluctuations in the indicator readings around the 80 or 20 thresholds enables traders to discern potential market reversals. These pivotal levels serve as crucial points of reference, guiding traders in assessing market sentiment and making informed trading decisions. Determining overbought and oversold zones using the cash flow index While the relative strength index (RSI) and other oscillator-type technical indicators are capable of identifying overbought and oversold market conditions, the money flow index (MFI) stands out for its effectiveness in this area. Including additional volume information allows the MFI indicator to filter out false signals from overbought and oversold conditions, increasing its reliability, especially for traders looking to counter prevailing trends. Like most momentum indicators, the Money Flow Index ranges from 0 to 100. A Money Flow Index reading below 20 indicates an oversold signal. Conversely, a Cash Flow Index reading greater than 80 suggests an overbought scenario. One limitation of trading based solely on overbought and oversold signals is the inability to counter the current trend merely due to signals generated by the Money Flow Index (MFI). Optimal trading strategy involves exercising patience and waiting for a price action pattern to validate a shift in the prevailing trend before taking a position. By employing this approach, traders can make more informed decisions and reduce the risk of entering positions prematurely based solely on MFI signals. The MFI Indicator and Divergence Beyond its function in pinpointing overbought and oversold conditions, the Money Flow Index (MFI) indicator serves as a valuable tool for detecting divergence within the market. In essence, divergence manifests when the price moves in one direction while the indicator readings depict a contrary trend. Traders regard this occurrence as a strong indication that the price is poised to reverse in alignment with the technical indicator's trajectory. Utilizing the MFI indicator enables traders to readily recognize such signals, whether they manifest as bullish or bearish divergence. Bullish Divergence: Bearish divergence: What Should You Consider? By integrating volume into its mathematical framework, the Money Flow Index is adept at generating highly precise trading signals concerning overbought and oversold market conditions. Additionally, it demonstrates a notable ability to pinpoint emerging divergences within the market. However, like any technical indicator, it possesses inherent limitations. A primary constraint of the Money Flow Index is its propensity to persist in overbought or oversold states for extended durations, potentially leading to false signals. Yet, by crafting a trading strategy that incorporates price action signals, traders can harness the MFI indicator to identify potential reversal zones. Armed with this insight, traders can anticipate shifts in directional price movement with ease and strategize their trades accordingly. Summing It Up: The Money Flow Index stands out as a unique indicator amalgamating momentum and volume within the RSI formula. Its strength lies in its adeptness at identifying potential reversals through overbought or oversold levels, as well as bullish or bearish divergences. Nonetheless, prudent utilization of the Cash Flow Index entails supplementing its readings with additional technical indicators rather than relying solely on its signals.With the right approach and taking into account the context, the tool becomes very effective and usefulEffectively depicting oversold conditions, the Money Flow Index serves as an excellent supplementary tool for enhancing the likelihood of successful transactions.Consider this example: A bearish divergence is observed in the market, indicating a potential reversal. However, the Money Flow Index (MFI) does not reach the oversold zone, stopping instead at 80. Nevertheless, upon examining higher timeframes, such as the weekly chart, it becomes evident that a significant imbalance has been filled. This imbalance serves as one of the confirmations suggesting that the price is likely to decline further. In this scenario, the combination of the bearish divergence and the fulfillment of a significant imbalance on a larger timeframe strengthens the indication of a downward movement in price, augmenting the likelihood of a successful transaction.These indicators also work well on lower timeframes - like 1 hourGood context is a good indicatorExample with divergence, overbought and retest support zoneAccurate contextualization significantly enhances the potency of the Money Flow Index (MFI) tool.Trust?
truepersonal
Level breakdown. The most effective setups

What is a level breakout? A breakout is the price's consolidation above a certain level followed by further movement in the direction of the breakout. But the immediate question that should arise in your mind is about the consolidation of price, as it might be difficult for inexperienced individuals to understand. However, there is nothing overly complex about it either; consolidation refers to the candle closing above the level A breakdown can occur at a horizontal or inclined level. Bullish breakout: We observe a trending market encountering resistance at a horizontal level. After two unsuccessful attempts, the price breaks through the level. Bearish breakout: Why do level breakouts work? Imagine a scenario: a strong resistance level on the chart is heavily defended by bears, preventing the price from breaking through. Despite several attempts, the bears hold their ground until the bulls come to the rescue. They overpower the bears, but their strategy doesn't end there. Instead of retreating, they press forward, driving the opposition towards the next resistance level, where the cycle repeats. Breakouts occur when the price breaches a significant level. Observing price movements on a chart reveals that prices often consolidate and encounter specific levels. When the price reaches a level and swiftly reverses, it indicates the strength of that level. Upon a price retest of this level, careful monitoring is essential to anticipate a potential breakout. Repeated tests of the same level signify its strength, yet eventually, the price will break through any level. This is when traders should be prepared to initiate a breakout trade. Breakouts offer lucrative trading opportunities because they often mark the inception of new price movements and trends. By entering trades at the onset of emerging trends, traders position themselves for potential profits. Moreover, reliable breakouts typically occur during periods of robust price momentum when traders seek to capitalize on rapid price fluctuations. Breakouts occur at important price levels. It can be: Support or resistance levels. Patterns Market highs or lows. Trend lines. Price channels. Moving averages. Fibonacci levels. One reason breakouts can lead to rapid price movements is due to the attention they attract from market participants monitoring key levels. When one group of traders capitalizes on a breakout, another group is compelled to swiftly exit their losing positions, resulting in sharp price fluctuations post-breakout. There exist various types of breakouts, and as traders, our objective is to identify high-probability breakout opportunities and initiate trades. However, this task is not always straightforward. Consequently, levels marked at potential breakout points should be regarded as zones rather than rigid lines. Identifying Psychologically Important Levels: Repeated testing of a specific zone by the price often signifies its significance. Having reached a certain level, the price enters a sideways movement, forming a consolidation. Using a rectangle, we outline the area encompassing the lower wicks of the candles, delineating our support/resistance area. When trading breakouts, it is wise to wait until the candle closes outside the support or resistance area to confirm the breakout. Triangles are chart patterns indicating price compression, often culminating in a breakout. The direction of the breakout is typically uncertain. Within the circle, you can observe the precise location of a potential breakout. Notably, there is a robust breakout momentum evidenced by several full-bodied candles. Subsequent to breaching the upper level of the triangle, the price retraces to test the previously breached resistance, now acting as a support area. This pullback serves as a crucial confirmation signal. Breakouts and false breakouts: Typically, candlestick shadow breakouts are not considered true breakouts. A true breakout occurs only when the price finally closes outside the level. This approach provides a more secure entry point, making it easier to open positions in the appropriate direction. The upper rectangle constantly holds down the price, with the exception of some candles, characterized as a pin bar. This represents an initial false breakout as only one candle breaks the resistance area but fails to close, leaving its body above that area. Therefore, we classify this signal as false. However, the subsequent pin bar pushes the price higher, causing the candle to close above the resistance area. This is a genuine breakout signal, especially enhanced by the presence of a strong, saturated breakout candle. Trading Breakouts: Trading market breakouts carries inherent risks due to the prevalence of false breakouts, which are statistically more common. Therefore, it is extremely important to understand the market structure and monitor the movement of prices to the appropriate level. Markets operate in cycles, moving between trending phases and periods of consolidation. The duration of market consolidation correlates with the strength of subsequent breakouts and subsequent trends. Prolonged consolidation periods are not only observed by you, but by traders worldwide. Among them, some opt for trading bounces from levels, while others prefer trading breakouts. Extended consolidation behind a resistance level can trigger stop-loss orders for many bears and prompt numerous bulls to initiate new buying positions. Consequently, after prolonged periods of flat movement, prices frequently surge explosively following a breakout, ushering in a robust trend. The breakout trading strategy offers multiple entry approaches, allowing traders to select the one that aligns best with their preferences and objectives. Entering the breakout after the price has consolidated beyond the zone: One strategy assumes that the breakout occurred when the candle closed outside the level. While this pattern can be effective, I personally find it risky due to the many nuances associated with this strategy. Instead I prefer a different approach... Breakout entry with retest: This tactic is a bit more challenging as it requires patience and discipline. What particularly appeals to me in this strategy is that I rely on additional data during a potential retest (with a 60-70% likelihood after the zone is breached). Breakout of the symmetrical triangle pattern: As the market tightens its consolidation, it eventually breaches the support of the triangle, followed by a retest of this level as new resistance. For the stop-loss placement, it's advisable to position it inside the triangle above the breakout candle. Regarding take profit, we target the nearest level, ensuring the risk-to-reward ratio remains acceptable. Best Breakout Trading Method: Accumulation of positions/liquidations - consolidation. When a tight consolidation occurs near a resistance level, it tells us that buying pressure remains high for a long period of time and sellers do not have enough strength to reverse the price from the level. When the price breaks through a resistance level, traders with short positions cut their losses. At the same time, the pressure from buying traders who will open breakout transactions is increasing. All these factors cause the price to rapidly move up without significant pullbacks. __________________________________________________________________________________ I have only covered a portion of the basics. Of course, trading involves various elements such as price action, indicators (divergences), but that would make this post too long ;) If you enjoy my educational articles, please leave comments, and I'll continue writing them.A good, global example with the most liquid assetsThere are only 2 tools - a trend line and support, which were given to us by many setupsJust like in the bookWho seeks will always find ;)A precisely defined support or resistance zone presents lucrative trading opportunities.A striking example of consolidation before breaking through resistance, accumulation of liquidity on top and subsequent withdrawalWhat kind of denouement awaits us?We approached the resistance zone several times and each time left a large share of new liquidations on top It seems that the zone is working, more and more people are placing stops for it, what happened next - you can see for yourself
truepersonal
You Must See This - Analysis VET

أهلاً بکم، أرید أن أقدم تحلیلا فیتودت نتداول حالیًا فوق منطقة الدعم strong فی نطاق 0.037 إلى 0.039. علاوة على ذلک، فقد أنشأنا اتجاهًا صعودیًا یبدأ حول 0.015. هدفنا الأولی هو إزالة السیولة من (x) ثم اختبار منطقة المقاومة الواقعة بین 0.060 و 0.068. تحتاج إلى مراقبة استقرار منطقة الدعم بعنایة أثناء إعادة الاختبار. أنا أمیل نحو حرکة سعریة تصاعدیة للأصل.
truepersonal
Trend lines - how to build them and how to use them?
Before we dive into the world of trend lines, I recommend familiarizing yourself with the support and resistance zone https://www.tradingview.com/chart/BTCUSDT/nFJAmk2S-Support-and-Resistance-levels/ Here we go: Trend lines are one of the most universal tools for trading in any market, used in intraday, swing and position trading strategies. Properly drawn on charts, they help to predict the direction of price movement and identify trend reversals. In addition, trend lines help you to accurately determine the optimal entry and exit points, as well as set a stop loss. It is recommended not to rely on trend lines alone, but to integrate them with other methods of technical analysis, expanding your trading arsenal. Often many traders draw too many lines, it is uninformative and useless How to place trend lines on a chart? An uptrend is a combination of at least two pullbacks Similar in a downtrend: Instructions for markings: Find at least two points on the chart Connect them with a line But, let's remember the Axiom: 1. Randomness 2. Coincidence. 3. Regularity Until a trendline is pushed back a third time - it is considered unconfirmed... Once the third bounce has occurred, the line can be considered valid, but does not guarantee that it will necessarily bounce the fourth time! Like all patterns in the market, trend patterns can be drawn on any timeframe, also - they are more effective on older ones (as well as all others) How to use trend lines in your trading? Frequent trades from a trend line are rebound or breakout trades Example: Trendline confirmed (bounced three times) - on the fourth approach we can pay attention - what happens next? Price will either bounce from our trendline again or there will be a breakout Next example: How can we determine whether there will be a breakout or a bounce? As I said before, you need to take into account the context: indicators, price action, nearby levels and so on (it all depends on your psychology) How do trend lines fit together? Support and resistance levels are areas on a chart that indicate potential pressure (on a side) The same principle applies to trend lines. The only difference is that trend lines are sloped rather than horizontal. How to properly label/draw trend lines? Which trend lines are important and which ones should be ignored? Focus only on the major pivot points Connect at least two major pivot points. Adjust the slope of the line to get the most amount of price touching the line, whether it is the shadows of candles or their bodies. Important clarification - trend lines represent a support zone, not specific levels. How can you use trend lines? The trend is our friend. Where the trend goes, so goes we. Trading against the trend is foolish. If you do decide to do it, it must be justified! Trend lines are the direction of the current market. Also the trend line itself can be divided into two positions: If the trend becomes flatter, it means that the market is moving into a state of consolidation If the trend is becoming steeper, it means that the trend is getting stronger (or perhaps it is reaching its climax and is approaching its final stage). Trend Lines Entry Point: Like all other patterns in technical analysis or price action - trend lines can help you find a more favorable entry point in terms of risk-to-reward ratio How to use a trend line to identify a market reversal? Chances are you have encountered this before. There is a trend line breakout, you are already expecting a trend reversal, but the market continues its original movement Like all indicators/patterns - not a panacea. Each strategy has its own risks, just when we add other osnovnopologologayuschih signs to one strategy, the chance of risking a loss - decreases! Technique for determining a trend reversal: Wait for a trend breakout Wait for a lower low/maximum to form. If the price breaks the previous minimum/maximum, most likely the trend will go in the direction of the breakdown...A great example from the theoryA good example with a bounce from the trendline to the first targetThat's a great double example!Good pricing, if the price goes according to this plan, you can expect something like thisGiven the circumstances, we could have executed at least one strong, confident trade within this trend. However, we had the option to wait for the breakdown and trade from the retest, which is often considered the most reliable approach. As I've mentioned before, it's essential to remember that relying solely on the trend is not always foolproof.A retest of the uptrend is anticipated in the near future. Your strategy should hinge upon observing the market's reaction, ensuring to await a genuine breakdown or retest before making any moves.Also, great exampleAnother example of a good trendPrice action analysis is the cornerstone of fundamental chart analysis, focusing solely on candlestick patterns. It embodies an entire art form that delves into the intricacies of psychology and strategic maneuvering. Moreover, it is extremely important to regularly switch to lower time frames to effectively gauge the market reaction and determine a favorable risk-reward ratio.Break of the downtrend and rebound from the last support zoneAn excellent example of a confirmed uptrend followed by a breakout and retestA great example of recent workTo uncover genuine trading opportunities rather than mere remnants, one must devote considerable time to meticulous analysis of the charts.Excellent example with trend support and consolidation before breaking resistanceA great area to look for setups into long positionsAfter breaking through support and trading above it, we formed a downward trend, subsequently broke through it, fixed ourselves with a candle above and continued to grow
truepersonal
DOT - Opportunity to catch a 20% correction

تحیاتی للجمیع! أود أن أشارککم تحلیل DOT (Polkadot). لقد نجحنا فی الخروج من الهیکل التنازلی، مما یشیر إلى الانتقال إلى الهیکل الصاعد. ومع ذلک، فإن هذا لا یمنعنا من البحث عن تداولات تصحیحیة قصیرة المدى لأسباب وجیهة. نشهد حالیًا ملء الخلل الشهری فی النطاق 11.14 - 14.18. ضمن هذا النطاق توجد منطقة اختلال أسبوعیة تمتد من 11.81 إلى 13.03. مع وجود نسبة مواتیة للمخاطرة والمکافأة، قد نفکر فی الخروج من هذه المنطقة. قد یکون هدفنا هو القضاء على التسعیر غیر الفعال على الإطار الزمنی لمدة ساعتین (FVG).
إخلاء المسؤولية
أي محتوى ومواد مدرجة في موقع Sahmeto وقنوات الاتصال الرسمية هي عبارة عن تجميع للآراء والتحليلات الشخصية وغير ملزمة. لا تشكل أي توصية للشراء أو البيع أو الدخول أو الخروج من سوق الأوراق المالية وسوق العملات المشفرة. كما أن جميع الأخبار والتحليلات المدرجة في الموقع والقنوات هي مجرد معلومات منشورة من مصادر رسمية وغير رسمية محلية وأجنبية، ومن الواضح أن مستخدمي المحتوى المذكور مسؤولون عن متابعة وضمان أصالة ودقة المواد. لذلك، مع إخلاء المسؤولية، يُعلن أن المسؤولية عن أي اتخاذ قرار وإجراء وأي ربح وخسارة محتملة في سوق رأس المال وسوق العملات المشفرة تقع على عاتق المتداول.