
trade-God
@t_trade-God

ما هو الشيء الذي ننصحك بشراءه من المواد الغذائية؟
سابق في الشراء
پیام های تریدر
مرشح
trade-God
A Tolled Bell
الجرس الأول رونج. یتم رصف الجسر عبر نطاق 6000 دولار. إذا انفجرت ، فمن المحتمل ألا یحدث ذلک حتى یتم بناء الجسر وتحسن المشاعر. توقع بعض المساعی القلبیة لتصویر أکثر من 6660 دولار. القضیة الأساسیة هی سوق السلطعون على المدى الطویل.
trade-God
trade-God
Goldaholics Anonymous

Pour yourself a glass of Goldschläger and let's review the 12 steps before diving into this. 1. We admitted that we were powerless over the Fed -- that our balance sheet had become unmanageable. 2. Came to believe that a Power greater than our central bank could restore us to solvency. 3. Made a decision to turn our fiat over to the care of sound money, as we understood it. 4. Made a searching and fearless inventory of our finances. 5. Admitted to Peter Schiff, Lyn Alden, and Pomp the exact nature of our wrongs. 6. Were entirely ready to have big, fat Gains. 7. Humbly asked to avoid getting short squeezed. 8. Made a list of all the naysayers about to be harmed. 9. Sent direct messages to them to gloat in victory. 10. Continued to count our gains and polish our bullion. 11. Sought through fundamental and technical analysis to improve our entries and exits. 12. Having had a financial awakening as the result of these steps, we tried to carry this message to other goldaholics, and practice these principles in all of our trades. Macro Fibonacci Below we can see the magic of Fibonacci extensions, measuring the last macro bull run to the 2016 low. Zooming in a bit, it is clear that these levels attract attention. Each one of these fibs acts as a step in the staircase. All we need to do is look at volume and price action to validate each level. The smart money had their sell orders at the 0.618 Fibonacci extension. The 0.5 could not hold which indicates that the next level down will be tested. Watch for heavy volume to come in there near the 0.382 level. In the U.S. stock market and many other developed financial markets, about 70-80 percent of overall trading volume is generated through algorithmic trading. Historical Price Action Looking back to the last bull run there are a few simple patterns to watch for... 1. Weekly MACD flailing around above the zero level. 2. Mark the down trends and wait for the break. 3. Price action is above the 20 Week EMA. Trading Setup Using historical price action the trading setup becomes clear... 1. Weekly MACD is flailing above the zero level. 2. The down trend line is clear. Wait for the break. 3. Wait for 20 Week EMA support. Now, the targets are the Fibonacci levels above, and the ghost bars look reasonable, however, it would be wise to take a look at what exactly is driving Gold on this path. The U.S. Dollar The Dollar index inversely pressures Gold prices so this is worth noting. 1. Momentum is shifting bullish as a bullish MACD divergence reveals itself on the daily chart. 2. This recent move was the 3rd wave down which often precedes a reversal. 3. The index is at the bottom of this future channel. As this index recovers back towards the 200 Week EMA, it will surely scare the metals market. However, the macro downtrend is only on it's first wave down. From a technical standpoint, the second wave is often the deepest as panic sets in from the failed recovery. Treasury Yields Yields recently had a similar bullish MACD divergence with a very weak recovery that followed. The trend is still clear and it's highly likely to roll over as it timidly approaches the trendline in the coming months. Gold has been riding along side Bonds so this should continue to drive up prices. Depending on the severity of falling yields, it could trigger temporary crashes in the metals. But longer term, buying the dips is the way to go. Trading is risky. Don't do it. Long Bullion: Gold, Silver, Platinum Equities: GDX, PHYS, CEF, SLV, RIO, SPPP Futures: (Not yet)Comment: 1. The daily MACD has crossed above zero... 2. The price action is supported, for now, above the fib level... 3. Sort of broke the down trend... If there is a break higher it could be time to buy... BUT the DXY is still poised for a rally so caution is important. Stay tuned.Trade active: I like buying dips in Gold futures now that price has stabilized above resistance with the daily MACD above zero... I'll be using the 4hr chart, the 50 EMA, and the RSI set at 10. RSI is now near the bottom of the range and price is supported by the 50 EMA +1 @ 1921Comment: Gold price is right at the 200 day EMA so could be a bounce here. The problem is DXY looks like it could make that reversal so I'll set a stop loss on Gold below that 200 day EMA. In that case I would take a short term loss and just wait to get in at a better price.Comment: I'm going to play this by holding through this sell off and buying more if there's a bounce at the next fib level. But to hedge my losses, I'll look to short oil if this DXY rally continues to demolish the markets.Comment: Still coasting above the main trendline. I think downside is limited but will remain cautious about adding here to a leveraged futures position. However, I am still accumulating a core position in gold/silver/metal equities like PHYS, CEF, SLV, RIO.Comment: Once it gets back above that fib level (again) I'd expect a short squeeze.Trade active: Frankly, gold has been such a pain in the ass. I'm slightly net red from last years big win and this years big loss. Long @ 1734 on the August contract. Trusting the fib gods on this one.Comment: Fib bounce, good. Above the 50 EMA, good. 1,800 almost hit, almost good. Probably will be a messy journey but the 0.5 fib is where I'd consider selling this long.Comment: Taking a step back on the weekly view, the MACD is showing momentum is much stronger now than in the last few attempts to break trend. The downside risk is there but the upside looks much bigger but could take a while if there's a pullback from here. Another reason why I grabbed the December(z) contract on this one.Comment: Gold prices are now approaching the target 0.5 fib extension. I'm up about $1,400 on this position but took a big fat L on the last dips. As of now I've broken even on Gold futures YTD. This setup looks to be the beginning of a larger move so I'm just going to hold it through in case of a squeeze up to $2000 happens sooner rather than later.Comment: Momentum hasn't even kicked in yet.Comment: Gold is forming a very similar pattern as the previous top in, price and the MACD. If history does repeat, the place to cut positions is where the MACD dips below 0 and price breaks the trendline.Comment: next resistances and then longer term top.
trade-God
Bitconacci

لقد نجحت بعض الأفكار، وليس كلها. ومع ذلك، كان المسار الأحمر ميتًا في الأعلى والأسفل. هوس مخمور قطعته قمة ويكوف. حدث أن أدى وزن ارتفاع زخم MACD الشهري إلى قلب السعر، مدعومًا بانجراف السعر تحت المتوسط المتحرك الأسي 12. وكانت هذه الإشارات. يتم عكس هذه الإشارات الآن. الزخم جاهز. انقلب 12 EMA. ما هو المتوقع، انخفاض الأسعار وارتفاع الأسعار؟ ماذا عن فترة الهدوء الممتدة التي تتحول إلى تسلق هائل بشكل غير متوقع. هناك أسباب لهذا التحليل، one هو مفهوم جديد لم يلحظه أحد حتى الآن. أولاً، يبدو أن مؤشر الماكد الأسبوعي يحتاج إلى استراحة قصيرة. لكن الأمر الأكثر إثارة للاهتمام هو التسلسل الزمني فيبوناتشي المميز باللون الأزرق. تصطف الدورات منذ عام 2009، btc.
trade-God
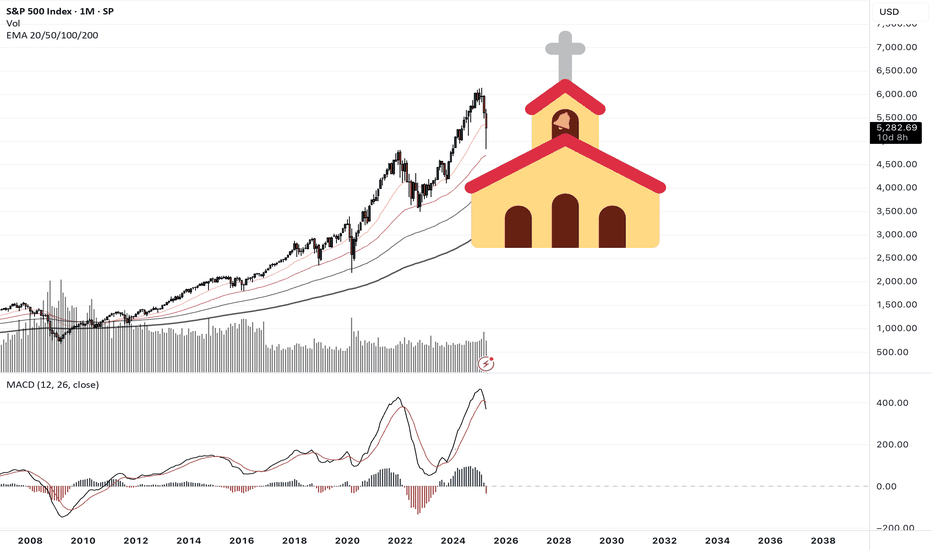
The House

{0} نمایشی نمادین در برابر کازینو در بازی بلک جک است، از این رو سقف ۲۱ میلیون تعیین شده است. بازیکن به زودی متوجه می شود که با وجود اشتیاقش، شانس ها علیه او هستند. با نگاهی به وضعیت بازار، علاوه بر برگشت خوردن شاخصهای مومنتوم، موارد دیگری را نیز مشاهده میکنید: الف. یک بازار تا چه حد باید سرخوش باشد که باعث ایجاد «چشم لیزری» شود؟ ۲. یا رئیس جمهور یک کشور با تمام دارایی خود وارد معامله شده و جوری جشن می گیرد که انگار برنده شده است. ۳. توجه رسانه ها در بالاترین حد خود با تبلیغات در هر گوشه وب ۴. احساس «من قرار است ثروتمند شوم» ک. {1} حتی اگر این پایان کار نباشد، نکته ای در مورد ارزهای دیجیتال به طور کلی وجود دارد. واضح است که تمام اینها تمرکزگرایی است که از عدم تمرکز سود می برد. آیا اکثریت واقعاً پلتفرم هایی را می که در آن افراد کاملاً بدون سانسور و مسئول خود باشند؟ یا منطقی تر است که کازینو آنچه را که مفید است جذب کند و بقیه را رها کند تا نابود شوند؟ به عنوان یک فکر پایانی و شاید مهمترین نکته، به خاطر داشته باشید که کل {2} {3} در سال ۲۰۰۹، در بحبوحه حباب دارایی ها تقریباً در هر گوشه بازار آغاز شد. نظر: برای توضیح بیشتر در این مورد، من هنوز مقداری {4} دارم و فناوری آن قوی است، بنابراین بعید است که {5} از بین برود. سؤال بیشتر این است که ما در کجای چرخه بازار قرار داریم و دقیقاً دلیل اینکه قیمت در این نقطه است چیست؟ آیا پتانسیل صعودی بیشتر از ریسک است؟ تحلیل تکنیکال از نظر فنی، در موج پنجم صعودی قرار دارد. در اصل، تحلیل فیبوناچی من در پست های قبلی به ۱۲۳ هزار دلار اشاره داشت، که هنوز هم می تواند اتفاق بیفتد زیرا هنوز روند را نشکسته است. اما این پتانسیل صعودی در واقع آنقدرها هم زیاد نیست با توجه به سود حاصل از ۱۱ هزار دلار در ابتدای این چرخه. سطح فیبوناچی زیر برای خرید جذاب تر بود. روانشناسی در مقالات قبلی، در مورد احساسات و مراحل چرخه های بازار نوشتم. اگر رسانه های اجتماعی را دنبال کنید، می توانید دقیقاً احساس مردم را درک کنید. یک حس شکست ناپذیری وجود دارد. اینکه ۱ {6} = ۱ {7} پس قیمت مهم نیست. این کاملاً بی معنی است زیرا همه چیز نسبت به آنچه می توانید بخرید نسبی است و ۱ از هر چیزی = ۱ از هر چیزی ۱. مرحله پنهان: انباشت ناشناخته ۲. مرحله آگاهی: سرمایه گذاران نهادی شروع به دیدن پتانسیل می کنند. ۳. مرحله جنون: تزریق رسانه ها برای تبلیغ آن. ۴. مرحله تخلیه: برداشت سود استراتژی ها وقتی کسی با منابع، فرصتی را شناسایی می کند، تلاش هایی برای به حداکثر رساندن آن انجام می شود. {8} متولد می شود و چه کسی می داند چه طرح های دیگری برای سرمایه گذاری بر روی این دارایی جدید در پی {9} نرخ بهره پایین و تقریباً بدون مقررات وجود دارد. ورودی ها قیمت را بالا می برند. پول به دنبال تبلیغات می رود. یک عضو کنگره چشم لیزری به نمایه خود اضافه می کند. شرکت ها و کشورها با تمام دارایی خود وارد معامله می شوند. نظر: {10} هرگز از میانگین متحرک ۱۲ ماهه عبور نکرده است مگر اینکه از آن میانگین متحرک حدود ۵۰ تا ۶۸ درصد سقوط کرده باشد. این هدف ریسک نزولی را حدود ۲۱ هزار دلار قرار می دهد. نظر: نظر:
إخلاء المسؤولية
أي محتوى ومواد مدرجة في موقع Sahmeto وقنوات الاتصال الرسمية هي عبارة عن تجميع للآراء والتحليلات الشخصية وغير ملزمة. لا تشكل أي توصية للشراء أو البيع أو الدخول أو الخروج من سوق الأوراق المالية وسوق العملات المشفرة. كما أن جميع الأخبار والتحليلات المدرجة في الموقع والقنوات هي مجرد معلومات منشورة من مصادر رسمية وغير رسمية محلية وأجنبية، ومن الواضح أن مستخدمي المحتوى المذكور مسؤولون عن متابعة وضمان أصالة ودقة المواد. لذلك، مع إخلاء المسؤولية، يُعلن أن المسؤولية عن أي اتخاذ قرار وإجراء وأي ربح وخسارة محتملة في سوق رأس المال وسوق العملات المشفرة تقع على عاتق المتداول.