
niclaxfx
@t_niclaxfx

ما هو الشيء الذي ننصحك بشراءه من المواد الغذائية؟
سابق في الشراء
پیام های تریدر
مرشح
niclaxfx
بیت کوین به ۲۵۰ هزار دلار میرسد؟ مسیر بازیابی و پیشبینی هفتههای آینده
مرحبًا یا شباب، فی هذا الفیدیو، شارکت أفکاری حول الوضع الحالی للسوق بیتکوین مقابل الدولار لماذا أعتقد أن السوق الصاعدة لم تنته بعد وأیضًا ما یمکن توقعه فی الأسابیع المقبلة. إذا وجدت هذا المحتوى مفیدًا، قم بالإعجاب والمشارکة والمتابعة والأهم من ذلک مشارکة أفکارک فی التعلیق أدناه إذا کنت توافق أو لا توافق على وجهة نظری. دعونا نساعد بعضنا البعض. فی صحتک
niclaxfx
بیت کوین در آستانه جهش بزرگ: راز الگوی "کف دوقلو" فاش شد!
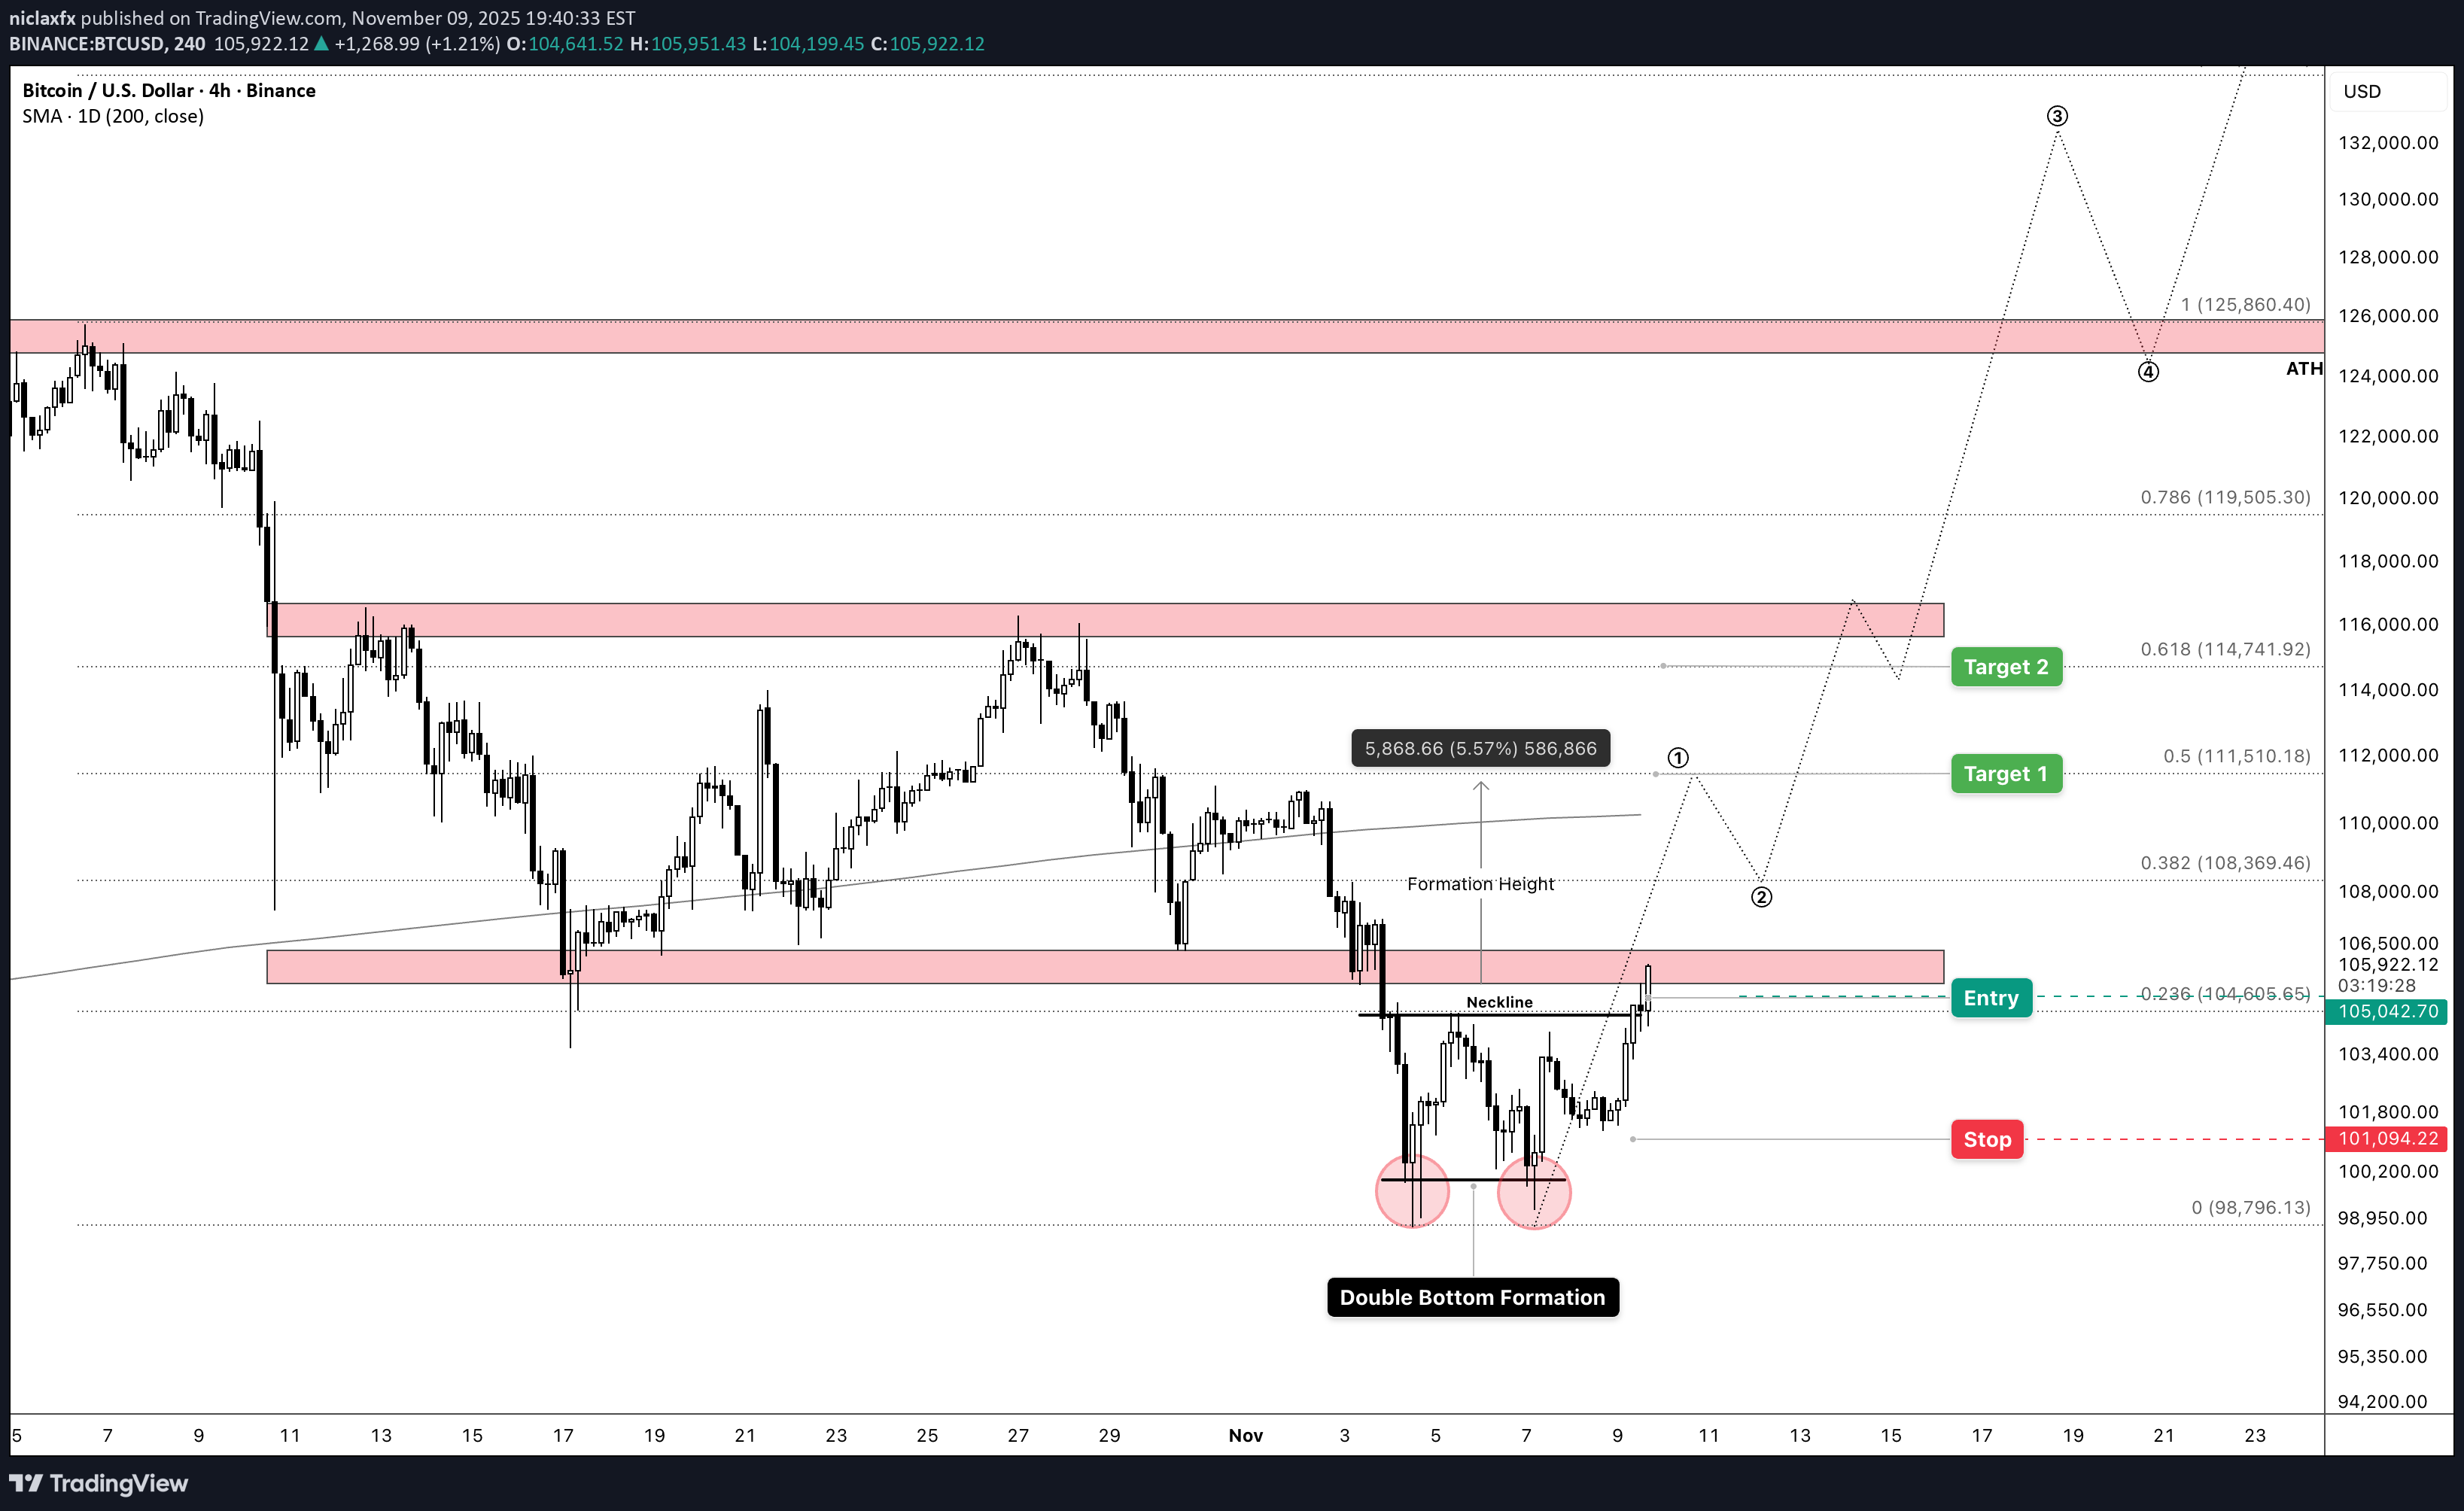
وبعد أسابیع من التماسک والتراجع الحاد الذی هز الأیدی الضعیفة، BITCOIN یبدو أنه یستعد للضلع major التالی للأعلى. یظهر الرسم البیانی للأربع ساعات تشکیل قاع مزدوج، وهو النمط الذی یشیر غالبًا إلى نهایة التصحیح وبدایة اتجاه صعودی جدید. الإعداد بعد رفض البیتکوین من منطقة 126 ألف دولار فی أوائل نوفمبر، شهدنا ارتدادًا مُقاسًا وجد دعمًا بالقرب من مستوى 98 ألف دولار - 100 ألف دولار. تم الآن اختبار منطقة الدعم الحاسمة هذه مرتین، لتشکل قاعین متمیزین یشکلان الأساس لنموذج القاع المزدوج. تم اختراق خط العنق، الذی یقع حول 104.6 ألف دولار، بشکل مؤکد، مما یشیر إلى أن المشترین قد استعادوا السیطرة. ما یجعل هذا الإعداد مقنعًا بشکل خاص هو الهدف المقاس move. من خلال توقع ارتفاع التکوین من مستوى الاختراق، نصل إلى الهدف الأول حول 111.5 ألف دولار - وهو ما یتماشى بشکل ملائم مع مستوى تصحیح فیبوناتشی 0.618. ویضیف هذا الالتقاء وزنا إلى الفرضیة الصعودیة. إن مکافأة المخاطرة هنا جذابة. مع وضع وقف الخسارة أسفل أدنى مستوى للتأرجح الأخیر عند 101 ألف دولار، أی ما یقرب من 3:1 نسبة المکافأة إلى المخاطر. الطریق إلى الأمام إذا BITCOIN إذا حافظ السعر على الدعم فوق خط العنق وحرکة السعر الحالیة، یبدو أن المسار ذو المقاومة الأقل هو الصعودی. یشیر الإسقاط المقاس move إلى أننا قد نشهد تقدمًا منظمًا عبر منطقة 108 ألف دولار - 111 ألف دولار فی الجلسات القادمة. بعیدًا عن الهدف المباشر، یشیر الرسم البیانی إلى مستویات أکثر طموحًا، مع عودة الترکیز على أعلى مستوى على الإطلاق عند 126 ألف دولار إذا استمر الزخم. بالطبع، BITCOIN لا move فی خطوط مستقیمة. توقع مراحل التماسک وإعادة الاختبار المحتملة لخط العنق کدعم. المفتاح هو ما إذا کان المشترون سیستمرون فی الدفاع عن منطقة 104 ألف دولار - 105 ألف دولار فی حالة أی تراجعات. 📝TL;DR Bitcoin قام بتشکیل نموذج القاع المزدوج بعد اختبار دعم بقیمة 98 ألف دولار إلى 100 ألف دولار مرتین. یستهدف اختراق خط العنق عند 104.6 ألف دولار 111.5 ألف دولار، مما یوفر إعدادًا جذابًا للمخاطرة والمکافأة. یحدث الإبطال بأقل من 101 ألف دولار. --- الإبطال: إن الاختراق المستمر والإغلاق على مدار الأربع ساعات تحت مستوى 101 ألف دولار أمریکی من شأنه أن ینفی الهیکل الصعودی ویشیر إلى أن التصحیح قد یمتد هبوطیًا نحو منطقة الدعم البالغة 98 ألف دولار. --- *ملاحظة: هذا التحلیل للأغراض التعلیمیة. قم دائمًا بإجراء الأبحاث الخاصة بک وإدارة المخاطر بشکل مناسب.*
niclaxfx
نبرد روانی طلا و بیت کوین: کدام دارایی واقعاً به اوج رسید؟
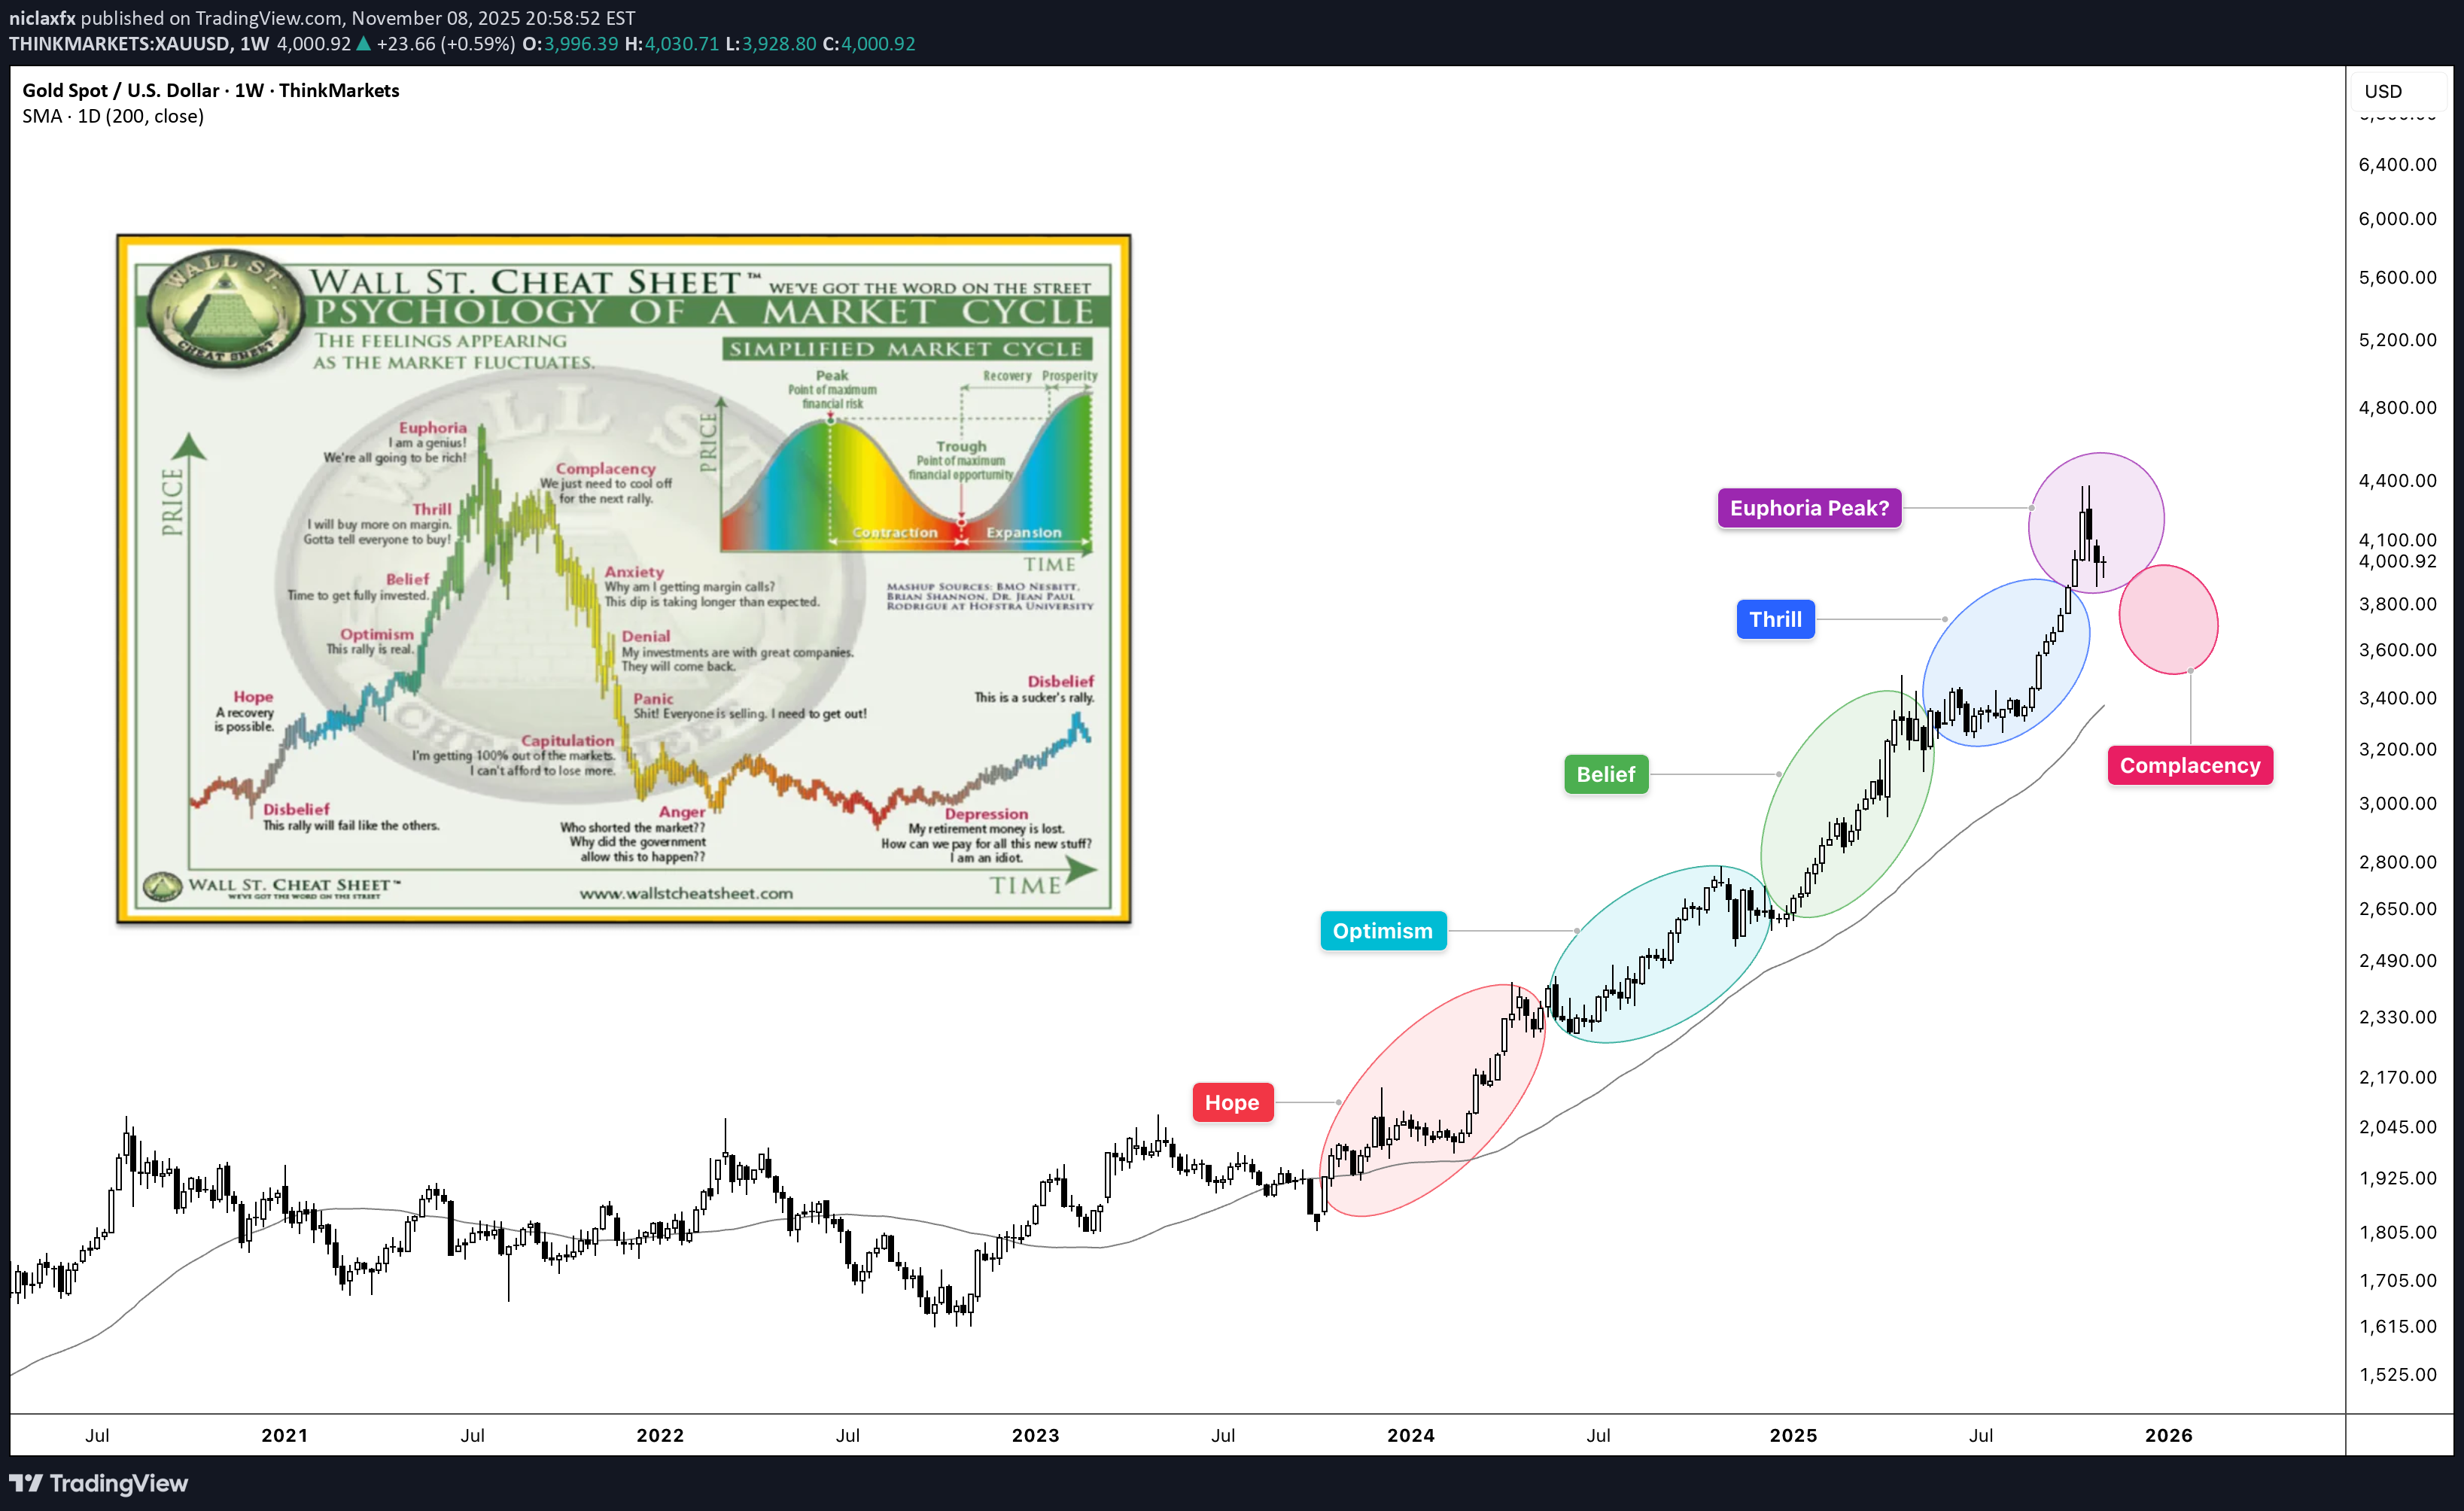
🧠 The Psychology Test That Changes Everything Here's a simple test that will tell you everything about where GOLD and BITCOIN is in its cycle: Look at these two charts. Which one screams "bull market euphoria"? ──────────────────────────────────── Chart One 🥇 GOLD : A Textbook Bull Market Current Price: $4,000.92 Peak Price: $4,390 (Recently hit) RSI: 69.15 Phase: EUPHORIA → COMPLACENCY (Post-peak pullback) What the Psychology Chart Shows: Looking at XAUUSD price action overlaid with the Wall Street Cheat Sheet: ✅ Clean parabolic structure - No ambiguity ✅ Multiple phases completed - Hope → Optimism → Belief → Thrill → Euphoria ✅ Peak already hit at $4,390 - The pink Euphoria circle was touched ✅ Now pulling back from peak - Classic post-euphoria behavior ✅ RSI cooling from overbought - Down from 85+ to 69.15 ✅ Volume still elevated as reality sets in This is what a COMPLETED bull market looks like. When you see this chart, you don't second-guess. You don't wonder "is this a bull market?" You KNOW it is. ──────────────────────────────────── Chart Two ₿ BITCOIN : Still in Early Stages Current Price: $101,802.2 RSI: 44.61 Phase: OPTIMISM (not even Belief yet) What the Psychology Chart Shows: Looking at BTCUSD price action overlaid with the Wall Street Cheat Sheet: ⚠️ "We are here" marker - Sitting in the OPTIMISM phase ⚠️ Haven't reached Belief yet - The green zone is still ahead ⚠️ Thrill phase - Blue circle far above current price ⚠️ Euphoria phase - Pink circle even further away ⚠️ RSI at 44.61 - Not even close to overbought ⚠️ Fourth Halving marker - April 22, 2024 clearly noted This is what mid-cycle consolidation looks like. ──────────────────────────────────── 🔍 The Critical Difference Let me use an analogy: Think of market cycles like a marathon. GOLD (Chart 1): Mile 26 - Just crossed finish line - Race is over, starting to cool down Runners are slowing down after sprint (Post-euphoria) Crowd peaked, now dispersing (Volume still high but declining) Everyone saw the finish (Peak at $4,390) Now wondering if they should have sprinted harder BTC (Chart 2): Mile 8 of 26 - Still early in the race Runners are fresh and steady (Optimism) Crowd is watching but not cheering wildly yet Most people aren't even at the venue yet Many spectators think the race might be cancelled ──────────────────────────────────── 📊 Side-by-Side Psychology Comparison ──────────────────────────────────── 🎯 What This Tells Us About BITCOIN If BTCUSD were truly at a cycle top, it would look like GOLD : ❌ Parabolic vertical moves ❌ RSI pinned above 75 for weeks ❌ Volume exploding ❌ Everyone saying "Bitcoin to $500K" ❌ Taxi drivers asking about crypto ❌ Magazine covers everywhere ❌ No doubt whatsoever about the trend But BTCUSD looks nothing like that: ✅ Choppy consolidation ✅ RSI in neutral zone (44.61) ✅ Volume moderate ✅ Everyone asking "Is the bull market over?" ✅ Retail despair and fear ✅ Zero mainstream coverage ✅ Maximum doubt about the trend ──────────────────────────────────── 💡 The Psychology Principle Here's the key insight from behavioral finance: **"If you have to ask whether you're in a bubble, you're not in a bubble."** GOLD : No one is asking if GOLD is in a bull market. It's obvious. BITCOIN : Everyone is asking if BITCOIN is in a bull market. That's your answer. ──────────────────────────────────── 🧩 Where Each Asset Really Is GOLD - Post-Peak Bear Market Transition: Completed Phases: ✅ Hope (Oct '23 - May '24) ✅ Optimism (May '24 - Dec '24) ✅ Belief (Dec '24 - May '25) ✅ Thrill (May '25 - Sep '25) ✅ EUPHORIA - PEAKED at $4,390 (Oct '2025) Current Phase: 🔶 COMPLACENCY - "It'll come back to $4,390" Price: $4,000.92 (down ~9% from peak) Classic post-euphoria denial behavior What's Next: Anxiety → Denial → Panic → Capitulation (2026+) Time Remaining: Bull market is OVER - bear phase beginning ──────────────────────────────────── BTCUSD - Early-Mid Bull Market: Completed Phases: ✅ Hope (2023 - Post-FTX recovery) 🟡 OPTIMISM (Current - 2024-2025) Phases Still Ahead: ⬜ Belief ⬜ Thrill ⬜ Euphoria What's Next: Break into Belief phase → Thrill → Euphoria Time Remaining: Given BTC high volatile nature - 2-6 months of upside potential ──────────────────────────────────── 🎨 The Visual Test (Do This Right Now) Step 1: Look at the GOLD chart Does it look like a bull market? YES Could you be wrong? NO Is there any doubt? ZERO Step 2: Look at the BITCOIN chart Does it look like a bull market? MAYBE? Could you be wrong? POSSIBLY Is there any doubt? TONS Step 3: Ask yourself **"Would a cycle TOP have this much doubt and fear?"** The answer is NO. ──────────────────────────────────── 📈 What the RSI Divergence Tells Us GOLD RSI Pattern: Peaked above 85 during euphoria Currently cooling at 69.15 Rolling over from overbought Classic post-peak behavior This is bear market transition BITCOIN RSI Pattern: Sitting at 44.61 Plenty of room to run Not even approaching overbought Recent "Bear" signals flushing out This is early-cycle behavior Think of it like a gas tank: GOLD : Hit redline at $4,390, now coasting down on fumes BITCOIN : 45% full, tons of room to run ──────────────────────────────────── 🔥 The Contrarian Insight What the majority thinks: " GOLD is in a bubble, BITCOIN topped" What the charts actually show: GOLD is in a mature bull market (near end) BITCOIN is in early-mid bull market (tons of runway) The irony: Everyone trusts GOLD rally (late stage) Everyone doubts BITCOIN rally (early stage) This is exactly backwards. ──────────────────────────────────── 🎭 The Emotional State Comparison GOLD Holders Right Now: 😰 Starting to feel anxious (down from $4,390) 🤔 "It'll bounce back, right?" 📉 Checking price hoping for recovery 🙃 "I should have sold at $4,390" 😬 "This is just a healthy correction" This is COMPLACENCY - the denial phase after euphoria. BITCOIN Holders Right Now: 😰 Anxious and doubtful 🤐 Not talking about their positions 😔 Wondering if they should sell 📉 Feeling defeated 💀 "Maybe the cycle is over" Which emotional state typically marks: Post-cycle tops? → GOLD current state (Complacency/Denial after Euphoria peak) Cycle middles? → BITCOIN current state (Doubt during Optimism) ──────────────────────────────────── 💎 The Bottom Line Using the Wall Street Cheat Sheet as our guide: GOLD : Phase: Thrill → Euphoria Completion: ~95% through cycle Risk/Reward: High risk, limited reward Action: Take profits soon BITCOIN : Phase: Optimism (just finished Hope) Completion: ~30% through cycle Risk/Reward: Moderate risk, massive reward Action: Accumulate aggressively ──────────────────────────────────── 🧠 The Psychology Lesson The market is designed to make you feel wrong at exactly the wrong time: When GOLD peaked at $4,390 (Euphoria) → You felt confident, " GOLD to $5K!" Now GOLD is pulling back (Complacency) → You feel like "it's just a correction" When BITCOIN is cheap and poised (Optimism) → You feel scared to buy This is why most people: Miss selling tops (felt too good at $4,390) Hold through corrections (denial and complacency) Sell bottoms during fear (Optimism feels scary) To win, you must: Trust the structure over the sentiment Buy when it feels uncomfortable (Optimism/Belief) Sell when it feels amazing (Euphoria/Peak) ──────────────────────────────────── 📍 Where We Actually Are HOPE → OPTIMISM( BITCOIN ) → BELIEF → THRILL → EUPHORIA ( GOLD $4390 Peak) → COMPLACENCY → ( GOLD Current) BITCOIN is 3-4 phases behind GOLD . GOLD already peaked. BITCOIN hasn't even started its parabolic phase yet. ──────────────────────────────────── 🎯 What This Means for Your Portfolio If you're holding GOLD at $4,000: You missed the peak at $4,390 You're in post-euphoria complacency "It'll bounce back" is denial Risk/reward is terrible now Exit strategy needed YESTERDAY If you're doubting BITCOIN at $102K: You're sitting in Optimism You're early to the party Peak is 3-4 phases away Risk/reward is excellent Accumulation strategy needed NOW ──────────────────────────────────── 🔚 Final Thought The next time someone tells you " BITCOIN topped," show them these two charts side by side. Ask them: "Which one actually topped?" The answer is clear: GOLD peaked at $4,390 and is now in complacency denial. BITCOIN is still in optimism. GOLD finished its race. BITCOIN is just finishing Act 1. The Golden Bull Run isn't over—it's barely begun. ──────────────────────────────────── This is educational content comparing market psychology across asset classes. Not financial advice. Always do your own research and manage risk appropriately. ────────────────────────────────────
niclaxfx
سقوط بیت کوین توهم بود؟ چرا رالی طلایی واقعی تازه شروع نشده است!
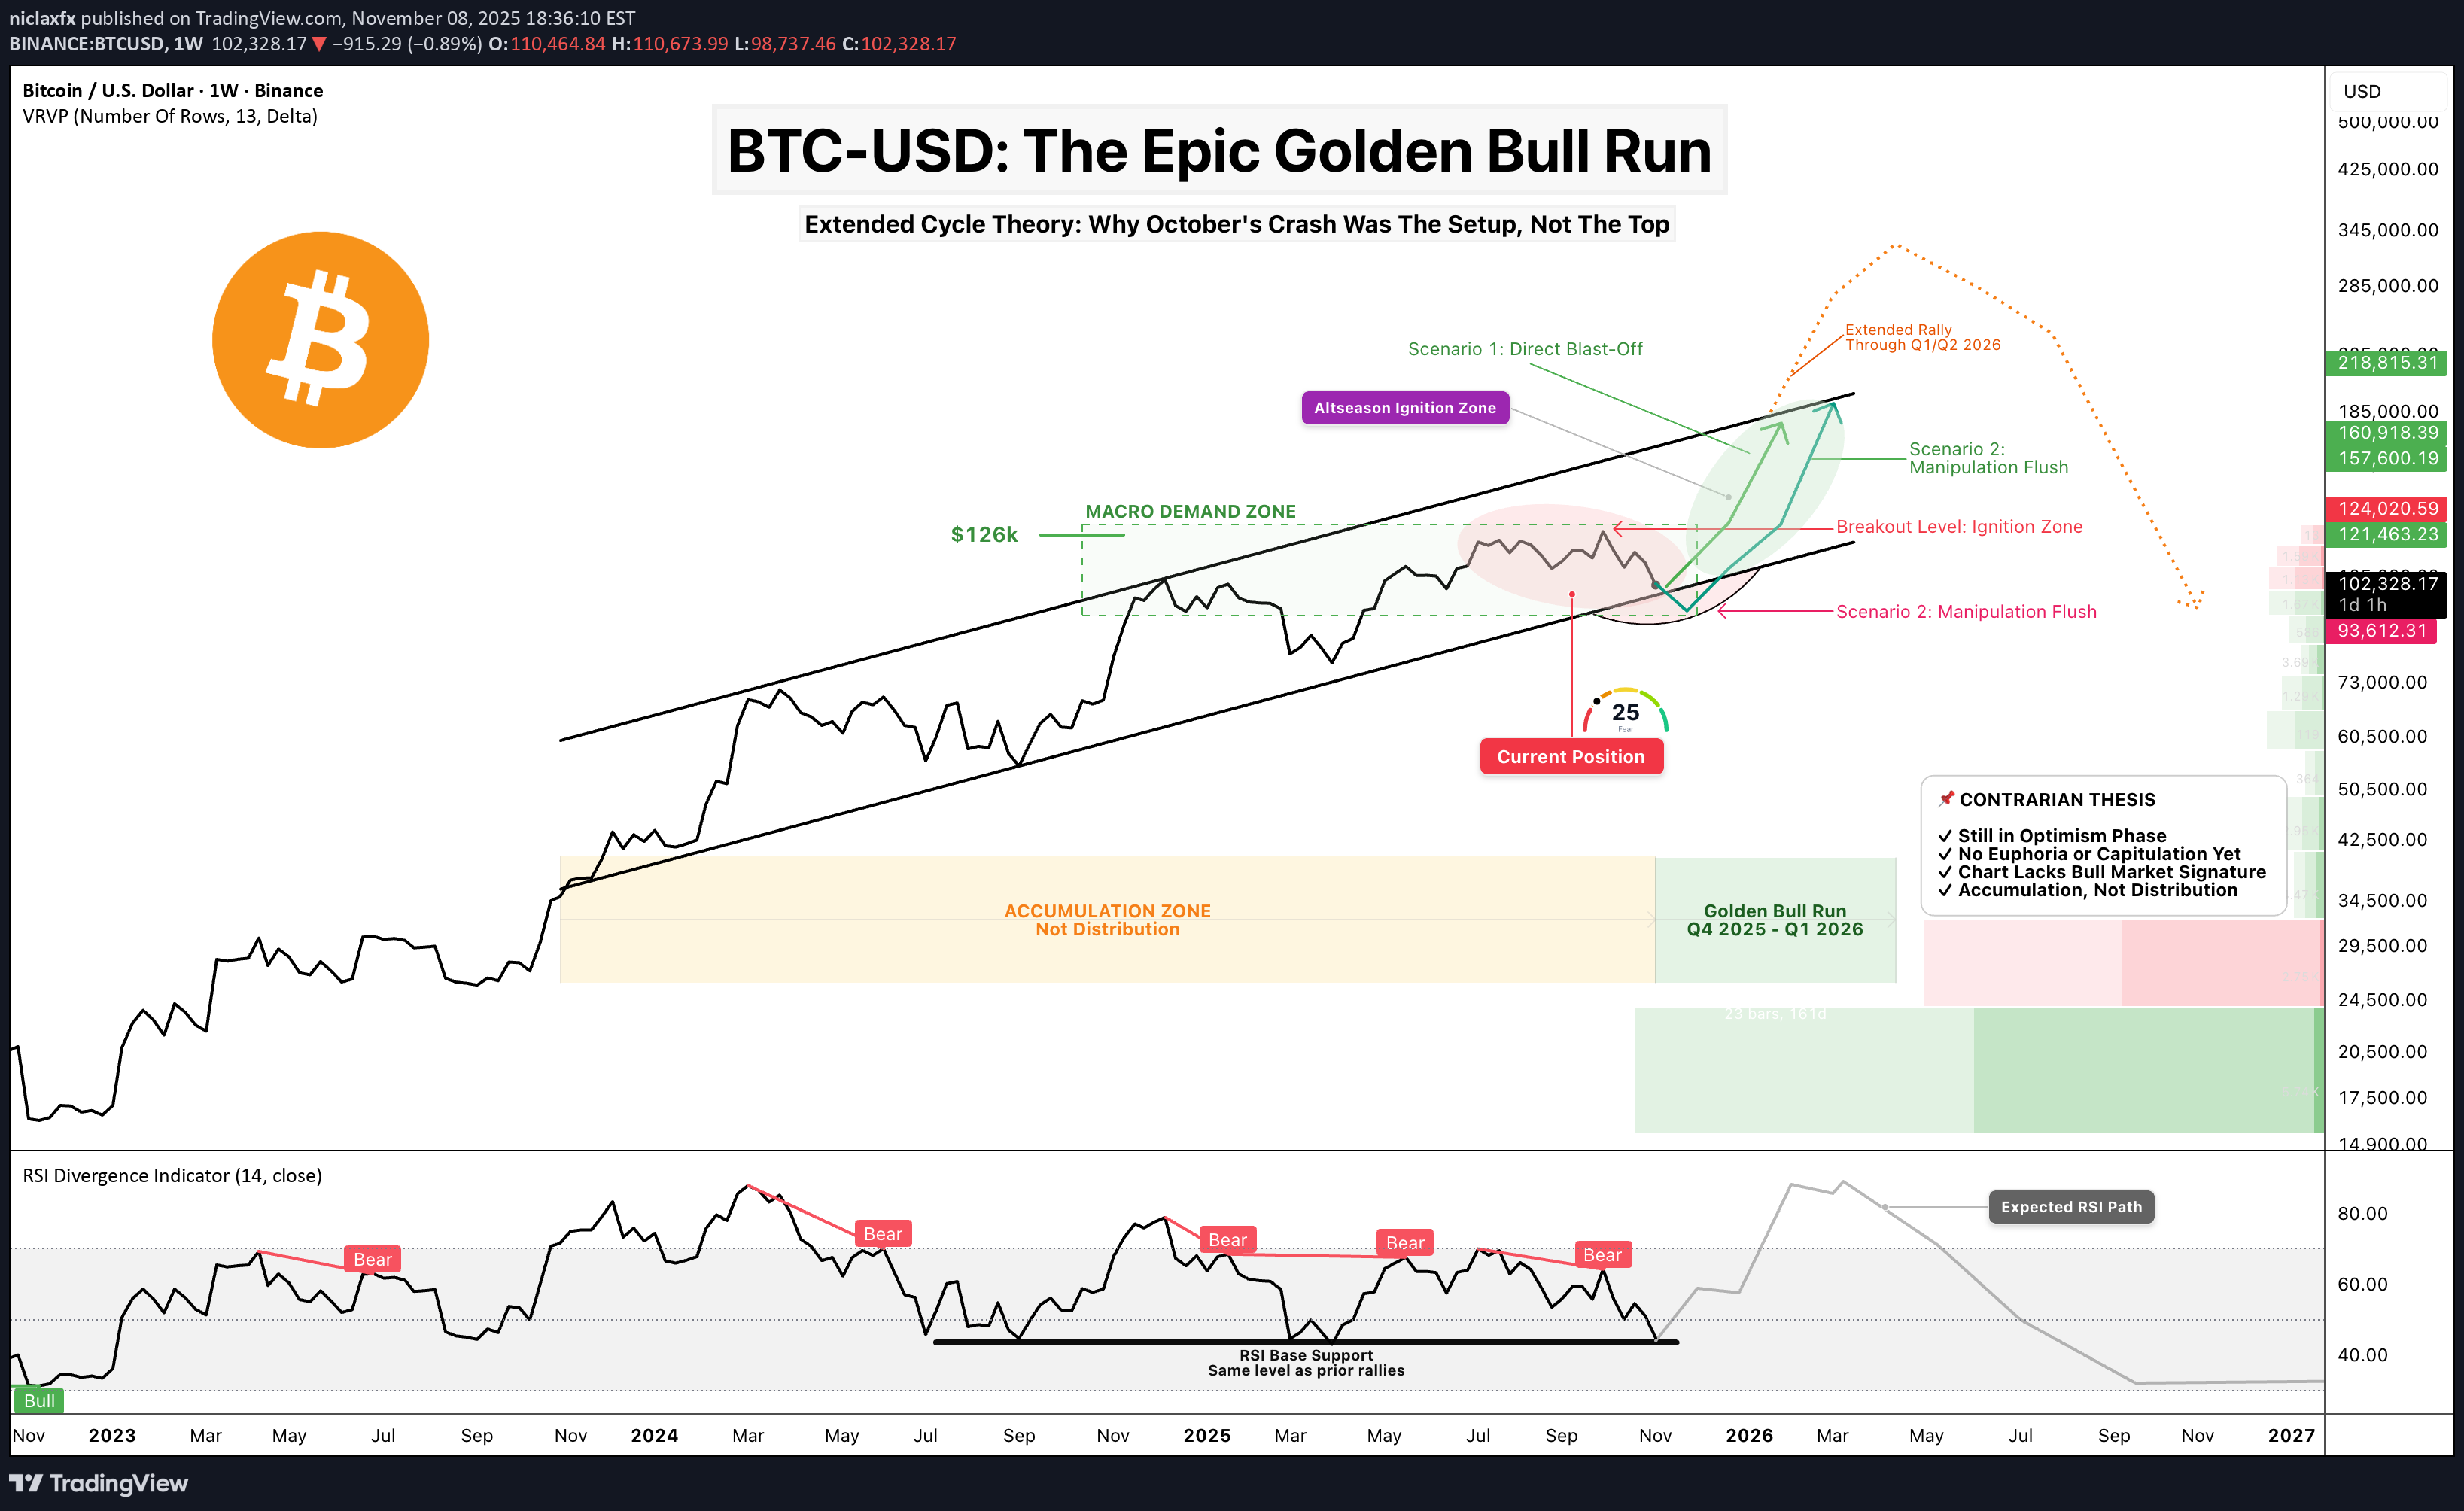
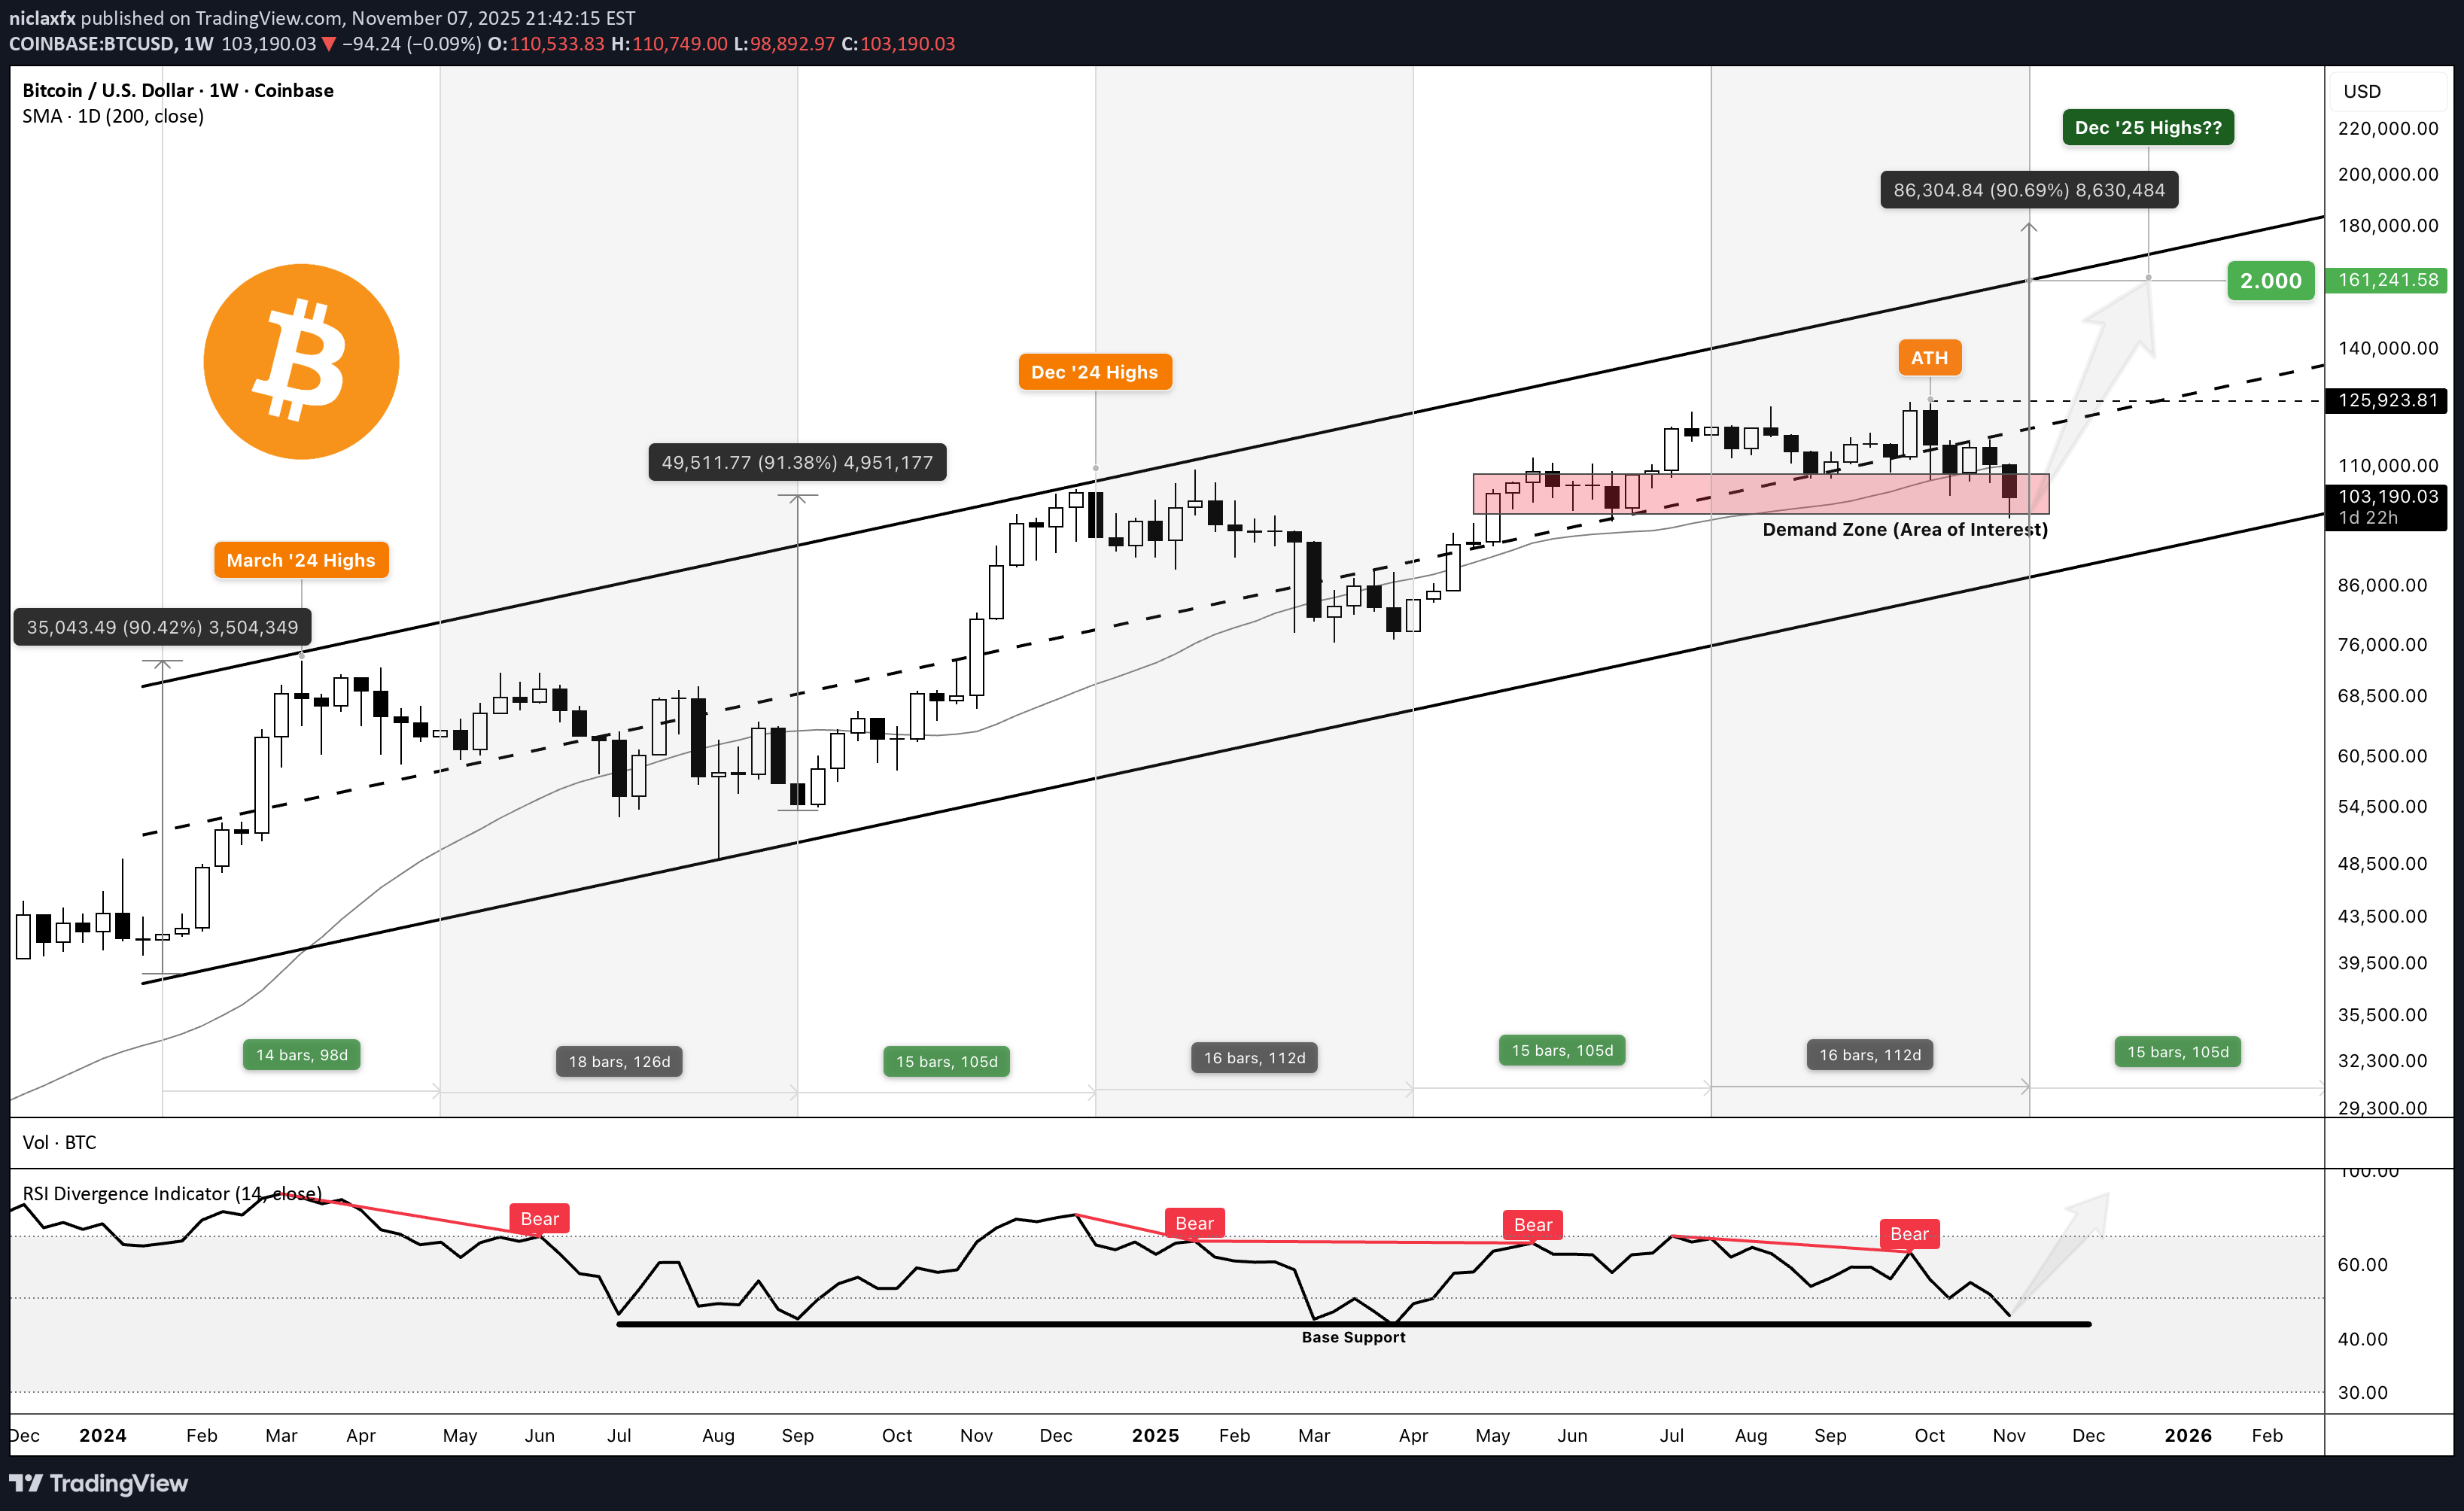
Yes, I get it. Everyone thinks we're already in a bear market. Hope is lost. Life-changing money evaporated. The October crash saw $19 billion in forced liquidations —the largest in crypto history. Some tragically took their own lives. No one wants false hope right now. But I don't think the bull market is over. And here's why—backed by data, not hopium. ──────────────────────────────────── ⚠️ DISCLAIMER This post is strictly my personal beliefs and thoughts, and should NOT be construed as financial advice, nor does it mean the market must go this way. This will be a long read but would be worth the time. Sit tight and grab a beer 🍻 ──────────────────────────────────── Context: Where I Stood in September First, I want to share that as of the last week of September, I gave a detailed breakdown of the market and shared why I thought the bull market was over, which I tagged "The Great Convergence." Read below if you missed that:👉 In that post, I worked with the BITCOIN halving cycle theory (along with SPX and GOLD ), which for over a decade has been the most efficient, accurate, and proven method for timing BITCOIN rallies, tops, and bottoms. By halving theory, the bull market should have ended by August/September 2025. What Actually Happened: Early October : BITCOIN briefly touched a new ATH near $126,296 October 1st : US government shutdown begins, draining $700B+ from markets via TGA October 10th : Trump's 100% China tariff threat triggers $19.13B liquidation cascade in 24 hours BITCOIN crashed from $126K to below $104K—an 18% drop in days October became the first "red October" since 2018 1.6 million traders liquidated—20x larger than COVID crash, 12x larger than FTX November 8th (Today) : Market hovering around $100-102K in extreme fear (Fear & Greed Index: 21) ──────────────────────────────────── 🔍 What's Different About This Current Cycle Here's what stands out as fundamentally different: 1️⃣ The Recent TOTAL Crypto Liquidation Wasn't Capitulation—It Was Infrastructure Cleansing This wasn't profit-taking or true capitulation. The numbers tell the story: $19.13 billion in forced liquidations in 24 hours 1.6 million traders wiped out 20x bigger than the March 2020 COVID crash ($1.2B) 12x bigger than the FTX collapse ($1.6B) This was leverage-driven, not sentiment-driven. The weak hands and overleveraged positions got flushed out. Meanwhile, strong hands (institutions, whales) continued accumulating through the chaos. Key Difference : In true bear market capitulations, holders capitulate. In October, leveraged speculators capitulated while spot holders held firm . ──────────────────────────────────── 2️⃣ The Liquidity Vacuum Is Temporary (This Is Critical) Here's what most people are missing about October: The crash wasn't just about tariffs—it was about a government-induced liquidity crisis . What Happened: US government shutdown began October 1st Treasury General Account (TGA) balance swelled from $800B to over $1 trillion in just 20 days That's $200+ billion drained from the financial system Standing Repo Facility (SRF) usage hit $50.35 billion on October 31—highest since the pandemic crisis in March 2020 This indicated severe dollar shortage in the system Why This Matters: BTCUSD correlation with dollar liquidity remains near 0.85 When the government shutdown ends and resumes spending, that liquidity floods back BitMEX analysts project a strong relief rally when hundreds of billions are injected back This isn't a structural bear market—it's a temporary liquidity vacuum. ──────────────────────────────────── 3️⃣ Institutional Holders Aren't Selling Like Retail Did in Past Cycles Whale Accumulation Data: 1,455 wallets now hold over 1,000 BTC UTXO Age Distribution shows a 5% spike in "Over 8 Years" buckets Long-term holders are doubling down , not distributing Whale Originating Transaction Count: Miner Behavior: Post-halving, miners anticipated higher prices and chose to hold rather than sell immediately While smaller miners face profitability pressure, institutional holders are not showing distribution patterns ETF Context: U.S. spot Bitcoin ETFs saw $1.2B+ in outflows during the crash week October 16 alone: $536 million in panic redemptions BlackRock's IBIT : $268.6M out | ARK's ARKB: $275.2M out BUT HERE'S THE KEY : These were temporary panic outflows, not structural distribution. Year-to-date, institutional accumulation has been relentless . The October outflows represent weak hands being shaken out—exactly what you'd expect in a mid-cycle correction, not a cycle top. ──────────────────────────────────── 4️⃣ No FOMO. No FUD. No Euphoria. (Strongest Psychological Indicators) Let's compare sentiment metrics: Current Sentiment: Crypto Fear & Greed Index: 21-25 (Extreme Fear) as of November 7-8 BTCUSD RSI as at Oct ATH: ~60 (far below euphoric 75+ levels) Market Mood: Despair, capitulation narrative, "bear market confirmed" True Bull Market Top Sentiment (for comparison): Fear & Greed Index: 80-95 (Extreme Greed) RSI: 75-85 (overbought for weeks) Market Mood: "Bitcoin to $500K," taxi drivers asking about crypto, covers of mainstream magazines We haven't even come close to euphoria. The 2024 meme coin craze was a micro-cycle within the broader structure—too early and too isolated to be considered true market-wide euphoria. ──────────────────────────────────── 5️⃣ The CHART Does Not Reflect a Bull Market Yet This is where I'll let the charts speak. First, Look at Gold's Bull Market: 👉 Clean. Parabolic. Obvious. No second-guessing needed. Now Look at Bitcoin: 👉 Ask Yourself Honestly: Does this chart scream "parabolic bull market"? Does the recent ATH look like a blow-off top? Does the volume profile suggest distribution? If you can't answer YES with conviction, then the answer is NO. A Simple Psychology Principle I Use: If I can't say YES without doubting my decision, then the answer is NO. ──────────────────────────────────── 6️⃣ Cycle Coincided with AI Tech Mania and GOLD Super Rally This cycle is unique because capital had competing destinations: AI Tech Mania : Nvidia, AI stocks absorbed massive capital flows GOLD Super Rally : GOLD broke out to all-time highs, attracting safe-haven capital Risk-On Delay : BTCUSD became less attractive as capital rotated elsewhere This delayed the typical BITCOIN Bitcoin cycle dynamics—it didn't end them. ──────────────────────────────────── 🧠 My Contrarian Thesis While this might sound crazy, I believe we are still in the OPTIMISM phase of this rally. Unlike previous cycles, I believe we will experience an extended rally lasting through Q1/Q2 2026. My Thesis is NOT Based On: ❌ Traditional Halving Cycle Theory — I believe that timeline will be extended and recalibrated this time ❌ Stock-to-Flow (S2F) Alone — Though I lean toward its supply dynamics My Thesis IS Based On: ✅ Pure naked price action and structure ✅ Volume profile analysis showing accumulation ✅ Market structure and RSI positioning ✅ Government liquidity mechanics and TGA dynamics ✅ Institutional vs retail behavior divergence ✅ Psychological playbook of market cycles ──────────────────────────────────── 🔄 Why the Halving Cycle Is Extended, Not Broken Many are saying "the 4-year cycle is dead." I disagree. It's not broken—it's being distorted and extended by new factors: The ETF Factor Changed Everything: Traditional Halving Cycle: Post-halving scarcity → slow accumulation → parabolic phase ~500-550 days later 2024-2025 Cycle: January 2024: Spot BTCUSD ETFs approved ETFs brought forward typical post-halving demand 12 months early This created an early rally into March 2024, then consolidation October 2025: Temporary ETF panic outflows (weak hands exit) Framework : The cycle hasn't ended—it's been stretched across a longer timeframe Historical Context: Historically, most significant price appreciation occurred between days ~500-550 post-halving For the April 2024 halving, that window ends Q3 2025 ... but if we factor in the time lag and the now running ~2-Months Govt shutdown delay then that window could be adjusted to Q3 2025 - Q1 2026 See it like a football match, time delay during match is added as extra time, it doesn't mean the 90min rule is broken simply means wasted time must be accounted for. We're literally in the window right now Expert Analysis: Leading analysts suggest the era of the strict 4-year cycle is evolving Market maturity, institutional concentration, and dampened volatility mean the traditional rhythm is being replaced by liquidity-sensitive, macro-correlated behavior The cycle isn't gone—it's adapting to a new market structure ──────────────────────────────────── 📈 The Current Chart Breakdown Look at the Chart Again: 👉 Four Critical Questions: 1. Does this move look like a completed rally? → No. It looks like mid-cycle consolidation with a violent shakeout. 2. Does the recent ATH reflect a distribution top? → No. Volume and RSI don't support distribution behavior. The ATH was a brief spike , not a prolonged distribution phase. 3. What does the volume profile show? → Accumulation zone. Heavy volume during the $95K-$110K range indicates re-accumulation, not distribution. 4. What is the RSI telling us? → Sitting on base support —the same level that triggered every prior bull market explosion in this cycle. Conclusion: If both price action and volume show accumulation rather than distribution, we're in a re-accumulation phase, not a post-rally distribution phase. ──────────────────────────────────── 🎯 The Macro Setup BTC is Positioned Perfectly: ✅ Inside the macro demand zone that has held since late 2023 ✅ On the ascending channel that guided every major leg of this cycle ✅ Channel from 2023 is intact and pointing into six-figure territory ✅ Weekly demand zone holding with precision — re-accumulation, not distribution ✅ Weekly RSI on base support — same level that triggered every bull explosion ✅ Nothing is broken. Nothing is topping. This is positioning, not exhaustion. ──────────────────────────────────── I shared this analysis yesterday, you can read the full or the summarized version below: 📅 Cycle Structure: The 14-15 Week Expansion Pattern Every expansion leg in this cycle has followed a pattern: 14-15 weeks of expansion Followed by 16-18 weeks of correction Where Are We Now? End of the correction window Beginning of the next expansion phase Historical Precedent: If we follow 2017's pattern (euphoric Nov-Dec Rally) where BTC gained +200% in price between Nov 17 -Dec 17 from 5.6k+ to 19.6k+, we could see an explosive acceleration starting from Next week Mid-November - December 2025 With institutional adoption and extended liquidity cycles, this could push into Q1 2026 This would make the current cycle the longest on record , not the end of one ──────────────────────────────────── 🔥 What the Chart Is Screaming Key Technical Signals: Ascending Channel Intact — Channel from late 2023 still pointing to six figures Demand Zone Holding — Weekly demand zone defended with precision Breakout Level Clear — $126K break = ignition point for macro acceleration RSI Base Support — Weekly RSI at the exact level that preceded every rally Projection Untouched — Path to $150K–$170K remains structurally intact ──────────────────────────────────── 🚀 Two Scenarios Moving Forward Scenario 1: Direct Blast-Off ⚡ Demand zone holds firm here Government shutdown ends → liquidity snap-back $126K breaks decisively within weeks New ATH confirmed Vertical acceleration into $150K–$170K by December 2025 Extended rally continues through Q1 2026 Scenario 2: One Final Manipulation Flush 🌊 Wick below demand zone (liquidity grab to $95K-$98K) Mid-channel tap for final shakeout Violent V-shaped recovery and reclaim Same ultimate target: $160K–$170K Timeline delayed by 4-8 weeks but destination unchanged Both scenarios end at the same place. The path differs, but the structure remains intact. ──────────────────────────────────── ❌ The Only Invalidation I will abandon this thesis if: Primary Invalidation: Weekly close below the ascending channel (currently ~$80K) Secondary Warning Signals: TGA doesn't release liquidity when government reopens Institutional ETF outflows continue for 2+ consecutive months Fear & Greed Index stays below 30 through EOY 2025 BITCOIN fails to reclaim $110K by end of November 2025 Weekly RSI breaks below 40 and stays there Until these conditions are met, the bull thesis remains structurally intact. ──────────────────────────────────── 💡 The Liquidity Snap-Back Thesis Here's the mechanism most traders are missing: How Government Shutdowns Affect Crypto: Phase 1: Shutdown (October 1 - Present) Government stops spending TGA balance grows ($800B → $1T+) Liquidity drained from system Dollar shortage (SRF at $50B+) Risk assets crash Phase 2: Reopening (Coming Soon) Government resumes spending TGA balance depletes back down $200B+ floods back into system Dollar shortage resolved Risk assets rally violently BTCUSD 0.85 correlation with dollar liquidity means: When liquidity drains → Bitcoin falls When liquidity returns → Bitcoin rips This isn't speculation—it's mechanical. The October crash was a liquidity event, not a sentiment event. When that liquidity returns, BTC will respond proportionally. ──────────────────────────────────── 📊 Why October's Liquidation Was Different From Bear Markets Let's compare major crypto crashes: The Critical Difference: Previous crashes: Spot holders capitulated October 2025: Spot holders accumulated while leveraged traders got wiped out This is cleansing, not capitulation. ──────────────────────────────────── 🎨 Compare: What a Real Bull Market Top Looks Like Signs of a Cycle Top We DON'T Have: ❌ Fear & Greed Index at 90+ for weeks ❌ RSI pinned above 75 ❌ Parabolic vertical price action ❌ "Bitcoin is going to $1 million" headlines everywhere ❌ Taxi drivers and hairdressers asking about crypto ❌ Massive miner selling at highs ❌ Whales distributing to retail ❌ Everyone you know is suddenly a crypto expert ❌ Cover stories on TIME, Forbes, Bloomberg ❌ New ATHs multiple weeks in a row Signs of Mid-Cycle Correction We DO Have: ✅ Fear & Greed at 21 (Extreme Fear) ✅ RSI at 46 (neutral to oversold) ✅ Choppy consolidation in range ✅ "Bull market is over" narratives everywhere ✅ Retail giving up and selling ✅ Whales accumulating quietly ✅ Liquidation event clearing out leverage ✅ Volume profile showing accumulation ✅ Market despair and hopelessness We're not at a top. We're in the middle of the game. ──────────────────────────────────── 💰 Why I'm All In In my last post I said I went ALL IN on BITCOIN and my selected alts. (after earlier shorting around 120k and sitting on cash) Not because I'm reckless. Not because I'm ignoring risk. But because: The macro structure is intact The demand zone is holding RSI is at historical launch support Volume shows accumulation, not distribution No euphoria has occurred yet The chart does not reflect a completed bull market Government liquidity will return mechanically Largest liquidation in history = weak hands removed Institutional holders aren't selling We're in the historical extended post-halving window This is structure. This is patience. This is conviction based on data. ──────────────────────────────────── 🙏 Final Thoughts I know many of you are hurting right now. I know hope feels dangerous. But look at the data objectively: October was the largest forced liquidation in history—not organic selling The government shutdown created a temporary liquidity vacuum Zero signs of euphoria anywhere in the market Institutional holders and whales are accumulating The chart structure shows mid-cycle correction , not cycle top Sometimes, the best opportunities come when: Everyone is bearish The crowd has capitulated Fear is at its peak And the chart is quietly building the foundation for the next explosive leg This is not hopium. This is structure. This is the setup. The Golden Bull Run hasn't even started breathing yet. We're not at the end— we're at the reset point before the real parabolic phase. ──────────────────────────────────── 📌 Key Levels to Watch Support Levels: Primary Demand Zone: $98K - $104K (current position) Mid-Channel Support: $90K - $95K Critical Invalidation: $85k-$90K (weekly close) Breakout Levels: Ignition Point: $126K (previous ATH) Confirmation: $130K (weekly close above) Targets: Conservative: $150K - $160K (Q2 2025) Base Case: $170K - $180K (Q3 2025) Extended Cycle: $200K+ (Q4 2025 - Q2 2026) Timeline Checkpoints: End of November 2025: Reclaim $110K December 2025: Break $126K and establish new ATH Q1 2026: Parabolic acceleration phase and potential cycle peak(extended thesis) ──────────────────────────────────── 🎯 What Would Make Me Change My Mind? I will publicly update and reassess if: Weekly close below $85k-$90K (channel break) TGA remains elevated 4+ weeks after shutdown ends Institutional ETF outflows persist through December RSI breaks and holds below 40 Fear & Greed stays below 30 through Q1 2026 Failure to reclaim $110K by November 31, 2025 I'm bullish, but not blind. The market will tell us if the thesis breaks. ──────────────────────────────────── 🔚 Bottom Line This bull market isn't slowing down—it's resetting for the real parabolic phase. BTC is gearing up for expansion, and alts will follow with the delayed but inevitable altseason wave. This next 12-18 months is where: Generational wealth is made or missed The real euphoria begins The masses FOMO in—not out The chart finally looks like a bull market Don't let October's liquidation event fool you into thinking this is over. The chart says accumulation. The structure says intact. The liquidity says temporary. The sentiment says despair. That's not a bear market— that's the setup for the next leg. 🐂🔥 ──────────────────────────────────── Not financial advice. This is my personal analysis based on current data. Markets are unpredictable. Trade responsibly. Manage your risk. Do your own research. If you found this analysis valuable, feel free to boost/share. Let's see who's still standing when BITCOIN crosses $150K. ────────────────────────────────────
niclaxfx
بیت کوین مرده نیست! راز انفجار بزرگ بعدی و شروع سیزن آلتکوینها
کل ذلک قبل الانفجار: المرحلة التالیة من Bitcoin وموجة Altseason القادمة مرة أخرى أنا الکل فی على BITCOIN وعدد قلیل من ALTS المحددة. سوق الثور لا انتهى. 🔥ألتسیزون لم یبدأ حتى بالإحماء وهذا لیس کذلک الهوبیوم ... هنا الحقیقة الکلیة الخام الرسم البیانی یصرخ: بیتکوین مقابل الدولار یجلس بشکل نظیف داخل منطقة الطلب الکلی مازلنا نسیر على القناة الصاعدة التی حملت کل major ساق من هذه الدورة لا أعلى. لا انهیار. لا ضعف. هذا هو تحدید المواقع ، ولیس الإرهاق. ⏱ هیکل الدورة: • کل ساق التوسعة: 14-15 أسبوع 📈 • کل تصحیح: 16-18 أسبوعًا 📉 نحن نخرج من نافذة التصحیح (تنتهی فی 10 نوفمبر🗓️) → ندخل فی مرحلة التوسعة التالیة. 📊 ما یؤکده الرسم البیانی: • القناة طویلة المدى اعتبارًا من ینایر 2024 لا تزال سلیمة ← الاتجاه یشیر إلى ستة أرقام. • منطقة الطلب الأسبوعیة تعمل على النحو الخاضع للرقابة إعادة التراکم ، ولیس التوزیع. • مسح الزناد: کسر أعلاه 126 ألف دولار → الاشتعال الکلی. • مؤشر القوة النسبیة الأسبوعی لا یزال قائما دعم القاعدة ⚫ → نفس المستوى الذی یسبق کل ساق major للأعلى. • لا یزال هناک هدف ذو إطار زمنی مرتفع لهذه الدورة 150 ألف دولار – 170 ألف دولار → مکافئ إلى 220 کیلو+ 🎯 • یظهر حجم الملف الشخصی تراکم ولیس التوزیع 🎯 📝 السیناریوهات: 1️⃣الانفجار المباشر 🚀 منطقة الطلب ثابتة → کسر بقیمة 126 ألف دولار → جدید ATH → تسارع الاتجاه إلى 160 ألف دولار – 170 ألف دولار. 2️⃣ التلاعب بالتدفق 🩸 الفتیل أقل من الطلب (انهیار فلاش إلى 90 ألف دولار) ← النقر فی منتصف القناة ← الاستعادة العنیفة ← نفس الهدف النهائی. ❌ البطلان: إغلاق أسبوعی فقط أسفل القناة یقتل الهیکل. لا شىئ اخر یهم. ✅ الخلاصة: هذا السوق الصاعد لا یبرد، إنها إعادة تحمیل . Bitcoin تستعد لموجة التوسعة التالیة، وستتبعها موجة توسعیة متأخرة وعنیفة ولا مفر منها com.altseason. هذه المحطة التالیة هی أین مداخل الأجیال سداد أو الحصول على الندم. حصتی على BITCOIN أین موقعک؟ هذا التحلیل للأغراض التعلیمیة فقط ولا ینبغی اعتباره نصیحة مالیة. الأداء السابق لا یضمن النتائج المستقبلیة. قم دائمًا بإجراء أبحاثک الخاصة واستشارة المتخصصین المالیین قبل اتخاذ قرارات الاستثمار. تُظهر الأطر الزمنیة المنخفضة (H8/H4) قاعًا مزدوجًا نظیفًا، وتصطف بشکل مثالی مع نهایة التصحیح الذی دام 16 أسبوعًا على الاقتصاد الکلی. إذا تم کسر هذا الهیکل بحلول عطلة نهایة الأسبوع (10 نوفمبر)، فمن المحتمل أن یؤدی ذلک إلى بدایة موجة دافعة إلیوت مکونة من 5 موجات فی الاتجاه الصعودی. المراقبة عن کثب هنا - أسبوع مثیر للاهتمام أمامنا✌🏾.
niclaxfx
سقوط آزاد طلا (XAU/USD): آیا حمایت حیاتی 3986 دلار شکسته میشود؟
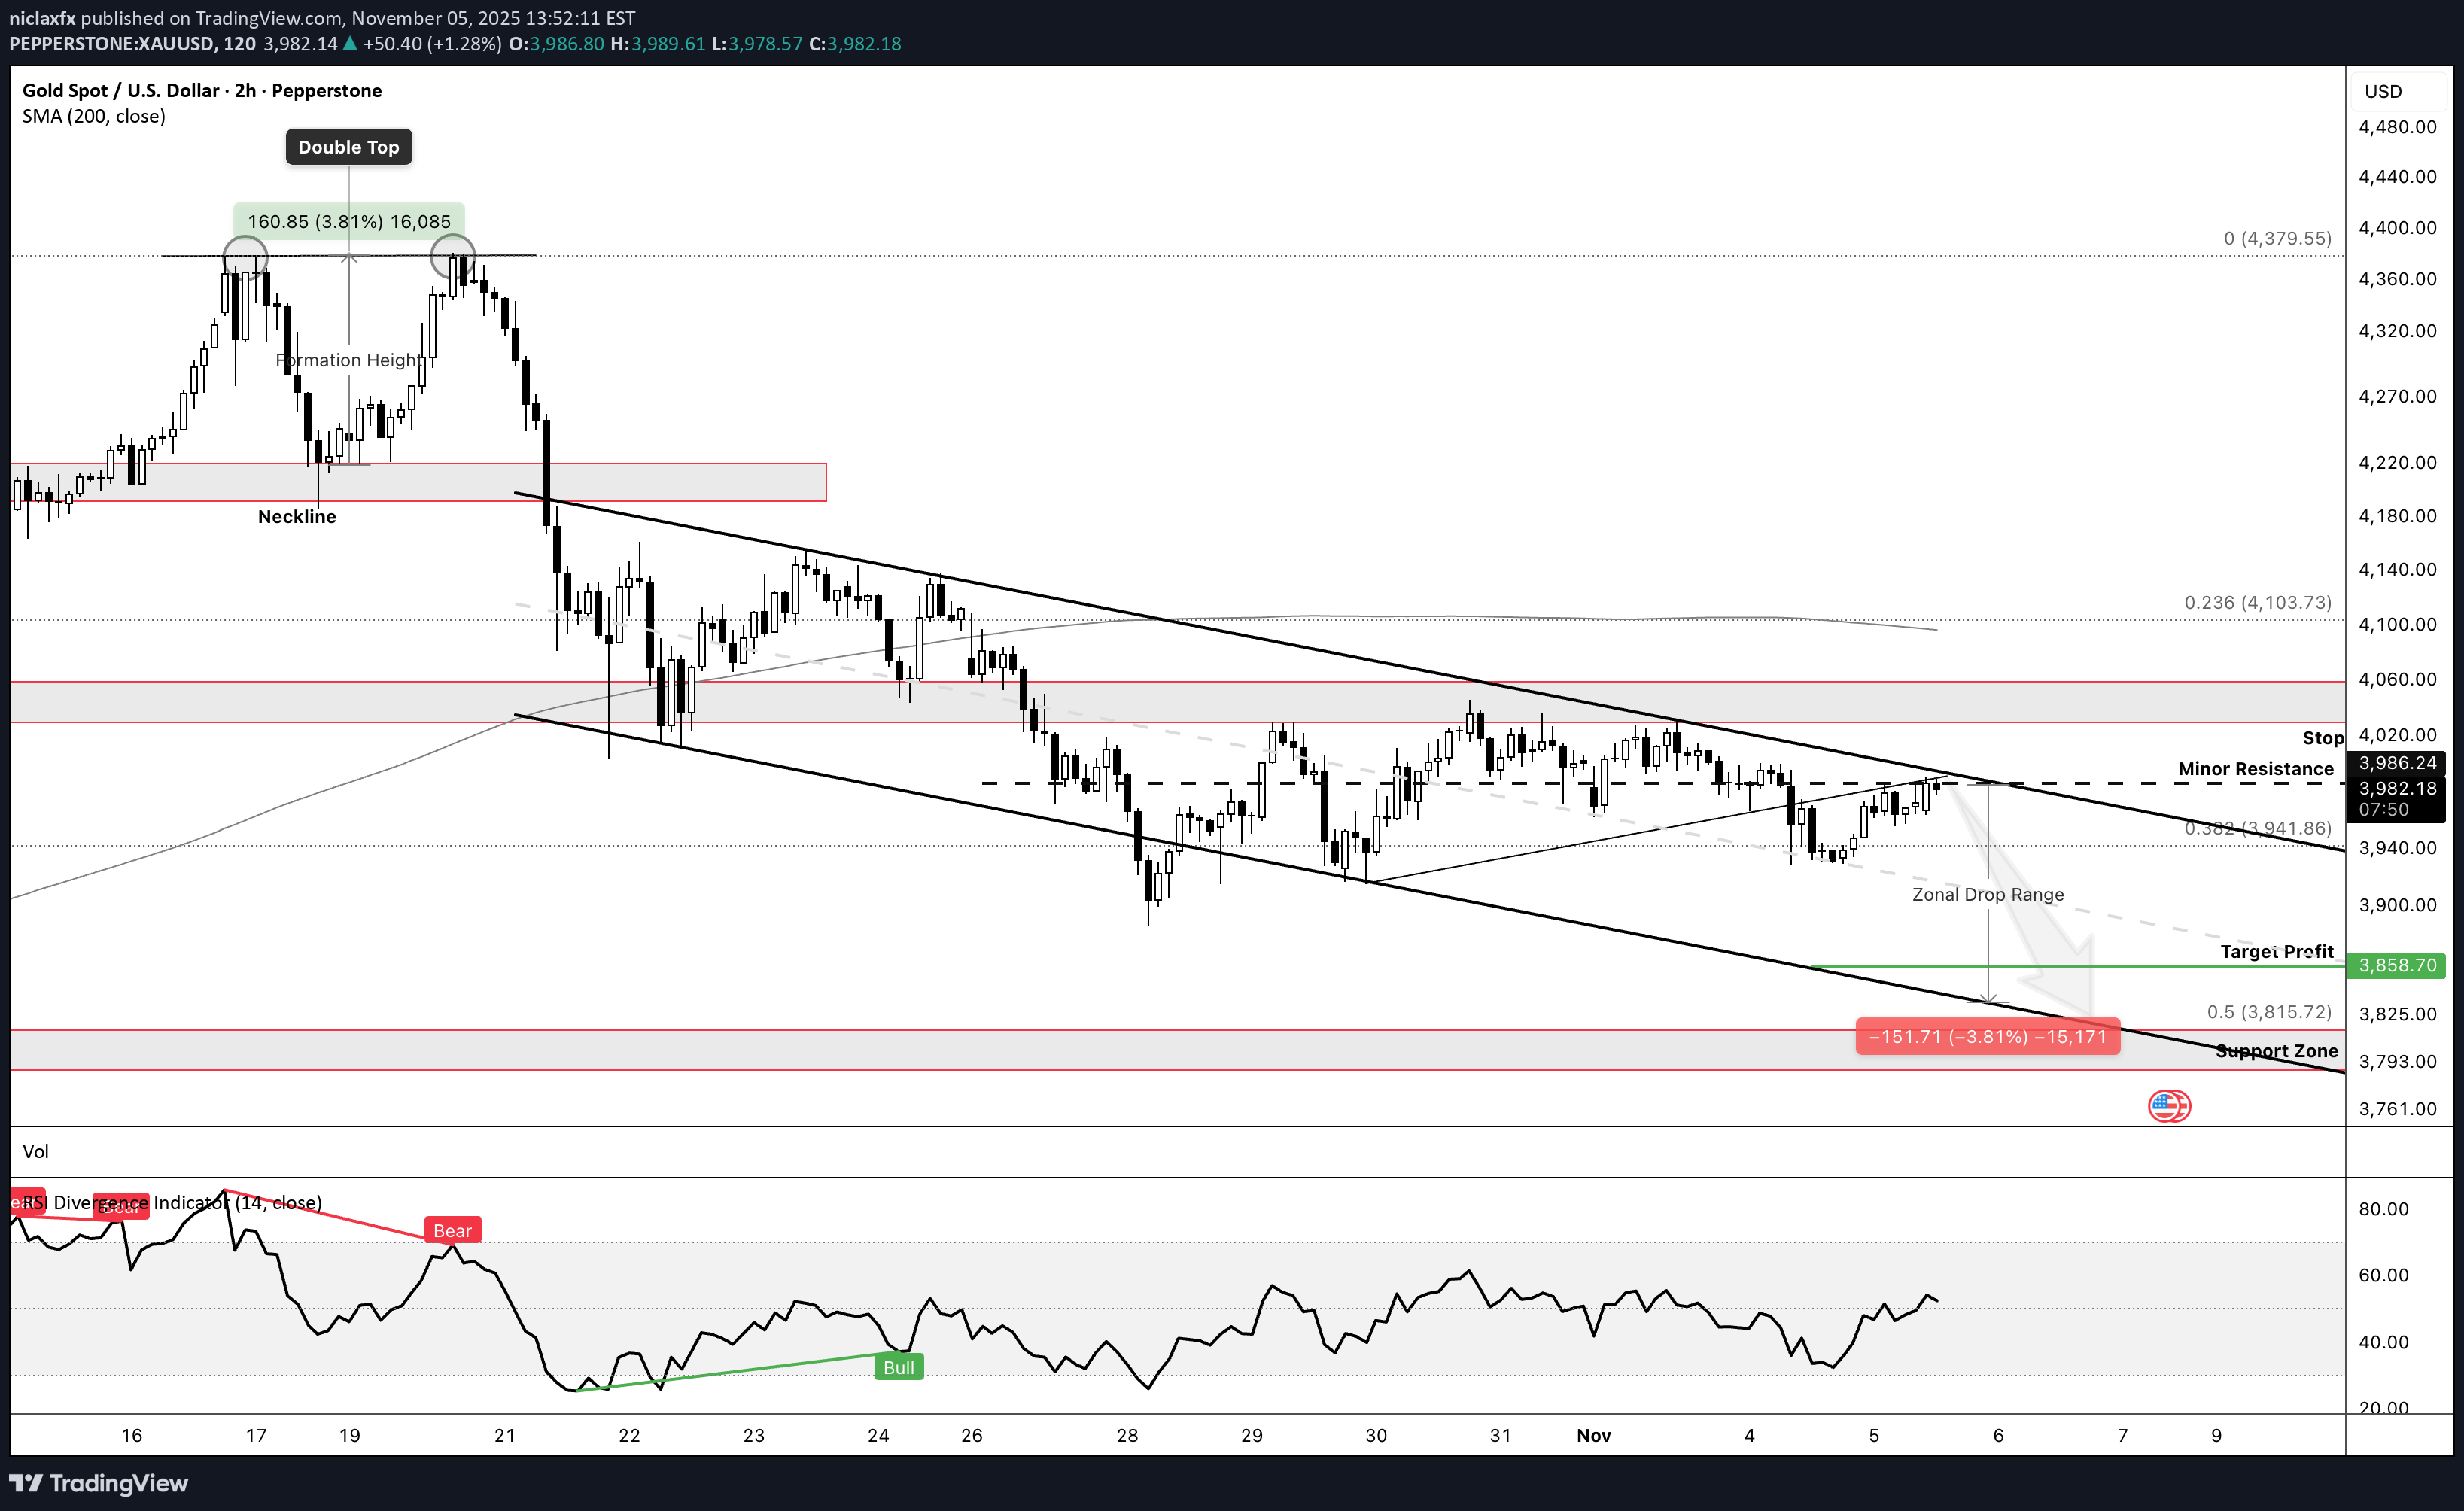
الذهب تصدرت بشکل ثقیل عند 4,380 دولارًا، وتصدع خط العنق بحوالی 4,200 دولار - 4,190 دولارًا - تشکیل القمة المزدوجة الکلاسیکی. منذ ذلک الحین وهو ینزف داخل قناة هابطة وکل ارتداد یموت تحت الضغط. 3,986 دولارًا هو الخط الموجود فی sand ⚔️ — طالما ظل السعر أقل من ذلک، فإن الدببة هم المسیطرون بشکل کامل. ما زلنا نتداول داخل نطاق Zonal Drop Range (3,986 دولارًا - 3,825 دولارًا) - حیث یواصل البائعون ضرب کل دفعة. 🎯 الأهداف: TP1 → 2920 دولارًا (38.2% ألیاف) TP2 → 3,858 دولارًا TP2 → 3,790 دولارًا - 3,760 دولارًا (منطقة الدعم) 🧠 الإعداد: حالات الرفض القصیرة تتراوح بین 3,980 دولارًا - 3,990 دولارًا. توقف فوق 4,040 دولارًا أمریکیًا - أی إغلاق فوق ذلک یلغی التداول ویفتح مساحة مرة أخرى نحو 4,103 دولارًا أمریکیًا - 4,160 دولارًا أمریکیًا. 📉 مؤشر القوة النسبیة: محاید إلى هابط حول 51. 📊 الحجم: التجفیف = طنجرة الضغط قبل القطرة التالیة. وإلى أن یستعید المضاربون على الارتفاع مبلغ 4040 دولارًا، سأقوم بصید السراویل القصیرة فقط. أقل من 3986 دولارًا، توقع تسارعًا - فراغ سیولة نحو 3858 دولارًا، وربما تدفقًا کاملاً إلى 3790 دولارًا. ابقَ حادًا، ابق صبورًا 💚.
niclaxfx
ریتم مخفی بیت کوین: پیشبینی مسیر صعودی تا ۱۶۰ هزار دلار (۱۲۰ هزار کلید است!)

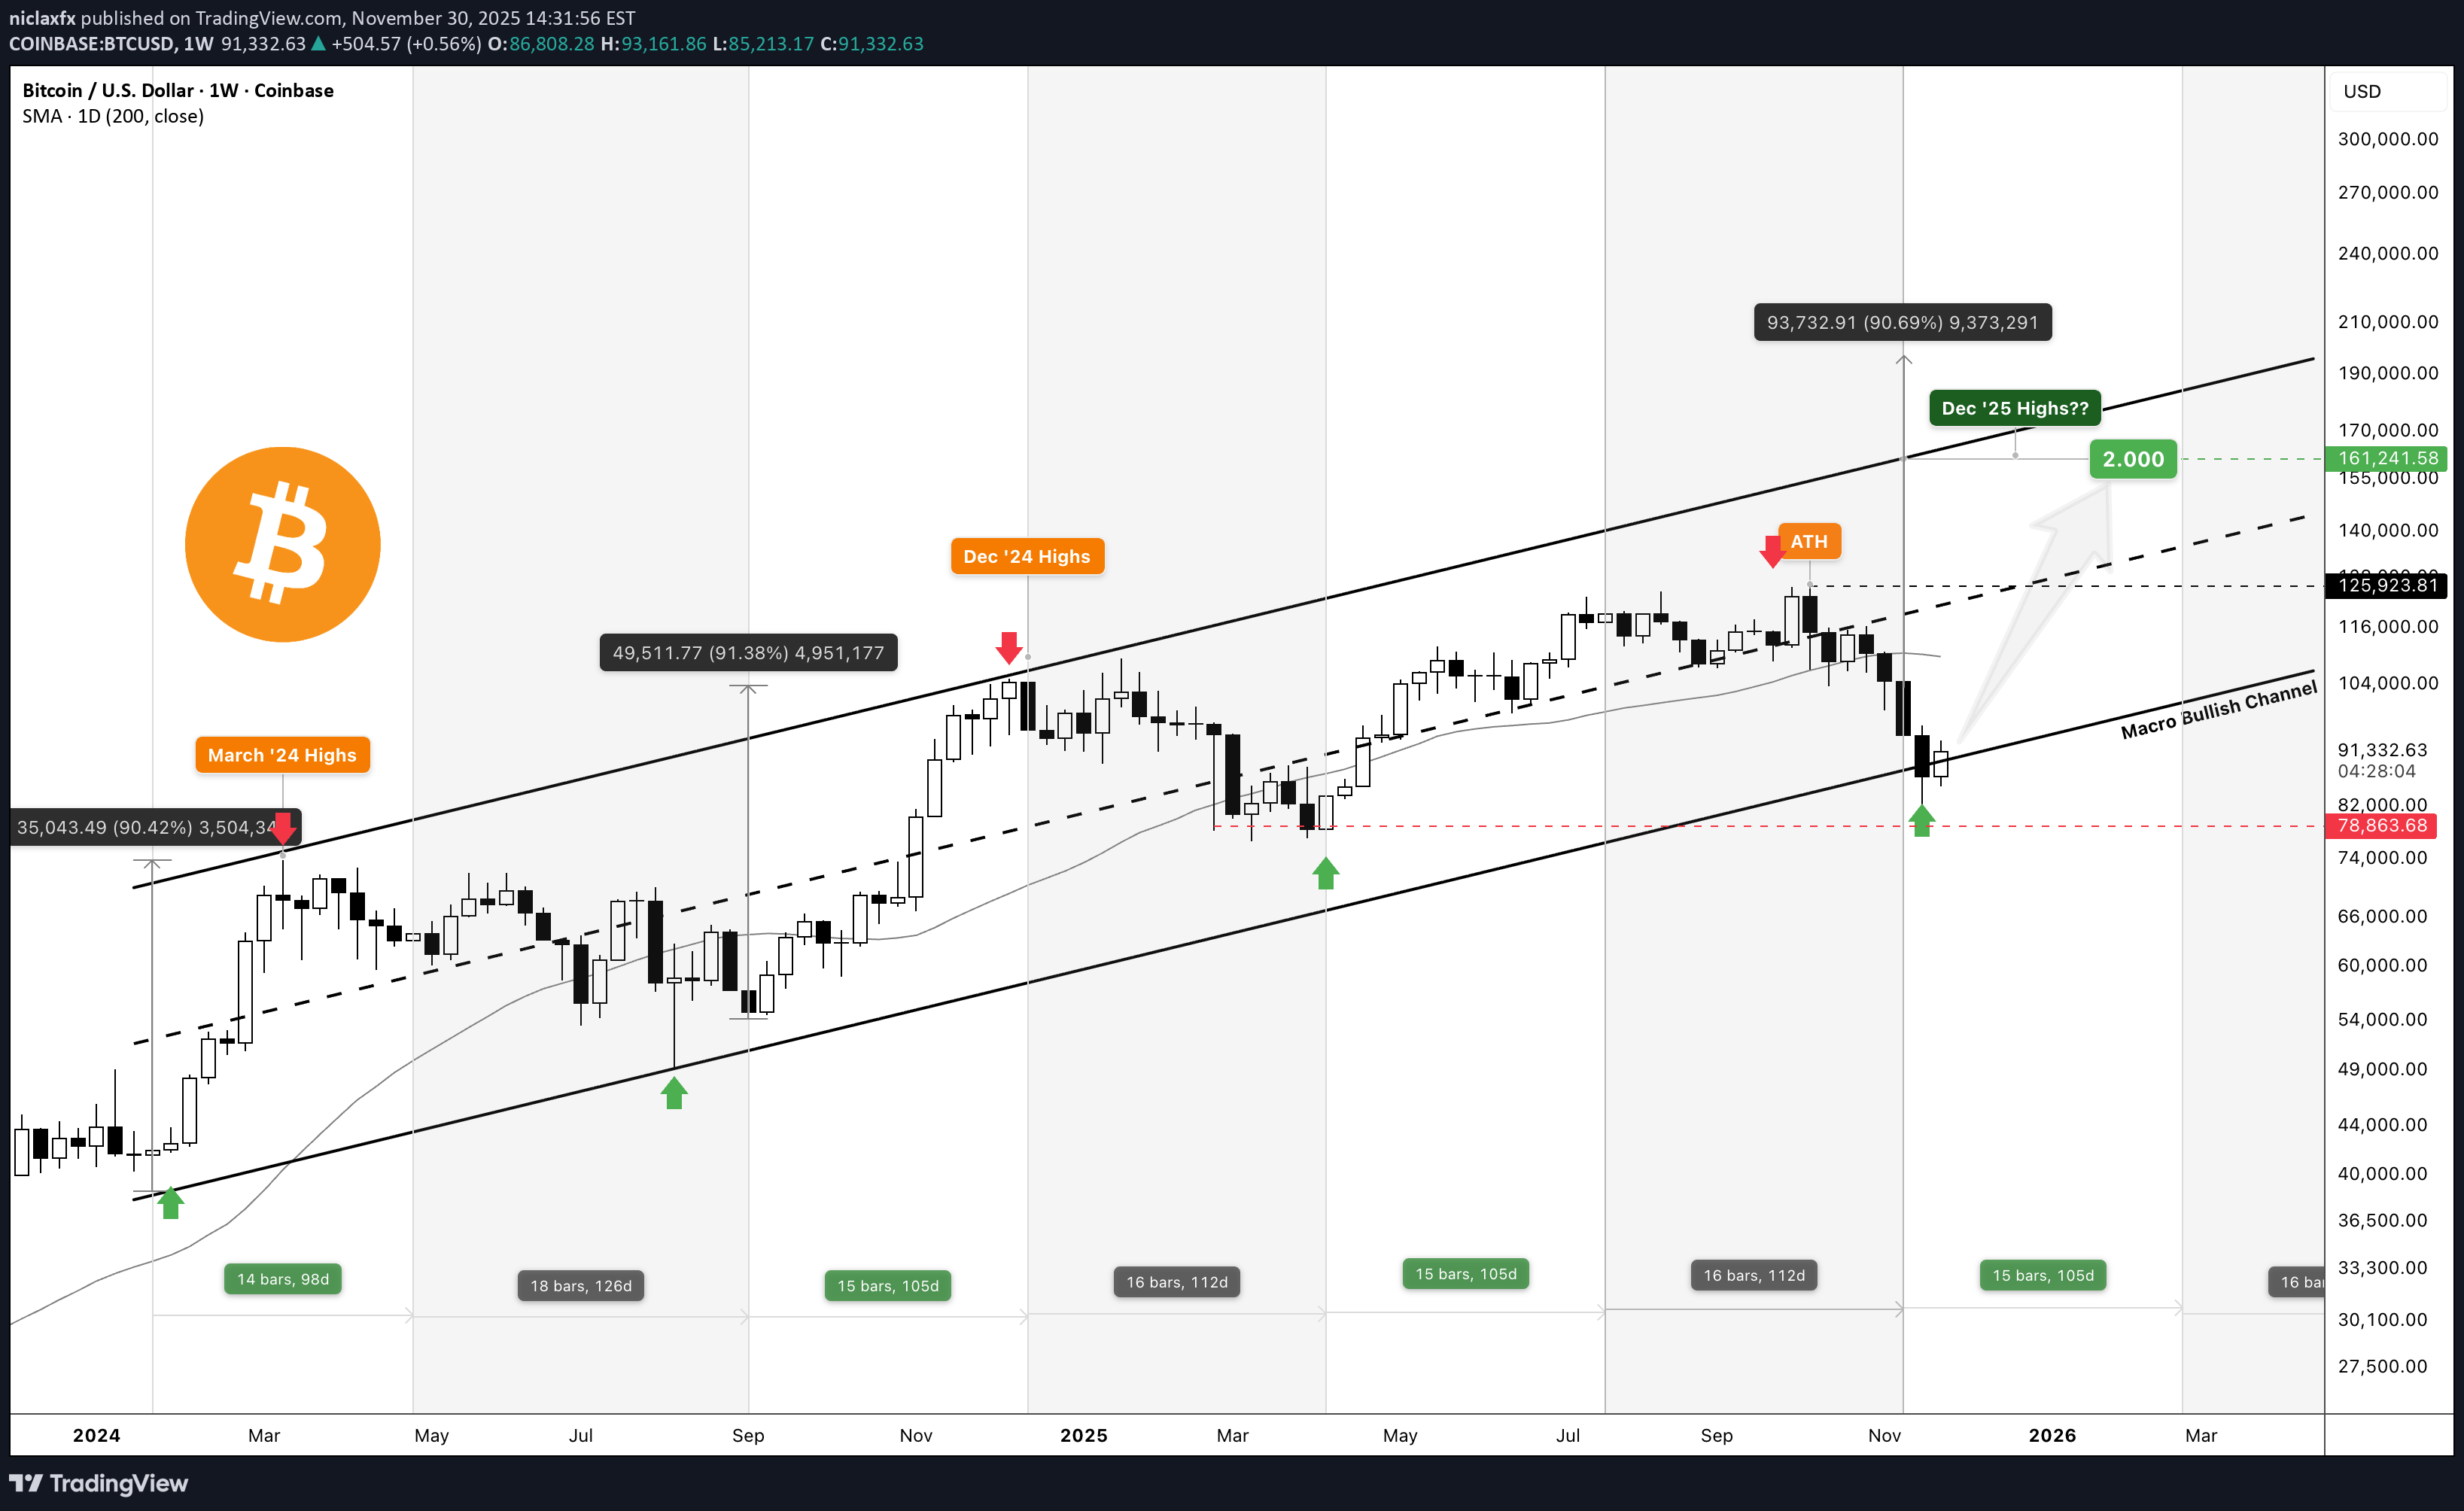
Bitcoin یتحرک بإیقاع - لیس عشوائیًا، ولیس متهورًا، بل متناغمًا. کل صعود وتراجع یعزف کأنه لحن من تاریخه الخاص، ومرة أخرى، یدندن الرسم البیانی بتلک النغمة المألوفة. بعد التنصت 126 ألف ، تم استعادة السعر، واختباره دعم 120 الف , وارتد نظیفًا - علامة على أن الإیقاع لا یزال سلیمًا. ال منطقة ATH – SR (120 ألفًا – 124 ألفًا) یعمل الآن کمحور، حیث یتزاید الزخم لما یمکن أن یکون ظهورًا آخر لشهر نوفمبر. فوق هذا النطاق، یتم تشغیل النوتات الموسیقیة التالیة عند 138 کیلو، 147 کیلو، وربما 160 ألف+ إذا کان الإیقاع یتدفق مثل 24 نوفمبر - 24 دیسمبر، والآن 25 أکتوبر - 25 نوفمبر. ولکن إذا انکسرت هذه الإیقاع، یظل 108K هو أساس الإیقاع. بیتکوین مقابل الدولار لا یقتصر السعر على move فقط - بل یتحرک فی الأنماط. استمع إلى الإیقاع، ولیس الضجیج. - کلاوس | مرکز NFX --------------------------- حتى فی الأوقات الحرجة - لا بأس أن تلعب قلیلاً...📝 لیرة ترکیة؛دکتور: 🟠 120K–124K هی المنطقة المحوریة. 📈 الثبات بالأعلى = الأهداف عند 138 ألفًا، 147 ألفًا، 160 ألفًا+. 📉 الکسر أدناه = إعادة اختبار 108 ألف. 📆 النمط یتماشى مع نوفمبر 24، لکن کن مرنًا.
niclaxfx
بیت کوین در 123 هزار دلار: آیا گاوها یا خرسها پیروز میشوند؟ راز مقاومت سهگانه فاش شد!

لقد اختبر السعر الآن منطقة المقاومة 123K ثلاث مرات. فی المحاولة الثالثة ، رأینا انقطاعًا ضحلًا ، یلمح إلى الامتصاص بدلاً من الرفض - علامة على أن البائعین قد یکونون رقیقة ((من بینهم ، اعتدت أن أکون لول). الآن ، کل العیون فی إعادة اختبار 123k-المحور المحتمل أو الإکراه. إذا انقلب هذا المستوى لدعمه ، فیمکن أن یقود Bulls نحو امتداد FIB التالی عند 129،700. ولکن إذا کان المستوى یفسح المجال ، فمن المحتمل أن نعود إلى منطقة قاعدة 117K - 11.5K. مستویات المفاتیح 🔴 منطقة المقاومة: 122،500 - 124،500 🟢 هدف: 129،700 (FIB EXT 1.272) ⛔ الإبطال: أقل من 122000 🔵 دعم قاعدة: 117،000 - 118،500 الأطروحة: تمیل الاختبارات الثلاثیة إلى إضعاف مناطق التورید. یقترح الاختراق الضحل التراکم بدلاً من الإرهاق. یأتی التأکید إذا کان المشترون یدافعون عن مقبض 123K - الفشل فی الاحتفاظ بالزخم مرة أخرى إلى الجانب السلبی. TL ؛ DR: اختبار المقاومة الثلاثی → الاختراق الضحل → إعادة الاختبار فی اللعب. 123K هو المحور. عقد = 129،700. فشل = العودة إلى القاعدة. ملاحظة: ابق فی حالة تأهب للوصول إلى الأحداث الماکرو. سیخبر الحجم والبنیة القریبة story.
niclaxfx
طلا در منطقه حساس: تصمیم سرنوشتساز هفته آینده برای قیمت چیست؟

ذهب یواصل هیکله الصعودی المثیر للإعجاب ، ویتسلق بشکل نظیف من خلال جمیع مناطق المقاومة السابقة. تم قیاس کل مرحلة توسع ومتناسقة - بالتناوب بین ~ 1.7 ٪ من الساقین الاندفاعین و ~ 4.4 ٪ التوسعات التصحیحیة ، مما یشکل سلوکًا إیقاعیًا یعکس المؤسسیة الخاضعة للرقابة flow بدلاً من تقلبات التجزئة. یعمل السعر الآن داخل المنطقة 4 ، ویقترب من هدف المقاومة الذی یتراوح بین 3987 دولارًا - 3،990 دولارًا. یتماشى هذا المستوى مع الحدود العلیا لنطاق التوسع الحالی ، مما یجعله نقطة قرار حاسمة. إذا کان السعر یتبع نفس الإیقاع التاریخی الذی لوحظ فی سبتمبر ، فهناک احتمال کبیر ، فسنرى نقرة قدرها 3987 دولارًا ، تلیها التراجع نحو 3،914 دولار (دعم المنطقة) قبل أی محاولة استمرار. ومع ذلک ، من المهم أن نلاحظ أننا فی مرحلة تعتیم ، مع عدم وجود U. الإصدارات الاقتصادیة data لوقود الإدانة الاتجاهیة. هذا یعنی أن الزخم هنا مدفوع إلى حد کبیر من الناحیة الفنیة ، ویمکن أن یمثل المرحلة النهائیة للذهب قبل تحول الاتجاه الأوسع. ملاحظة رئیسیة: التحیز الأساسی: لا یزال الاستمرار الصعودی صالحًا بینما یتجاوز 3900 دولار. أتوقع أن یصل السعر إلى 3987 ثم تراجع إلى 3914 حیث تکرار إعادة تراکم. یظل الحجم ثابتًا ولکنه لیس نشطًا - مما یشیر إلى تراکم منضبطة بدلاً من FOMO المتأخرة. خاتمة: ذهب لا یزال الهیکل سلیما ، لکن السوق یدخل منطقة قرار. من المحتمل أن تحدد المرحلة التالیة move من هنا فی غضون 24-48 ساعة ، ما إذا کنا نشهد تمدیدًا نهائیًا أو بدایة تصحیح أعمق. 💭 شارک أفکارک أدناه فی حالة اتباع هذه التجارة.
niclaxfx
ریزش بیت کوین در راه است؟ تحلیل فنی و ماکرو که نباید نادیده گرفت!

📝thesis: دخلت للتو btcusd بناءً على التقاء الإشارات التقنیة والکلیة. هذا لا یتعلق فقط بالقلق المفرط فی RSI - إنه یتعلق بالمخاطر غیر المتماثلة ، والهیکل الصعودی الخادع ، وتجاهل معظم التجار. 📉 إعداد الإعداد RSI (H4): 85.12 - منطقة شدیدة الشراء. تاریخیا ، أثارت هذه المنطقة تراجعا حادا. تأکد قمم RSI السابقة التی تحمل علامة "Bear" على الرسم البیانی للنمط (یولیو ، أغسطس 2025). 📊 هیکل الرسم البیانی: ارتفاع إسفین یقترب من منطقة مقاومة ستار + 78.6 مستوى من اللیبر. یبدو أن حرکة السعر مرهقة ، والحجم یتلاشى. 🌐 التحیز الکلی: على الرغم من الزخم الصعودی المحلی ، لا یزال الاتجاه الأوسع هبوطیًا. تتسع فروق الائتمان ، والسیولة الکلیة تشد. نغمة المخاطرة تزحف فی. ملف تعریف RR: ATH هو فقط ~ 4K $ أعلاه. توفر الأهداف السلبیة مناطق مکافأة أنظف مع إبطال أکثر تشددًا. توقف وضعت فوق منطقة str. 🎯 المعلمات التجاریة ✅ دخول: بالقرب من منطقة مقاومة الست ⛔ قف: فوق خط الاتجاه العلوی / منطقة str 🟠 الهدف 1: الدعم منتصف القناة 🟢 الهدف 2: منطقة التقاء الألیاف السفلیة 🧠 تراکب الماکرو U. S. تتسع فروق الائتمان (مؤشر HY بنسبة 2.75 ٪ ، ینتشر CDS ارتفاع). مخاطر الإغلاق الحکومیة تتصاعد. Fed فی وضع إدارة المخاطر - ولیس الذعر بعد ، ولکن النغمة تتحول. أکتوبر متقلبة تاریخیا (انظر نظیر 2008) - مشاهدة الإجهاد السیولة. ⚠ TL ؛ د قصیرة btcusd هنا لیس تقنیًا فقط - إنه استراتیجی. شراؤها على ضغوط RSI + WEDGE + الإجهاد الکلی = الإعداد غیر المتماثل. المخاطر توج ، المکافأة نظیفة. دعونا نرى کیف یتم تشغیله.
إخلاء المسؤولية
أي محتوى ومواد مدرجة في موقع Sahmeto وقنوات الاتصال الرسمية هي عبارة عن تجميع للآراء والتحليلات الشخصية وغير ملزمة. لا تشكل أي توصية للشراء أو البيع أو الدخول أو الخروج من سوق الأوراق المالية وسوق العملات المشفرة. كما أن جميع الأخبار والتحليلات المدرجة في الموقع والقنوات هي مجرد معلومات منشورة من مصادر رسمية وغير رسمية محلية وأجنبية، ومن الواضح أن مستخدمي المحتوى المذكور مسؤولون عن متابعة وضمان أصالة ودقة المواد. لذلك، مع إخلاء المسؤولية، يُعلن أن المسؤولية عن أي اتخاذ قرار وإجراء وأي ربح وخسارة محتملة في سوق رأس المال وسوق العملات المشفرة تقع على عاتق المتداول.