
bL1TZZ
@t_bL1TZZ

ما هو الشيء الذي ننصحك بشراءه من المواد الغذائية؟
سابق في الشراء
پیام های تریدر
مرشح
bL1TZZ
A Spring Or Final Test Of Supply Before Markup? Bulls Load Up.

MDXUSDT قام بتصحیح نسبة هائلة بلغت 98% من أعلى مستویاته. لم یتبع الارتفاع الصعودی لـ BTC ویظل حالیًا near منطقة طلب strong. إذا أردنا اتباع مخططات ویکوف للتراکم، فمن الممکن أن ندخل المرحلة ج. بدأت المرحلة "أ" بالدعم الأولی/ذروة البیع قبل رد الفعل التلقائی بنسبة 320%. دفع هذا الارتفاع strong منطقة المقاومة لدینا إلى أعلى مما کنت أتمنى. ثم حدثت عدة حالات ST بعد SC التی أنهت المرحلة A. تحتوی المرحلة B أیضًا على عدة STs، ولکن السعر لم یصل أبدًا إلى مستویات المقاومة AR. عادة ما یحدث "الربیع" انخفاضًا قصیرًا تحت منطقة دعم TR، ومع ذلک، لم یکن هذا سیحدث حیث دخل المضاربون على الارتفاع عند 5.5 سنت، وهو نفس الانخفاض الذی تم تحقیقه خلال المرحلة B ST (الاختبار الثانوی). یمکننا أن نتوقع اختبارًا بعد الربیع (الهز النهائی/فخ الدب) أو نقطة الدعم الأخیرة دون الانهیار. یمکنک حتى القول بأن الربیع قد حدث بالفعل وهذا اختبار للإمدادات المتبقیة. کل شیء ممکن. الاختبار - یقوم المشغلون الکبار دائمًا باختبار السوق من حیث العرض خلال فترة TR (على سبیل المثال، STs والینابیع) وعند key نقاط أثناء تقدم السعر. إذا ظهر عرض کبیر فی الاختبار، فغالبًا ما یکون السوق غیر جاهز للزیادة. توجد عدة أسباب لتکون صعودیة والتی تشمل - 8 قامت مؤشرات التذبذب مؤخرًا بطباعة تباعد بمطرقة صعودیة لبدء الإجراءات. یستمر مؤشر القوة النسبیة فی تحقیق أدنى مستویاته وأعلى مستویاته. یظهر ملف تعریف الحجم الضخم near أدنى مستویات نطاق التداول مما یقلل بسرعة من الارتفاع. 10D/أسبوعی مؤشر ستوکاستیک الصاعد یتقاطع مع مستویات التشبع فی البیع near. یقع السعر حالیًا فوق المتوسط المتحرک البسیط الأسبوعی 10/21 یومًا بینما یقترب من أول تقاطع على الإطلاق. فی الیوم الثانی، یقترب المتوسط المتحرک البسیط 50 + 200 بوصة من أول صلیب ذهبی على الإطلاق. أظهر الثیران تصمیمًا کبیرًا على الاحتفاظ بمنطقة الدعم البالغة 5.5 سنتًا - 6 سنتًا. هل من الممکن أن ینخفض السعر أکثر؟ بالتأکید. وجود استراتیجیة هو key. یحتاج المضاربون على الانخفاض إلى کسر strong مدعومًا بحجم التداول مع فترة طویلة دون الدعم لإبطال هذا idea. قد تؤدی عملیات البیع strong فی السوق أیضًا إلى الضغط على المضاربین على الارتفاع. ما هی المرحلة ج؟ فی المرحلة C، یمر سعر السهم باختبار حاسم للعرض المتبقی، مما یسمح لمشغلی "الأموال الذکیة" بالتأکد مما إذا کان السهم جاهزًا للترمیز. الربیع هو تحرک السعر تحت مستوى دعم TR (الذی تم إنشاؤه فی المرحلتین A وB) والذی ینعکس بسرعة ویعود مرة أخرى إلى TR. إنه مثال على فخ الدببة لأن الانخفاض تحت الدعم یبدو أنه یشیر إلى استئناف الاتجاه الهبوطی. ولکن فی الواقع، یمثل هذا بدایة اتجاه صعودی جدید، مما یؤدی إلى محاصرة البائعین المتأخرین (الدببة). فی طریقة ویکوف، یوفر الاختبار الناجح للعرض الذی یمثله الربیع (أو الهزة) فرصة تداول عالیة الاحتمال. یشیر الربیع ذو الحجم المنخفض (أو اختبار الحجم المنخفض للهزة) إلى أنه من المرجح أن یکون السهم جاهزًا للتحرک لأعلى، لذلک یعد هذا هو الوقت المناسب لبدء مرکز طویل جزئی على الأقل. ما هو Mdex(MDX)؟ Mdex عبارة عن بورصة لامرکزیة لصناعة السوق تلقائیًا تعتمد على مفهوم مجمعات الأموال. Mdex یقترح وینفذ نموذج DEX ثنائی السلسلة استنادًا إلى سلسلة Heco وEthereum. تجمع Mdex بین مزایا رسوم المعاملات المنخفضة لسلسلة Heco وازدهار النظام البیئی Ethereum. مع MDEX، یمکن للمستخدمین أیضًا المشارکة فی آلیة التعدین المزدوج لتعدین السیولة والتعدین التجاری. تلتزم Mdex ببناء أکبر منصة DeFi تدمج DEX وIMO وDAO على Heco وEthereum. القیمة السوقیة الحالیة - 70 ملیونًا. إمدادات التداول - 950.25 ملیونًا الإعداد المضاربة، DYOR + DD. حظا سعیدا! تعلیق: 1 أسبوع المذبذبات
bL1TZZ
Chainlink - Did We Just Witness Wykoff Accumulation?

To all my fellow traders, speculators and gamblers, its been some time since my last post. I hope you've all been well, and most importantly, bathing in huge profits :) It seems like Chainlink followed textbook Wykoff Accumulation Schematics. Not the most perfect schematics, notably PS ( Prelim Support) falling a little short of the soon to be Resistance Lines. In addition, BU only touched the resistance turned support once before rocketing up. However the first PS does line up with the BU and subsequent SOS (Show Of Strength) Phase A includes a number of additional ST ( Secondary Test) which is common after the SC (Selling Climax) stage. The selling Climax should've marked the lowest point, but price action made a lower low after the AR (Auto Rally) But it was merely a 19c difference. Price still stayed within the TR(Trading Range) and bounced from the support lines. The AR also marked the highest point within the trading range. These are all minor discrepancies as price action continued to follow Wykoff theory. We had multiple touches of the Support / Resistance lines, along with a perfect Spring (Final Shakeout/Bear Trap), Test and LPS, followed by a BU + SOS. It took approximately 533 days from the SC (Selling Climax) to the TR (Trading Range) breakout, The longer the accumulation period, the stronger the "Spring". Does this mean price will continue north? Not necessarily, we've all seen these schematics fail. After all, Chainlink is up over 305% since the $4.65 Spring/Shakeout/Bear Trap lows. That would've made an awesome long entry. However, price is still way below its $53 ATH, so anything is possible. Having a quick look we could see that price is currently at resistance levels. A break from the 19$ range could initiate further upside. Like the majority of the market, the crypto king (BTC) will probably dictate Chainlinks next move. If we are to follow Wykoff theory, we could expect further upside. I made a post back in May 22' private post titled "Link... Whales have been accumulating" I remember reading many articles at the time that stated big players were buying up Chainlink. Price action also found support at various Fibonacci levels, in addition to strong buy signals. RSI Levels were at record lows, in addition to a whopping 90% correction at the time. Unfortunately, I never got around to publishing that idea, it would've made a fantastic post. I am no expert on Wykoff theory, so I've included information taken from various online sources. Hopefully it helps, Much love and lots of profits to you all. What is Wyckoff Accumulation? Each cycle in the market begins with accumulation. This phase is marked by a range trend, where the market is relatively stable and rangebound. During this phase, institutional investors buy the stock at lower prices. Also, the volume tends to decline in this phase because the buying interest gradually absorbs the selling pressure. Another way to confirm accumulation is to look at the support level. You may notice higher lows, indicating that the buyers are gaining power. Slowly, the trading volume begins to rise. This is a key indicator of the shift in sentiment and suggests a breakout trend. As the accumulation progresses, you may see signs of strength in the price action, where the asset breaks above the trading range’s upper boundary. This breakout often indicates that the market is ready for an upward move. During the Wyckoff Accumulation process, smart money builds substantial positions at favourable prices before the broader market realizes the potential for an upward move. The accumulation may resemble a “compressed spring” on the chart. The longer it is, the better the indication of a breakout. Markup: The second phase of accumulation is the markup, which follows a breakout. According to Wyckoff, traders should find entry points through the pullback zones in this phase. Wyckoff Events PS— Preliminary Support , where substantial buying begins to provide pronounced support after a prolonged down-move. Volume increases and price spread widens, signalling that the down-move may be approaching its end. SC— Selling Climax, the point at which widening spread and selling pressure usually climaxes and heavy or panicky selling by the public is being absorbed by larger professional interests at or near a bottom. Often price will close well off the low in a SC, reflecting the buying by these large interests. AR— Automatic Rally , which occurs because intense selling pressure has greatly diminished. A wave of buying easily pushes prices up; this is further fueled by short covering. The high of this rally will help define the upper boundary of an accumulation TR. ST— Secondary Test , in which price revisits the area of the SC to test the supply/demand balance at these levels. If a bottom is to be confirmed, volume and price spread should be significantly diminished as the market approaches support in the area of the SC. It is common to have multiple STs after a SC. Springs or shakeouts usually occur late within a TR and allow the stock’s dominant players to make a definitive test of available supply before a markup campaign unfolds. A “spring” takes price below the low of the TR and then reverses to close within the TR; this action allows large interests to mislead the public about the future trend direction and to acquire additional shares at bargain prices. A terminal shakeout at the end of an accumulation TR is like a spring on steroids. Shakeouts may also occur once a price advance has started, with rapid downward movement intended to induce retail traders and investors in long positions to sell their shares to large operators. Test — Large operators always test the market for supply throughout a TR (e.g., STs and springs) and at key points during a price advance. If considerable supply emerges on a test, the market is often not ready to be marked up. A spring is often followed by one or more tests; a successful test (indicating that further price increases will follow) typically makes a higher low on lesser volume. SOS — Sign Of Strength , a price advance on increasing spread and relatively higher volume. Often a SOS takes place after a spring, validating the analyst’s interpretation of that prior action. LPS—Last Point of Support , the low point of a reaction or pullback after a SOS. Backing up to an LPS means a pullback to support that was formerly resistance, on diminished spread and volume. On some charts, there may be more than one LPS, despite the ostensibly singular precision of this term. BU—“Back-Up” . This term is short-hand for a colourful metaphor coined by Robert Evans, one of the leading teachers of the Wyckoff method from the 1930s to the 1960s. Evans analogized the SOS to a “jump across the creek” of price resistance, and the “back up to the creek” represented both short-term profit-taking and a test for additional supply around the area of resistance. A back-up is a common structural element preceding a more substantial price mark-up, and can take on a variety of forms, including a simple pullback or a new TR at a higher level. Each Phase Explained. Phase A: Phase A marks the stopping of the prior downtrend. Up to this point, supply has been dominant. The approaching diminution of supply is evidenced in preliminary support (PS) and a selling climax (SC). These events are often very obvious on bar charts, where widening spread and heavy volume depict the transfer of huge numbers of shares from the public to large professional interests. Once these intense selling pressures have been relieved, an automatic rally (AR), consisting of both institutional demand for shares as well as short-covering, typically ensues. A successful secondary test (ST) in the area of the SC will show less selling than previously and a narrowing of spread and decreased volume, generally stopping at or above the same price level as the SC. If the ST goes lower than that of the SC, one can anticipate either new lows or prolonged consolidation. The lows of the SC and the ST and the high of the AR set the boundaries of the TR. Horizontal lines may be drawn to help focus attention on market behaviour. Sometimes the downtrend may end less dramatically, without climactic price and volume action. In general, however, it is preferable to see the PS, SC, AR and ST, as these provide not only a more distinct charting landscape but a clear indication that large operators have definitively initiated accumulation. In a re-accumulation TR (which occurs during a longer-term uptrend), the points representing PS, SC and ST are not evident in Phase A. Rather, in such cases, Phase A resembles that more typically seen in distribution (see below). Phases B-E generally have a shorter duration and smaller amplitude than, but are ultimately similar to, those in the primary accumulation base. Phase B: In Wyckoffian analysis, Phase B serves the function of “building a cause” for a new uptrend (see Wyckoff Law #2 – “Cause and Effect”). In Phase B, institutions and large professional interests are accumulating relatively low-priced inventory in anticipation of the next markup. The process of institutional accumulation may take a long time (sometimes a year or more) and involves purchasing shares at lower prices and checking advances in price with short sales. There are usually multiple STs during Phase B, as well as upthrust-type actions at the upper end of the TR. Overall, the large interests are net buyers of shares as the TR evolves, with the goal of acquiring as much of the remaining floating supply as possible. Institutional buying and selling imparts the characteristic up-and-down price action of the trading range. Early on in Phase B, the price swings tend to be wide and accompanied by high volume. As the professionals absorb the supply, however, the volume on downswings within the TR tends to diminish. When it appears that supply is likely to have been exhausted, the stock is ready for Phase C. Phase C: It is in Phase C that the stock price goes through a decisive test of the remaining supply, allowing the “smart money” operators to ascertain whether the stock is ready to be marked up. As noted above, a spring is a price move below the support level of the TR (established in Phases A and B) that quickly reverses and moves back into the TR. It is an example of a bear trap because the drop below support appears to signal resumption of the downtrend. In reality, though, this marks the beginning of a new uptrend, trapping the late sellers (bears). In Wyckoff's method, a successful test of supply represented by a spring (or a shakeout) provides a high-probability trading opportunity. A low-volume spring (or a low-volume test of a shakeout) indicates that the stock is likely to be ready to move up, so this is a good time to initiate at least a partial long position. The appearance of a SOS shortly after a spring or shakeout validates the analysis. As noted in Accumulation Schematic #2, however, the testing of supply can occur higher up in the TR without a spring or shakeout; when this occurs, the identification of Phase C can be challenging. Phase D: If we are correct in our analysis, what should follow is the consistent dominance of demand over supply. This is evidenced by a pattern of advances (SOSs) on widening price spreads and increasing volume, as well as reactions (LPSs) on smaller spreads and diminished volumes. During Phase D, the price will move at least to the top of the TR. LPSs in this phase are generally excellent places to initiate or add to profitable long positions. Phase E: In Phase E, the stock leaves the TR, demand is in full control and the markup is obvious to everyone. Setbacks, such as shakeouts and more typical reactions, are usually short-lived. New, higher-level TRs comprising both profit-taking and acquisition of additional shares (“re-accumulation”) by large operators can occur at any point in Phase E. These TRs are sometimes called “stepping stones” on the way to even higher price targets. Who Was Richard Wykoff? Richard Demille Wyckoff (1873–1934) was an early 20th-century pioneer in the technical approach to studying the stock market. He is considered one of the five “titans” of technical analysis, along with Dow, Gann, Elliott, and Merrill. At age 15, he worked as a stock runner for a New York brokerage. Afterward, while still in his 20s, he became the head of his firm. He also founded and, for nearly two decades, wrote and edited The Magazine of Wall Street, which, at one point, had more than 200,000 subscribers. Wyckoff was an avid student of the markets, as well as an active tape reader and trader. He observed the market activities and campaigns of the legendary stock operators of his time, including JP Morgan and Jesse Livermore. From his observations and interviews with those big-time traders, Wyckoff codified the best practices of Livermore and others into laws, principles, and techniques of trading methodology, money management, and mental discipline. Mr. Wyckoff observed numerous retail investors being repeatedly fleeced. Consequently, he dedicated himself to instructing the public about “the real rules of the game” as played by the large interests, or “smart money.” In the 1930s, he founded a school that would later become the Stock Market Institute. The school's central offering was a course that integrated the concepts that Wyckoff had learned about identifying large operators' accumulation and distribution of stock with how to take positions in harmony with these big players. His time-tested insights are as valid today as they were when first articulated. Speculative Setup, DYOR.
bL1TZZ
The Crypto Commander-In-Chief & The Fibonacci Golden Pocket.

نه، این یک "ایدهی کوتاهمدت" نیست، بلکه نگاهی است به سقفهای قبلی بازار و اصلاحات متعاقب آن. ۲۰۱۳ - در نوامبر BTC در حدود ۱۱۶۳ دلار به اوج خود میرسد. اگر خوش شانس بودید و چند سال قبلتر bitty را فقط با ۲ دلار خریده بودید، بازدهی فوقالعاده %۵۰,۰۰۰ نصیبتان میشد. سپس قیمت یک اصلاح شگفتانگیز %۸۶.۷ را تجربه میکند و در سطح ۰.۶۱۸ فیبوناچی به کف میرسد. یک دورهی انباشت ۲ ساله آغاز میشود. مجموعاً ۴۰۶ روز طول کشید تا BTC کف قیمت را پیدا کند و دقیقاً ۱۰۶۴ روز (۳۵ ماه) از آن کف تا اوج ۲۰۱۷ طول کشید. ۲۰۱۷ - به لطف Bitfinex و همکاران، پادشاه ارزهای دیجیتال در دسامبر ۲۰۱۷ در قیمت ۲۰ هزار دلار به اوج خود میرسد و به دنبال آن یک اصلاح ۸۵ درصدی رخ میدهد و قیمت در سطح ۰.۶۱۵ فیبوناچی به کف میرسد. یک جهش شگفتانگیز %۱۲,۸۵۰ از کفهای ۲۰۱۵ در قیمت ۱۵۵ دلار. حدود ۳۶۴ روز طول کشید تا BTC کف قیمت را پیدا کند و از قضا، ۱۰۷۱ روز قبل از بالاترین قیمت تاریخی بعدی - تنها یک هفته تفاوت از دورهی کف تا اوج ۲۰۱۵-۲۰۱۷. ۲۰۲۱ - BTC یک رکورد تاریخی جدید ۶۹۰۰۰ دلاری ثبت میکند، یک صعود واقعاً تماشایی. تصور اینکه زمانی قیمت آن ۰.۰۱ سنت بوده، حیرتانگیز است. یک رشد جالب %۲,۱۵۰ از کفهای ۲۰۱۸ در حدود ۳۱۰۰ دلار. با این حال، زمانی که hit به قیمت ۱۷۷۰۰ دلار رسید، ۷۴ درصد از ارزش آن از بین رفته بود. این همچنین اولین باری است که BTC از بالاترین قیمت تاریخی قبلی خود پایینتر میرود. قیمت هنوز در حدود سطح ۰.۳۸۲ فیبوناچی در نوسان است، اگر این سطح شکسته شود، احتمالاً به سطح ۰.۵ فیبوناچی رفت که با رالی ناموفقی که منجر به اوج ۲۰۱۹ شد نیز همراستا است. اگر BTC اصلاح ۸۴ درصدی مشابه گذشته داشته باشد، بار دیگر از منطقهی مشهور جیب طلایی فیبوناچی بازدید کرد. جیب طلایی دارای حجم معاملات بالایی است، من شکی ندارم که گاویهای بلندمدت به دنبال خرید از آن منطقه بود (البته اگر اصلاً به آنجا برسد). نکتهی دیگری که باید به آن توجه کرد این است که تقریباً یک دورهی ۴ ساله بین سقفهای بازار وجود دارد. در واقع، مدت زمان بین سقف ۲۰۱۳ و سقف ۲۰۱۷، ۱۴۷۰ روز (۴۸.۳۲ ماه) بود، تنها ۳۵ روز بین دورهی سقف به سقف ۲۰۱۷-۲۰۲۱ به مدت ۱۴۳۵ روز (۴۷.۱۷ ماه) فاصله وجود دارد. اگر BTC از یک چرخهی مشابه پیروی کند، این به طور بالقوه میتواند به معنای یک اوج تاریخی جدید در اکتبر ۲۰۲۵ باشد. BTC حتی میتواند از همین جا به شدت صعود کند، چه کسی میداند، فقط زمان مشخص کرد. انباشت، افزایش قیمت، توزیع - صعود و تکرار، قرنهاست که این اتفاق میافتد. تعصب من بدون تغییر باقی میماند، تمام ایدههایی که منتشر میکنم بلندمدت هستند و برای سرمایهگذاران بلندمدت مناسب هستند. کسانی که به دنبال ثروتمند شدن سریع هستند بیشتر شبیه قمارباز هستند، نه سرمایهگذار. من معتقدم که اکنون زمان انباشت است. میانگین هزینه دلار در پروژههای مورد علاقهتان قطعاً اکنون جذابتر از یک سال پیش است. بسیاری از کوینها به صفر رسید، برخی ممکن است ۱۰ تا ۱۰۰ برابر شوند. داشتن یک استراتژی کلیدی است. خودتان تحقیق کنید. بالاخره - "بازار ابزاری است برای انتقال پول از افراد بیحوصله به افراد صبور." - وارن بافت. امیدوارم این به سرمایهگذاران، معاملهگران و قماربازان همکارم کمک کند. موفق باشید! راهاندازی سفتهبازانه، DYOR (تحقیق شخصی خود را انجام دهید).
bL1TZZ
META- Undervalued & Oversold.
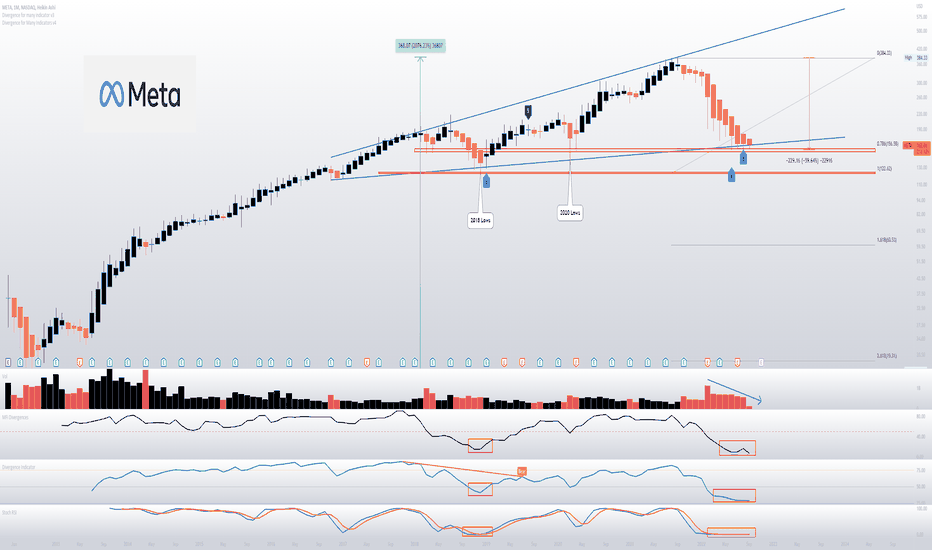
Market Cap - 426 Billion META has been on a 9 year bull run, in that period, it has firmly cemented itself as a digital marketing juggernaut. When it reached its all time high of $384.33 back in September 2021, it had an enormous market cap of 1.064 trillion dollars. At the time, it was only the fifth U.S. company to hit the milestone , joining Apple , Microsoft , Amazon and Google-parent company Alphabet . However the last 12 months have been somewhat brutal for Zuckerberg & co, the share price has dropped a staggering 60% to date, making this the biggest correction Meta has ever endured. Economic uncertainty, regulatory pressure and more recently, a first ever earnings miss, investors were quick to hit the panic button & add to the selling pressure. In February, Meta went down in history for the biggest one-day crash in the stock market. The company’s stock lost about $230 billion in market value in a single day. Meta revenue slipped to $28.8 billion in the second quarter, missing the $28.9 billion analyst estimate. Gross profit was $23.6 billion, down 0.5% from the equivalent quarter last year. In April, Apple introduced a change to its privacy policy that requires apps to ask users if they want to be tracked, this made META's ad selling business less affective, with only a reported 16% of users agreeing to be tracked. The privacy crackdown is set to cost Meta at least $10 billion in lost sales in 2022 alone. As a result of the data drought, Meta shifted their ad spending to Google because its flagship search-ad business relies on customer intent—users’ search terms immediately reveal what they are interested in—rather than data collected from app and web tracking. Google , the world’s largest digital-ad company by revenue, generated its highest sales growth in more than a decade in the third quarter. The sensational rise of short-video sharing app TikTok, has seen many users defect with approximately 1.4 billion monthly active users now on the popular platform. This is quickly approaching Instagram, which has approximately 2 billion monthly active users. This year, TikTok is on track to triple worldwide ad revenues, to $11.6bn, more than the $10.44bn for Snapchat and Twitter combined. This forced META to focus more on short-videos in the form of "Reels". Reels recently reached $1 billion in annualized revenue for the first time, Reels now has a higher revenue run rate than Facebook /Instagram Stories at identical times post-launch. Mark Zuckerberg is betting his company’s future on the metaverse — a virtual space in which people interact with each other using avatars and developing AR / VR technology. He said that he plans to invest heavily in his company’s metaverse ambitions & that will mean losing significant amounts of money on the project in the next three to five years. This massive shift has shaken up already nervous investors, however should one of its Reality Labs products change the world, it would be the jolt this company needs to continue funding its ambitions. The company once suffered a colossal 19% drop in 2018 after posting disappointing revenue and user figures for the second quarter of that year, however it bounced back before going on to make all time highs. Facebook has 2.74 billion monthly active users, No other platform offers this kind of reach. Facebook is the world’s third-most visited website- outranked only by Google and YouTube. It’s also the top Google search query. Facebook is the second-most downloaded free app in the App Store. 63% of the U.S. population over age 12 uses Facebook . 32.4% of Facebook’s audience is aged 25-34. Seniors are the fastest-growing group of Facebook users. More than 37% of people born in 1945 or earlier are on Facebook , up from 26% a year earlier. 74% of high-income earners use Facebook For those earning $75,000 or more, Facebook is the preferred social network. Facebook is also the most popular social network (besides YouTube) for college graduates, with 74% of them using the platform. LinkedIn again comes second with this group, at 51%. Facebook users spend 34 minutes per day using the platform. 36% of people get news from Facebook . 79.9% of Facebook users only access the platform on a mobile device. An average Facebook user clicks on 12 ads per month. Facebook has an advertising audience of 2.14 billion. Meta's balance sheet includes $40 billion in cash, equivalents and short term investments, with $16 billion in total debt (although some of this may include operating liabilities). The firm's free cash flow generation is very strong, with $8.5 billion generated in the quarter, up 8.9% year over year. $5 billion worth of stock was approved for purchase in the second quarter. In addition, the company authorized another $24.32 billion for stock repurchases. Meta further reduced its full-year operating expense during its latest earnings update. Its current operating expense guidance sits at $85.0-$87.0 billion for 2022 From a TA point of view, there are a number of reasons to be bullish which include- - A very strong oversold signal (not shown due to limitations using invite-only scripts on public ideas) - 9 + 5 oscillators recently printing divergence -look left, - RSI / MFI / Stochastic are all oversold & sit @ record lows, - Pulling a fib from the 2018 lows, we could see that price currently sits @ the 0.786 Fibonacci level, - Decreasing selling volume, - Support trendline being tested. Should the 0.786 / support trendline not hold, long-term bulls should look for buys @ 2018/2020 lows. Can price drop further? Sure! Timing tops or bottoms is not my thing. Will Zuckerberg's metaverse gamble pay off? Only time will tell. As it stands, Meta remains in a strong position with enormous reach, should the massive investment in metaverse pay off, there is no doubt that Meta will go on to make new highs. Speculative Setup, DYOR. Strictly a long term play. Allow 24-72 Months for this idea."there is no doubt that Meta will go on to make new highs" And a new All time high was most certainly made. Price did fall below our 2018/2020 buy zone by approximately %28, but the bulls staged a sensational rally with a 452% move to the upside. Congratulations to those who took this trade!
bL1TZZ
VeChain/USDT. Testing the 0.5 Fibonacci.

القیمة السوقیة الحالیة 1.69 ملیار دولار منذ أن انخفضت إلى 0.00157 خلال موجة البیع فی 20 مارس، ارتفعت VeChain بأکثر من 17000% إلى أعلى مستوى عند 27.9 سنتًا! بعد فترة وجیزة، تم طباعة "بیع لا یصدق"، ولا ینبغی تجاهل هذه الإشارات على مستویات أعلى. منذ ذلک الحین، تم تصحیح السعر بأکثر من 92% ووجد نفسه عند مستوى فیبوناتشی 0.5 (2 سنتًا) هذه المنطقة هی أیضًا مقاومة سابقة یتم اختبارها الآن کدعم. لدینا أیضًا إشارة شراء مشروطة غیر مؤکدة. إذا لم یصمد المستوى 0.5، فیجب على الثیران على المدى الطویل البحث عن عملیات شراء فی الجیب الذهبی (1 سنت) هذه المنطقة هی منطقة دعم / طلب / مقاومة ثانویة سابقة. یکمل POC مستوى 0.786، (نصف سنت) یجب على الثیران على المدى الطویل إعادة التحمیل مرة أخرى. یظهر ملف تعریف الحجم الأکبر بین 0.3 - 1 سنت. یشکل مؤشر القوة النسبیة إسفینًا هابطًا لطیفًا، وقد یؤدی الاختراق + HH إلى بدء ارتفاع. مؤشر ستوکاستیک مفرط البیع. انخفض حجم البیع ببطء بمرور الوقت. توقیت القمم / القیعان لیس مهمًا ولا یعمل. إن DCA فی مشاریعک المفضلة التی تؤمن بها هو الأفضل. حول.. VeChain هی منصة بلوکتشین مؤسسیة تهدف إلى توفیر رؤیة کاملة للمنظمة من خلال فصل المعلومات عن data الصوامع. تخطط VeChain أیضًا لتصبح منصة رائدة للعروض الأولیة للعملات (ICOs) وإجراء المعاملات بین الأجهزة المتصلة بإنترنت الأشیاء (IoT). VeChain یستخدم رمزین: VeChain الرمز (VET) کطبقة قیمة وVeChain طاقة ثور (VTHO) کطبقة عقد ذکیة. إعداد مضاربی، DYOR. یُسمح بفترة تتراوح من 3 إلى 18 شهرًا أو أکثر لجمیع أفکار التشفیر. یُنسب الفضل إلى without_worries للسماح باستخدام المؤشرات.
bL1TZZ
Disregard The Noise. XRP Will Eventually Pump. Bulls Load Up.

أولاً وقبل کل شیء، أنا لست من أکبر المعجبین بهذا الشیء المرکزی المسمى XRP. لا أحب الدعاة على YouTube الذین ینشرون القمامة مثل "XRP إلى 10 آلاف، 25 ألفًا، 50 ألفًا، 100 ألف"، "إعادة الضبط العظیمة" وما إلى ذلک. لکن المشاعر لا تهم هنا، وکما یقول مرشدی مرارًا وتکرارًا - "رجل العواطف، قاتل الأموال" منذ أن وصل إلى 10 سنتات خلال عملیات البیع فی 20 مارس، ارتفع السعر بعد ذلک بنسبة 1800٪ إلى 1.96 دولار، ثم تمت طباعة "البیع العظیم" وتم تصحیح السعر منذ ذلک الحین بنسبة 85٪ إلى 29 سنتًا. لم یرتفع XRP مرة أخرى مثل بقیة السوق، ولم یستمر فی تحقیق ارتفاع جدید مثل بقیة العملات العشر الأولى، ویرجع ذلک أساسًا إلى ملحمة SEC بأکملها، والتی أنا متأکد من أن الجمیع على درایة بها الآن. یحوم السعر حالیًا فی جیب فیبوناتشی الذهبی، ویمکن العثور على ملف تعریف حجم کبیر بین هناک ومستوى فیبوناتشی 0.786 (19 سنتًا) "شراء لا یصدق" مشروط مع 5 مذبذبات صعودیة. ستوکاستیک تشبع بیعی. یجب أن یکون الثیران على المدى الطویل الآن متوسط تکلفة الدولار فی مراکزهم. سیکون الشراء من 17 - 19 سنتًا ممتازًا. هل یمکن أن ینخفض السعر أکثر؟ بالتأکید، لا أحاول توقیت القمم أو القیعان. معنویات السوق هبوطیة للغایة. النظام المالی معقد بشکل لا یمکن فهمه، ولا یمکن لأحد، بما فی ذلک بنک الاحتیاطی الفیدرالی، الاستعداد لکل سیناریو محتمل مع شروعه فی برنامج التشدید الکمی الأکثر طموحًا حتى الآن. کیف سیؤثر هذا على العملات المشفرة؟ الوقت وحده هو الذی سیخبرنا! XRP لدیه قاعدة داعمة قویة وأعتقد أنه بمرور الوقت، ستستمر Ripple فی جذب العملاء من المؤسسات المالیة العشرة آلاف التی تمتلکها Swift على جدول الرواتب. حظا سعیدا! الإعداد المضاربی، من صنعک. یُسمح بمرور 3-18 شهرًا لجمیع أفکار التشفیر. الفضل یعود إلى without_worries للسماح باستخدام المؤشرات.
bL1TZZ
PolkaDot. In The Golden Pocket.

القیمة السوقیة 6.9 ملیار ارتفع بنسبة 2600% قبل التباعد الهبوطی لمؤشر القوة النسبیة + "البیع المذهل"، حیث ارتد السعر إلى مستوى 0.5 فیبوناتشی، قبل أن یرتفع مرة أخرى إلى أعلى مستوى له عند 55 دولارًا. وقد صحح السعر منذ ذلک الحین بنسبة 88% لیجد نفسه فی منطقة الجیب الذهبی. لدینا أیضًا أول إشارة "شراء مذهلة" + مؤشر ستوکاستیک ذروة البیع. هل هذا یعنی أن القاع موجود؟ لا أعرف، أنا لا أحاول توقیت القمم أو القیعان. یجب على المضاربین على الارتفاع على المدى الطویل DCA (متوسط تکلفة الدولار) مع إعادة الدخول عند 4 دولارات، وهو مستوى 0.786 فیبوناتشی، ویمکن العثور على بعض ملفات تعریف الحجم الکبیرة هناک. هل یمکن أن ینخفض السعر أکثر؟ بالتأکید! الإعداد المضاربة، DYOR. اسمح بفترة تتراوح من 3 إلى 18 شهرًا لجمیع أفکار التشفیر. الائتمان لwithout_worries للسماح باستخدام المؤشرات. التعلیق: معدل HA MFI الأسبوعی هو @ 0.02! التعلیق: یرتد السعر من منطقة إعادة التحمیل 0.786 / POC. وقد ارتفع السعر بنسبة 235% تقریبًا منذ ذلک الحین. تقوم الآن 7 مؤشرات تذبذب بطباعة تباعد على الرسم البیانی DOT/BTC لمدة أسبوعین. اختراق محتمل لخط الاتجاه + اختبار خلفی واحتمال تباعد صعودی ضخم لمؤشر القوة النسبیة (RSI).
bL1TZZ
UniSwap- MFI EXTREMLY Oversold. Bulls Load Up.

القیمة السوقیة 3.1 ملیار ارتفع بنسبة 2400% قبل مؤشر RSI Bear Div ونتائج "البیع المذهل". قام السعر بتصحیح 92% منذ ذلک الحین وتم ابتلاعه من مستوى 0.786 فیبوناتشی. ملف تعریف کبیر الحجم فی هذا النطاق مع POC حوالی 3.80 دولارًا مؤشر Heikin Ashi Money Flow الأسبوعی یصل إلى 0.11! مؤشر ستوکاستیک فی ذروة البیع. یجب على الثیران على المدى الطویل الآن DCA. هل یمکن أن ینخفض أکثر؟ بالتأکید. لا أحاول توقیت القمم أو القیعان. الإعداد المضاربة، DYOR. اسمح بفترة تتراوح من 3 إلى 18 شهرًا لجمیع أفکار التشفیر. الائتمان لwithout_worries للسماح باستخدام المؤشرات. التعلیق:
إخلاء المسؤولية
أي محتوى ومواد مدرجة في موقع Sahmeto وقنوات الاتصال الرسمية هي عبارة عن تجميع للآراء والتحليلات الشخصية وغير ملزمة. لا تشكل أي توصية للشراء أو البيع أو الدخول أو الخروج من سوق الأوراق المالية وسوق العملات المشفرة. كما أن جميع الأخبار والتحليلات المدرجة في الموقع والقنوات هي مجرد معلومات منشورة من مصادر رسمية وغير رسمية محلية وأجنبية، ومن الواضح أن مستخدمي المحتوى المذكور مسؤولون عن متابعة وضمان أصالة ودقة المواد. لذلك، مع إخلاء المسؤولية، يُعلن أن المسؤولية عن أي اتخاذ قرار وإجراء وأي ربح وخسارة محتملة في سوق رأس المال وسوق العملات المشفرة تقع على عاتق المتداول.