
artemfedorov
@t_artemfedorov

ما هو الشيء الذي ننصحك بشراءه من المواد الغذائية؟
سابق في الشراء
پیام های تریدر
مرشح
artemfedorov
Crypto market review and potential trade opportunities
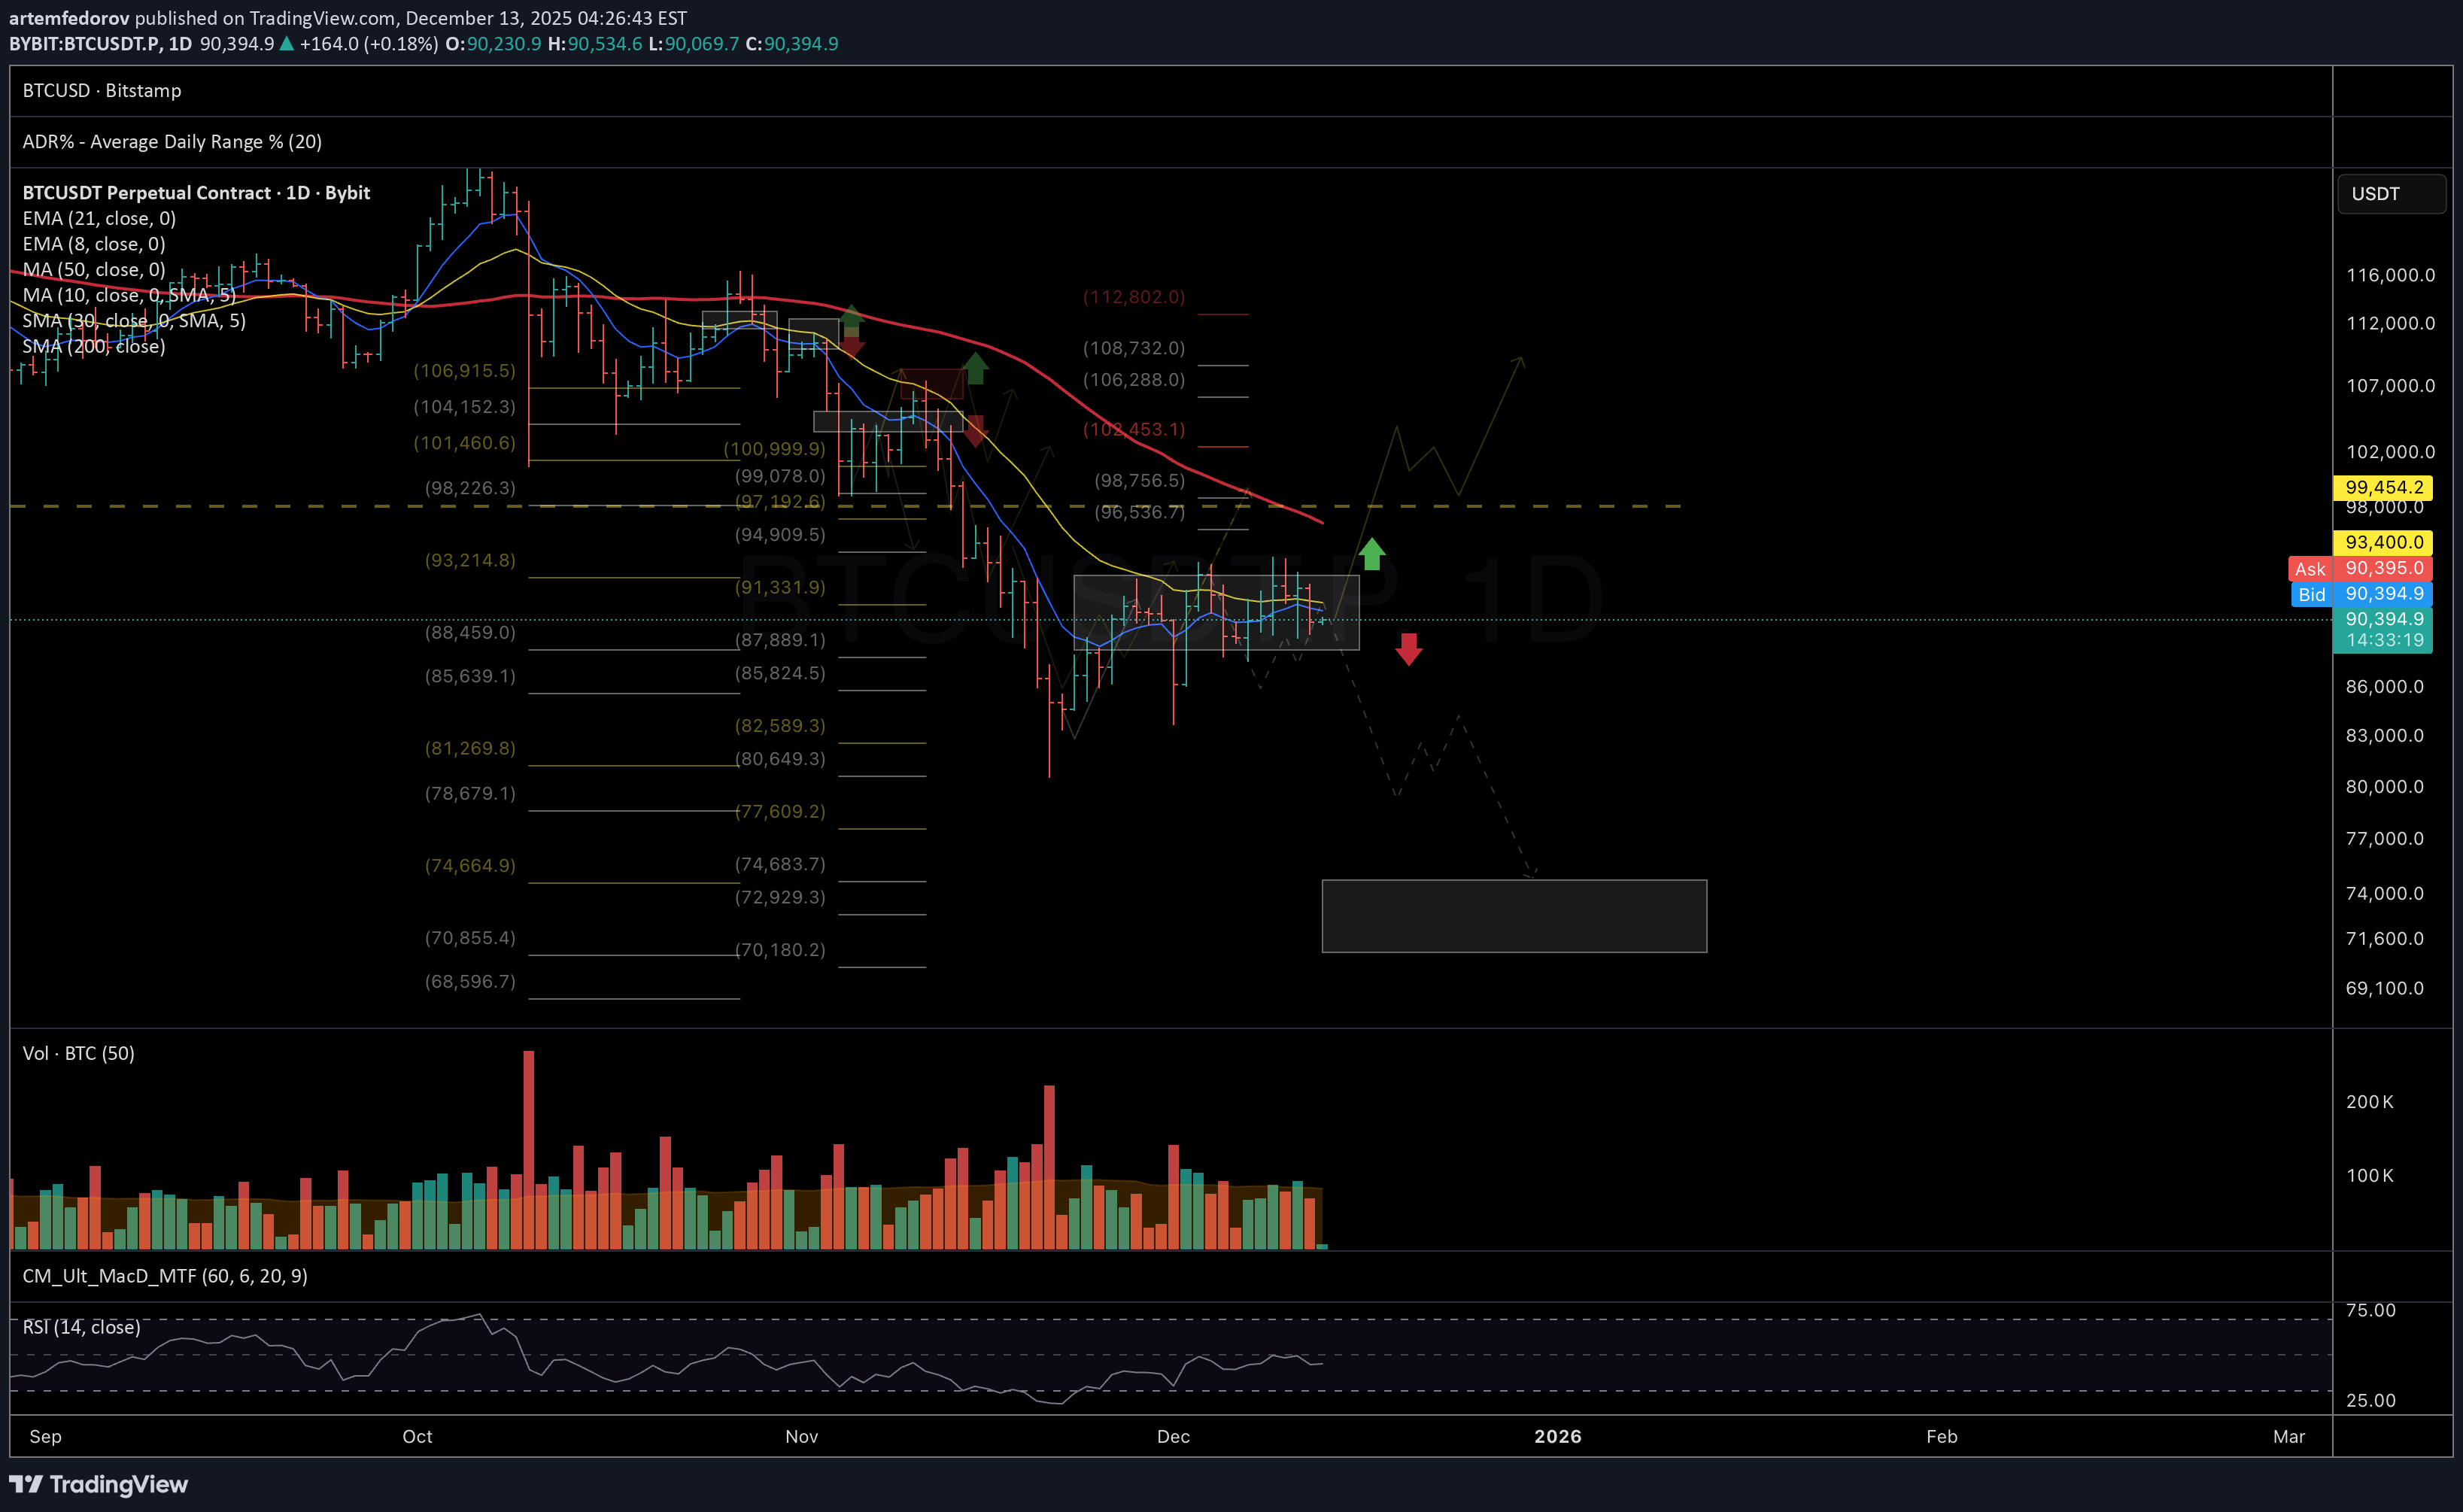
بعد کسر مستویات الدعم الکلی الرئیسیة (راجع مراجعاتی فی أکتوبر/نوفمبر)، انتقل BTC إلى اتجاه هبوطی قوی. وفی الوقت الحالی، ینبغی النظر أولاً إلى أی ارتداد نراه على أنه مجرد مرحلة تصحیحیة - ولیس بدایة ارتفاع کامل. من هیکل التصحیح قبالة أعلى مستویات شهر أکتوبر، یبدو الانخفاض إلى منطقة 75 ألفًا إلى 71 ألفًا وکأنه حرکة أکثر نظافة. وهذا من شأنه أن یسمح لنا بتسمیة الموجة الأولى من هذا التصحیح التی تمت بأسلوب کلاسیکی مکون من 5 موجات من أعلى مستویاته على الإطلاق. BTC الرسم البیانی: على المدى القصیر، تبدو الأمور أکثر غموضًا، حیث یتوقف الأمر کله على حرکة السعر فی الأیام المقبلة. •إذا اخترقنا بشکل مقنع أعلى مستویات شهر دیسمبر عند 94.6 ألفًا، فسیفتح ذلک الباب أمام مستویات 102.5-106 ألفًا، مع احتمال امتداده إلى 112 ألفًا. •ولکن إذا انخفض السعر إلى ما دون أدنى مستویاته الأخیرة عند 89 ألفًا و87.5 ألفًا، فإن هذا التصحیح الأعمق إلى 75 ألفًا - 71 ألفًا یبدأ فی الظهور على الأرجح. بالنسبة لتداولات العملات البدیلة، فإن البیع ZEC إذا انخفض إلى ما دون 445 (الخطر عند 476، أهداف الربح الأولى 355-340) یبدو أکثر إلحاحًا بالنسبة لی من حیث المخاطرة والمکافأة ZEC الرسم البیانی: أتمنى للجمیع الاسترخاء، وعطلات نهایة الأسبوع المشمسة المقبلة!
artemfedorov
بررسی هفتگی رمز ارز: آیا بیت کوین وارد زمستان کریپتو میشود؟ (تحلیل کلان و کوتاهمدت نزولی)
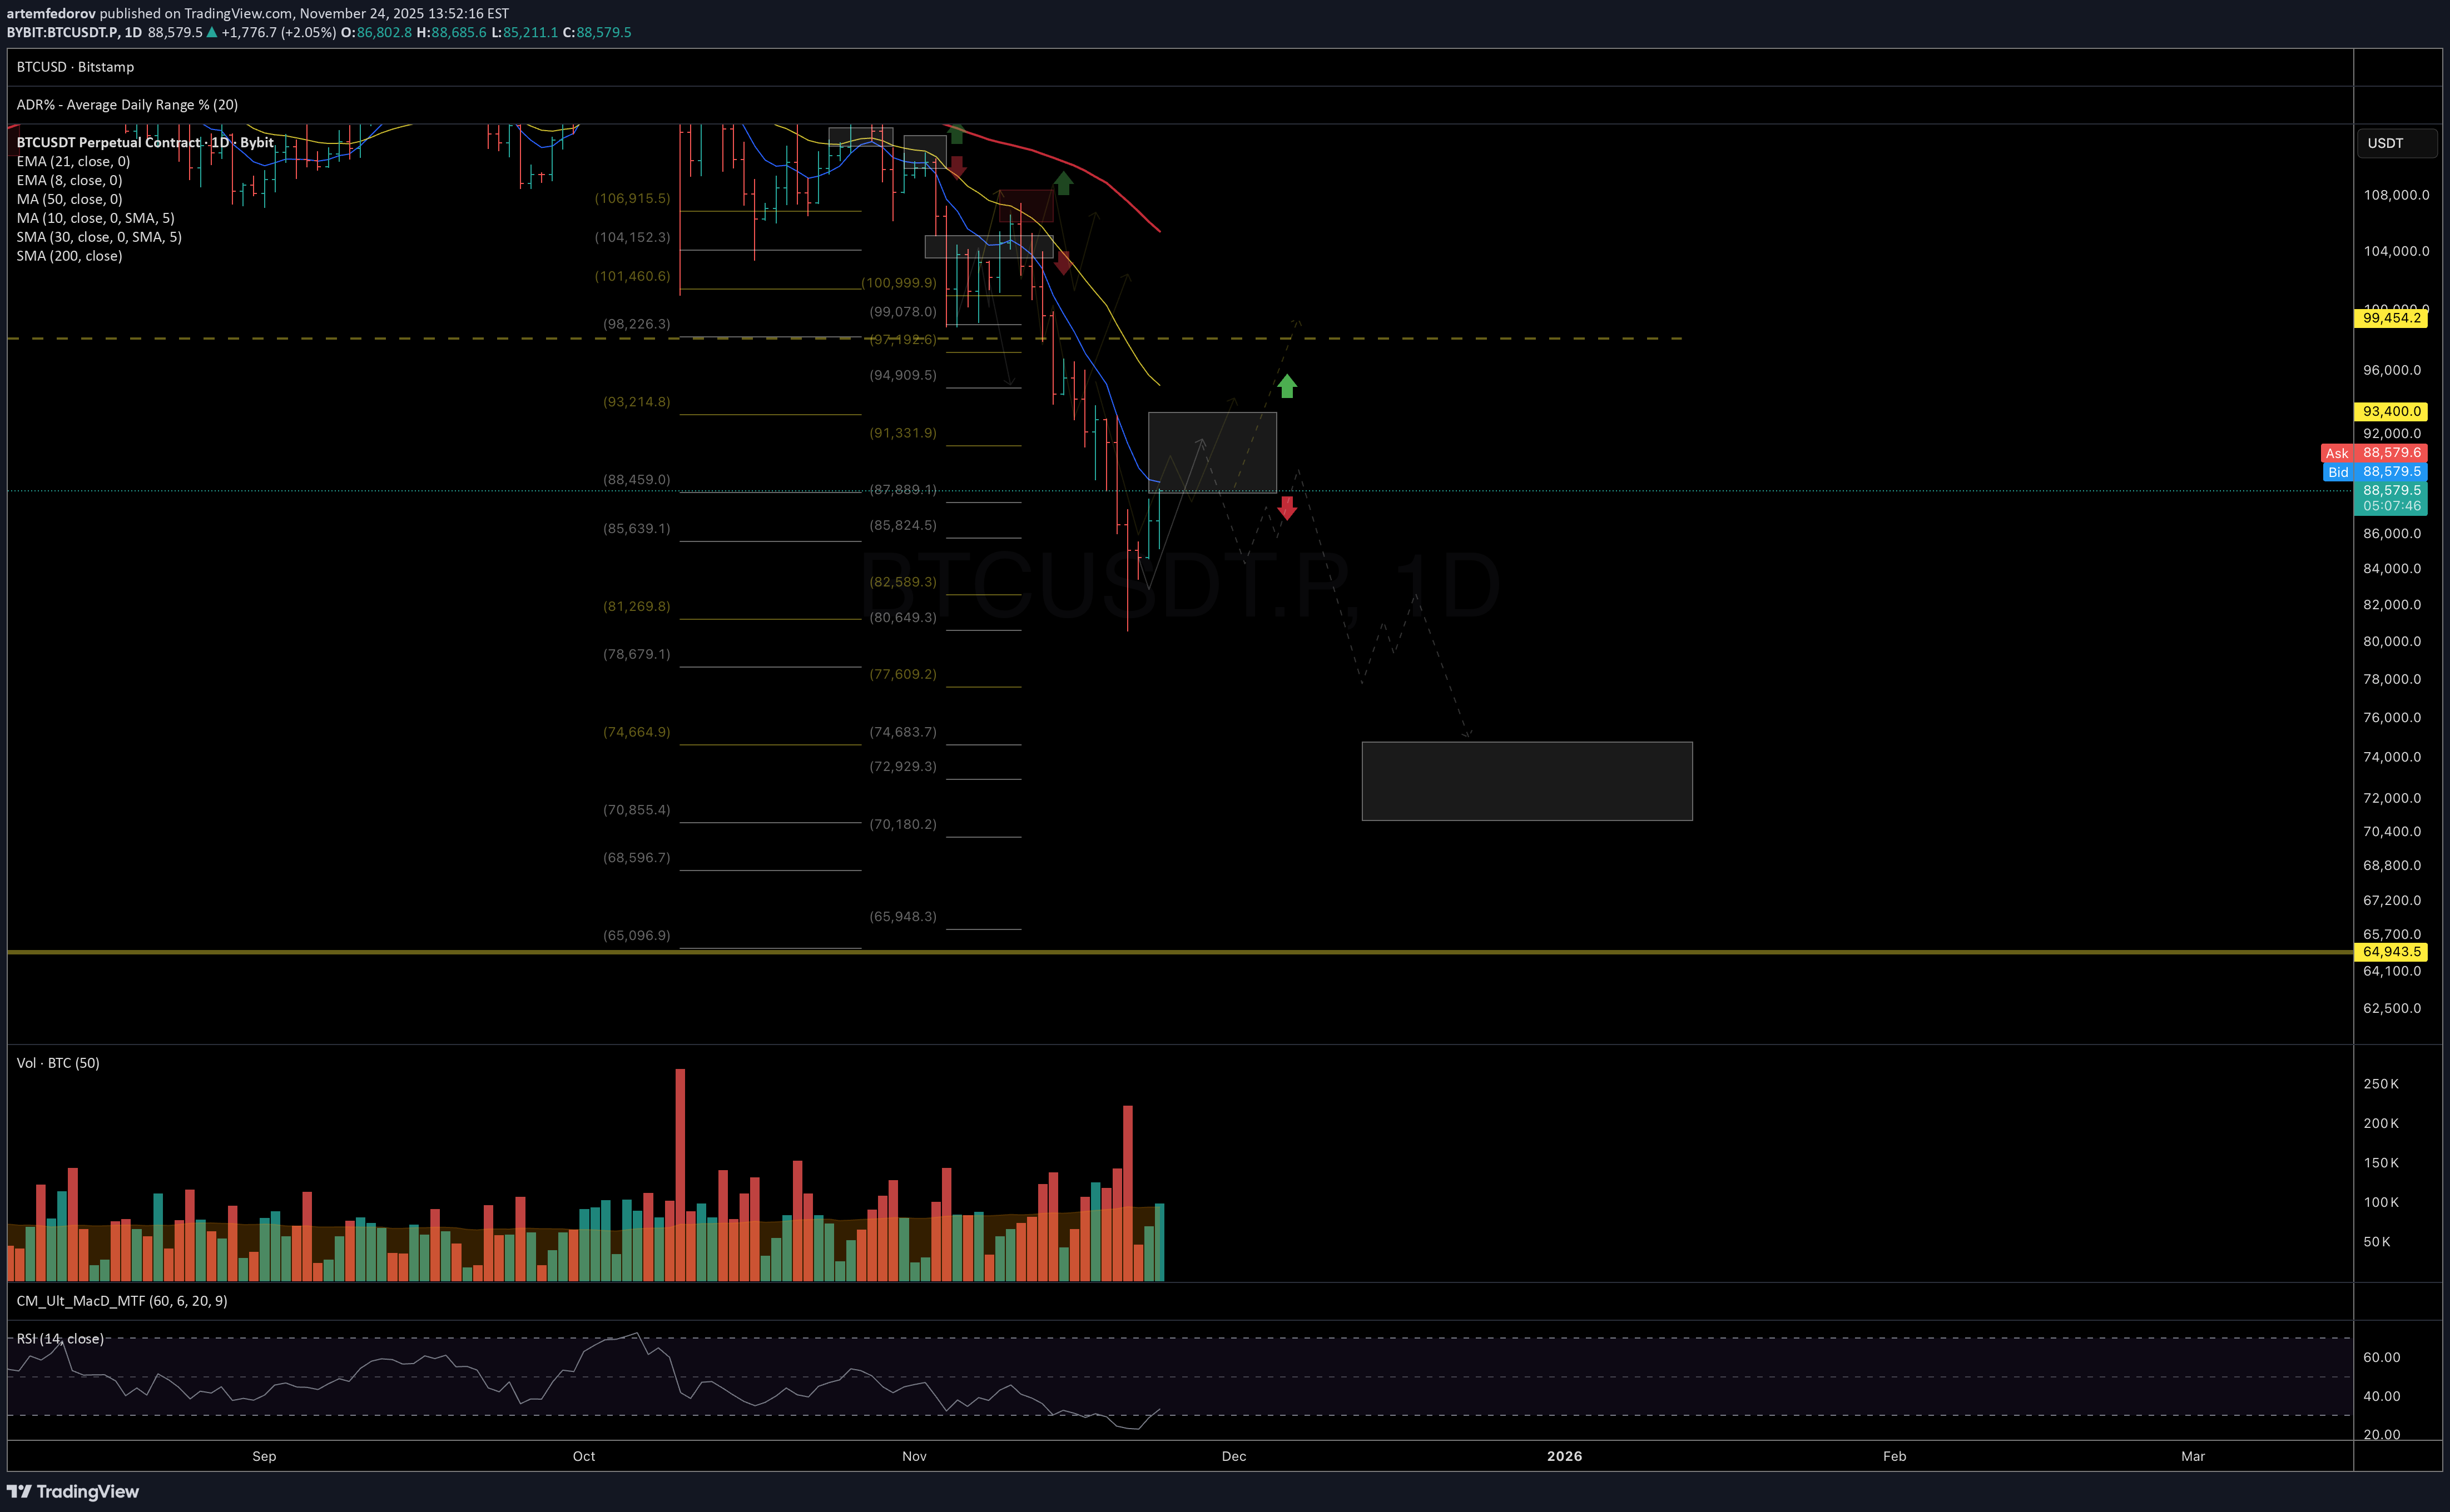
Bitcoin Bitcoin یغلق أسبوعه الثانی على التوالی تحت المتوسط المتحرک لمدة 50 أسبوعًا. طوال دورة النمو هذه (منذ أدنى مستویاتها فی عام 2022)، وجد السعر دائمًا الدعم عند هذه المستویات. الرسم البیانی: تاریخیًا، کان الإغلاق تحت هذا المستوى لأکثر من أسبوعین متتالیین یمثل دائمًا بدایة دورة التصحیح الکلی أو "شتاء العملات المشفرة"، بدلاً من مجرد السحب القیاسی. الرسم البیانی: * على مؤشر القوة النسبیة: مؤشر القوة النسبیة الأسبوعی، الذی حافظ على اتجاه صعودی طوال عام 2024 وکل عام 2025 تقریبًا، کسر بشکل حاسم خط الدعم طویل المدى فی نوفمبر. وطالما ظل مؤشر القوة النسبیة فوق خط الدعم، فإن هیکل الدورة الصعودیة یظل ثابتًا عادةً؛ ومع ذلک، غالبًا ما یتزامن الانهیار الهبوطی مع اکتمال مرحلة النمو. الرسم البیانی: إن الجمع بین هاتین الإشارتین - الانخفاض إلى ما دون متوسط 50 أسبوعًا وانهیار دعم مؤشر القوة النسبیة - یزید بشکل حاد من احتمال دخول السوق بالفعل فی مرحلة التصحیح الکلی. ومن وجهة نظری فإن احتمالیة حدوث هذا السیناریو تزید حالیا عن 80%. * عند 200W MA: فی جمیع الدورات السابقة، تشکل القاع Bitcoin الأخیر على وجه التحدید حول المتوسط المتحرک 200W. حالیًا، یقع هذا بالقرب من 66 ألفًا، وبحلول منتصف عام 2026، یمکن أن یرتفع إلى نطاق 73-75 ألفًا، وهو ما یناسب سیناریو انخفاض إضافی بنسبة 15-20٪ عن المستویات الحالیة. التوقعات لهذا الاسبوع : أرى إمکانیة حدوث موجة تصحیحیة أخرى طالما ظل السعر أقل من 93 ألفًا. فی الأیام/الأسبوع القادمة، من المنطقی أن نتوقع ارتدادًا (قید التنفیذ بالفعل) نحو منطقة المقاومة هذه؛ ومع ذلک، بدون الثبات المستمر فوق ذلک المستوى، تظل مخاطر حدوث انخفاض آخر نحو 75-70 ألفًا مرتفعة. الرسم البیانی: إذا اختبر السوق المنطقة 75-70 ألفًا، فقد یکون هناک قاع محلی form هناک، مما یؤدی إلى ارتفاع هبوطی قوی نحو المتوسط الهابط على مدى 200 یوم. هذا هو سیناریو "الارتداد cat المیت" مع احتمال صعودی بنسبة +40% تقریبًا، ویستخدم عادةً لإعادة تجمیع المراکز فی منتصف المرحلة الهبوطیة
artemfedorov
آخرین سقوط قیمت به کجا میرسد؟ فرصت خرید نهایی در محدوده کلیدی!
سیکون الهبوط الآخر إلى منطقة الدعم الکلی المثالیة عند 91-85/75 مثالیًا لإکمال الهیکل التصحیحی من أعلى مستویات یونیو. ومن شأن المستوى move الواثق فوق 120 أن یحول الاحتمالات نحو اکتمال التصحیح، مما یفتح الباب أمام ارتداد بدرجة أکبر على الأقل - أو ربما بدایة اتجاه صعودی جدید. الرسم البیانی: https://www.tradingview.com/x/4Ak56TvB/
artemfedorov
پیشبینی سقوط ارز دیجیتال MNT: منتظر کاهش بیشتر زیر سطح مقاومتی ۱.۵۱ باشید!
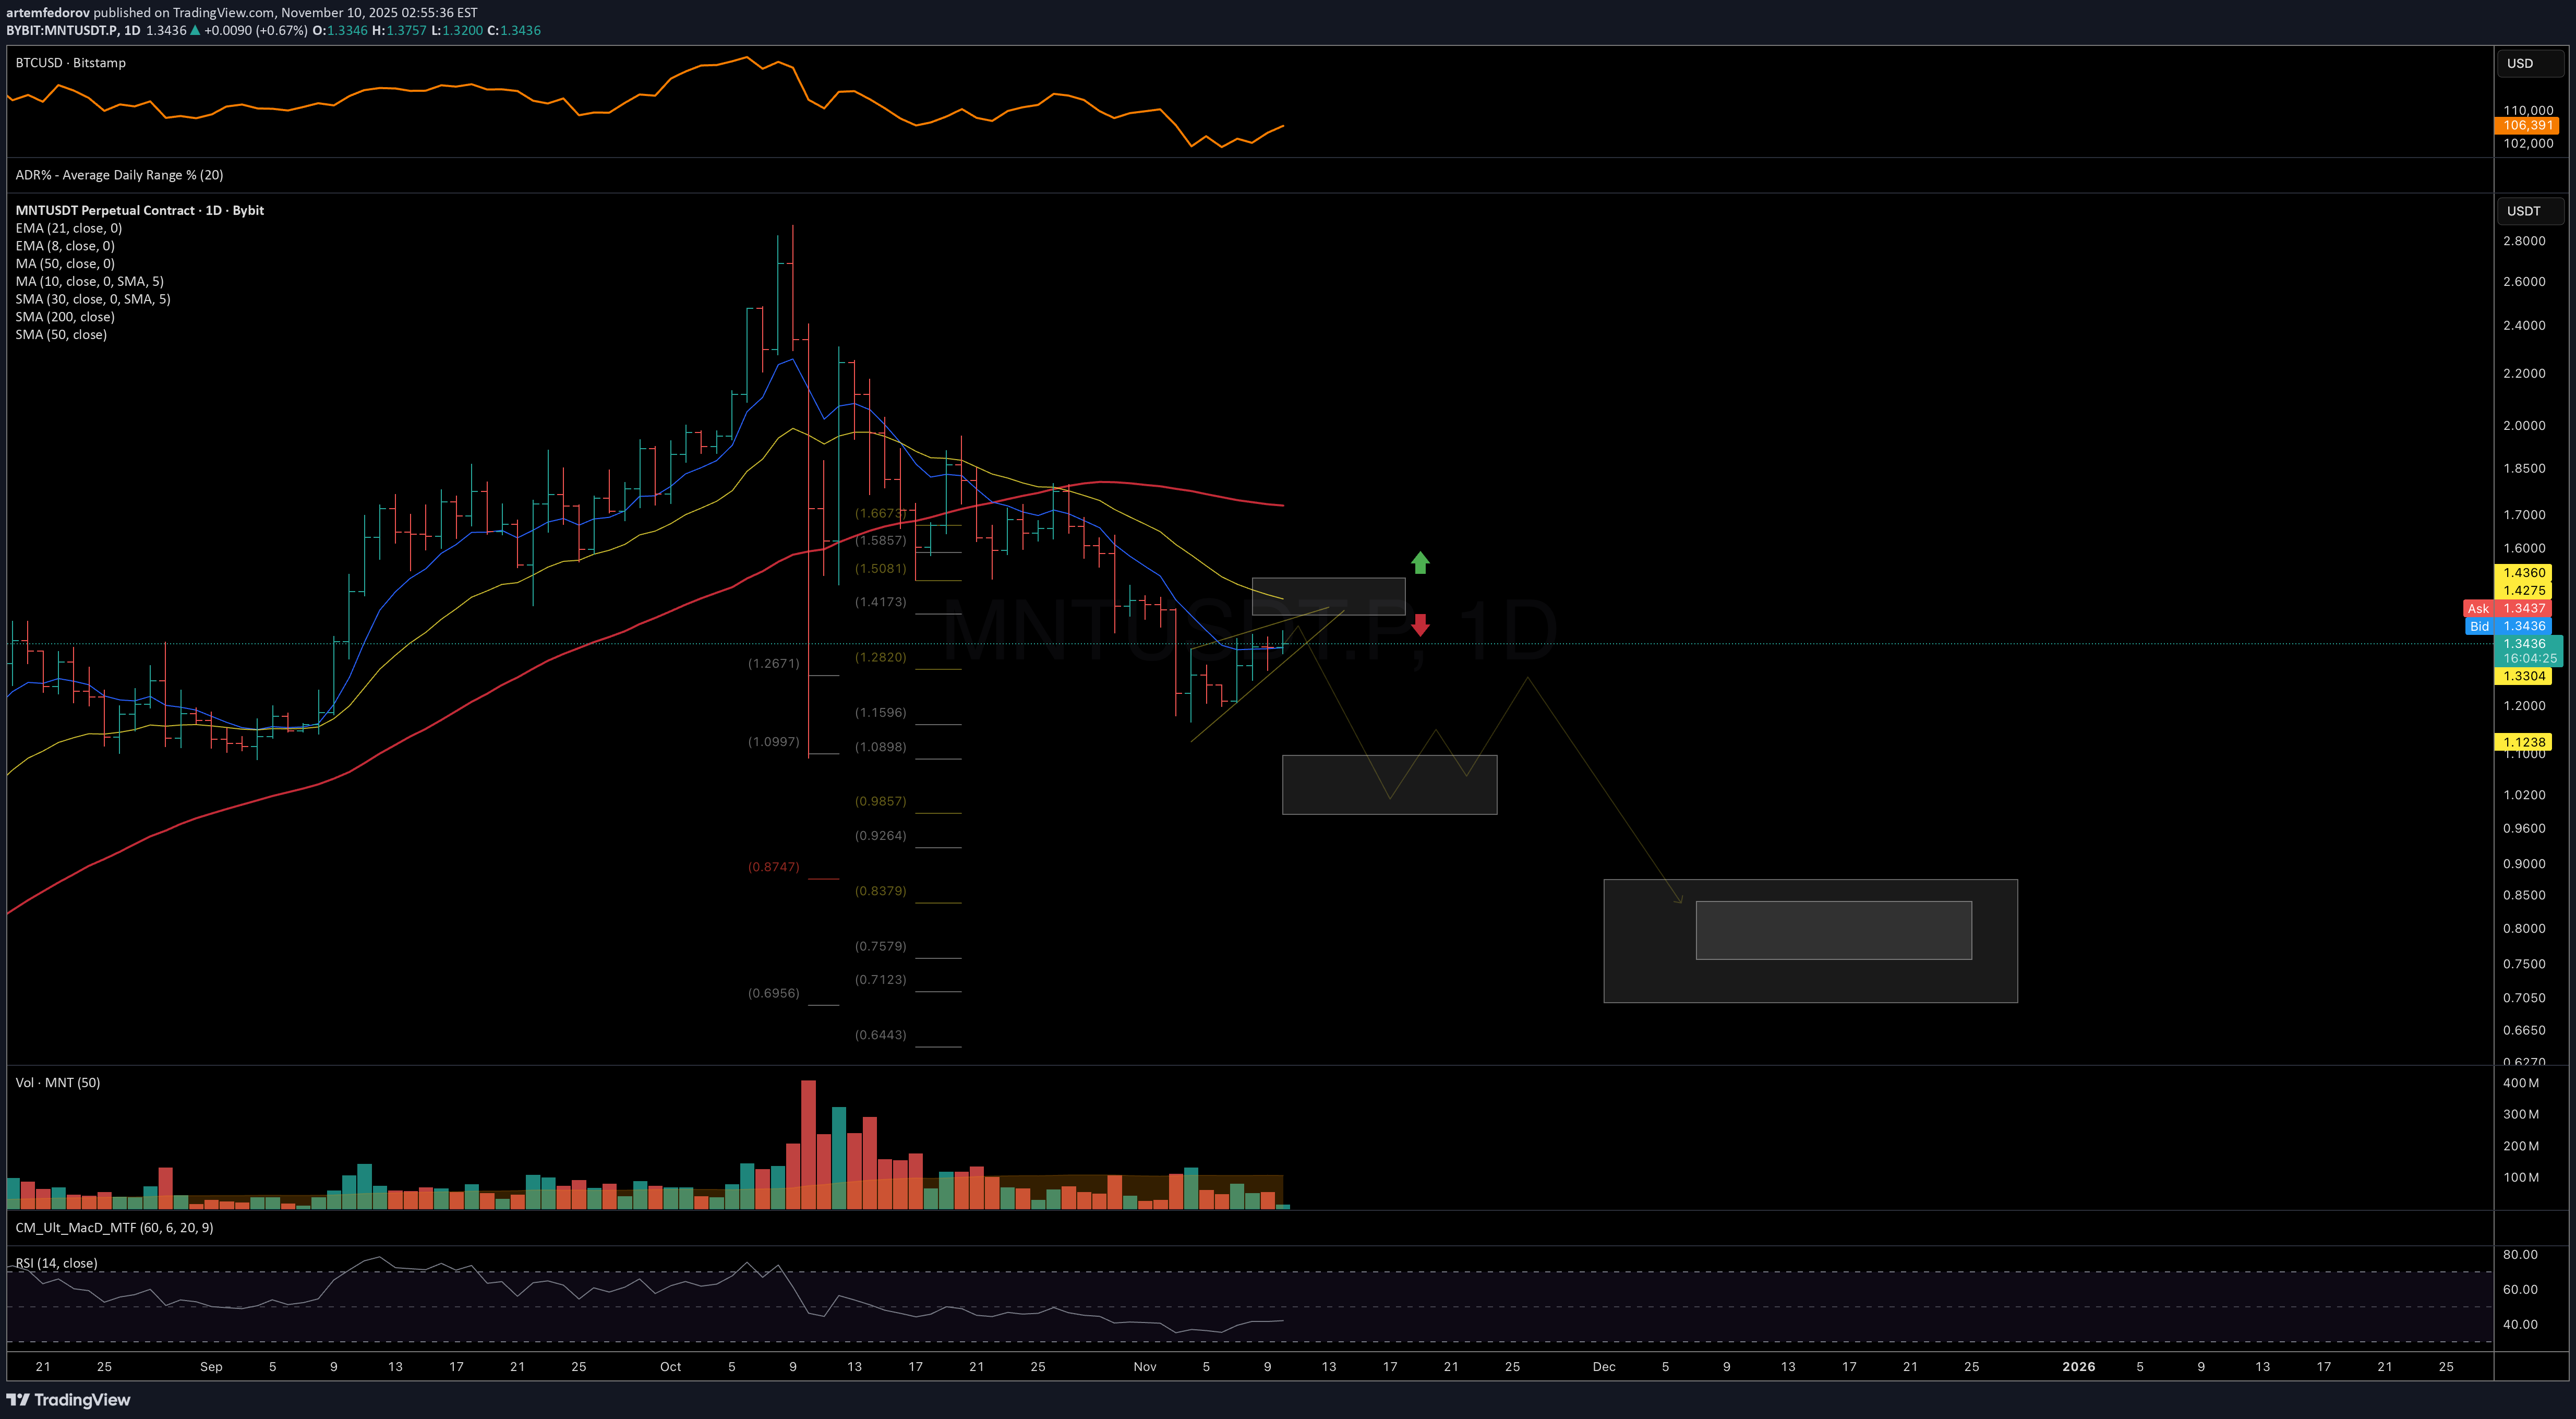
نراقب المزید من استمرار الهبوط طالما بقی السعر دون مستوى المقاومة 1.51. الرسم البیانی: https://www.tradingview.com/x/1RDfUR9a/
artemfedorov
هشدار حیاتی برای بیت کوین (ZECUSDT): آیا قله جدید در راه است؟
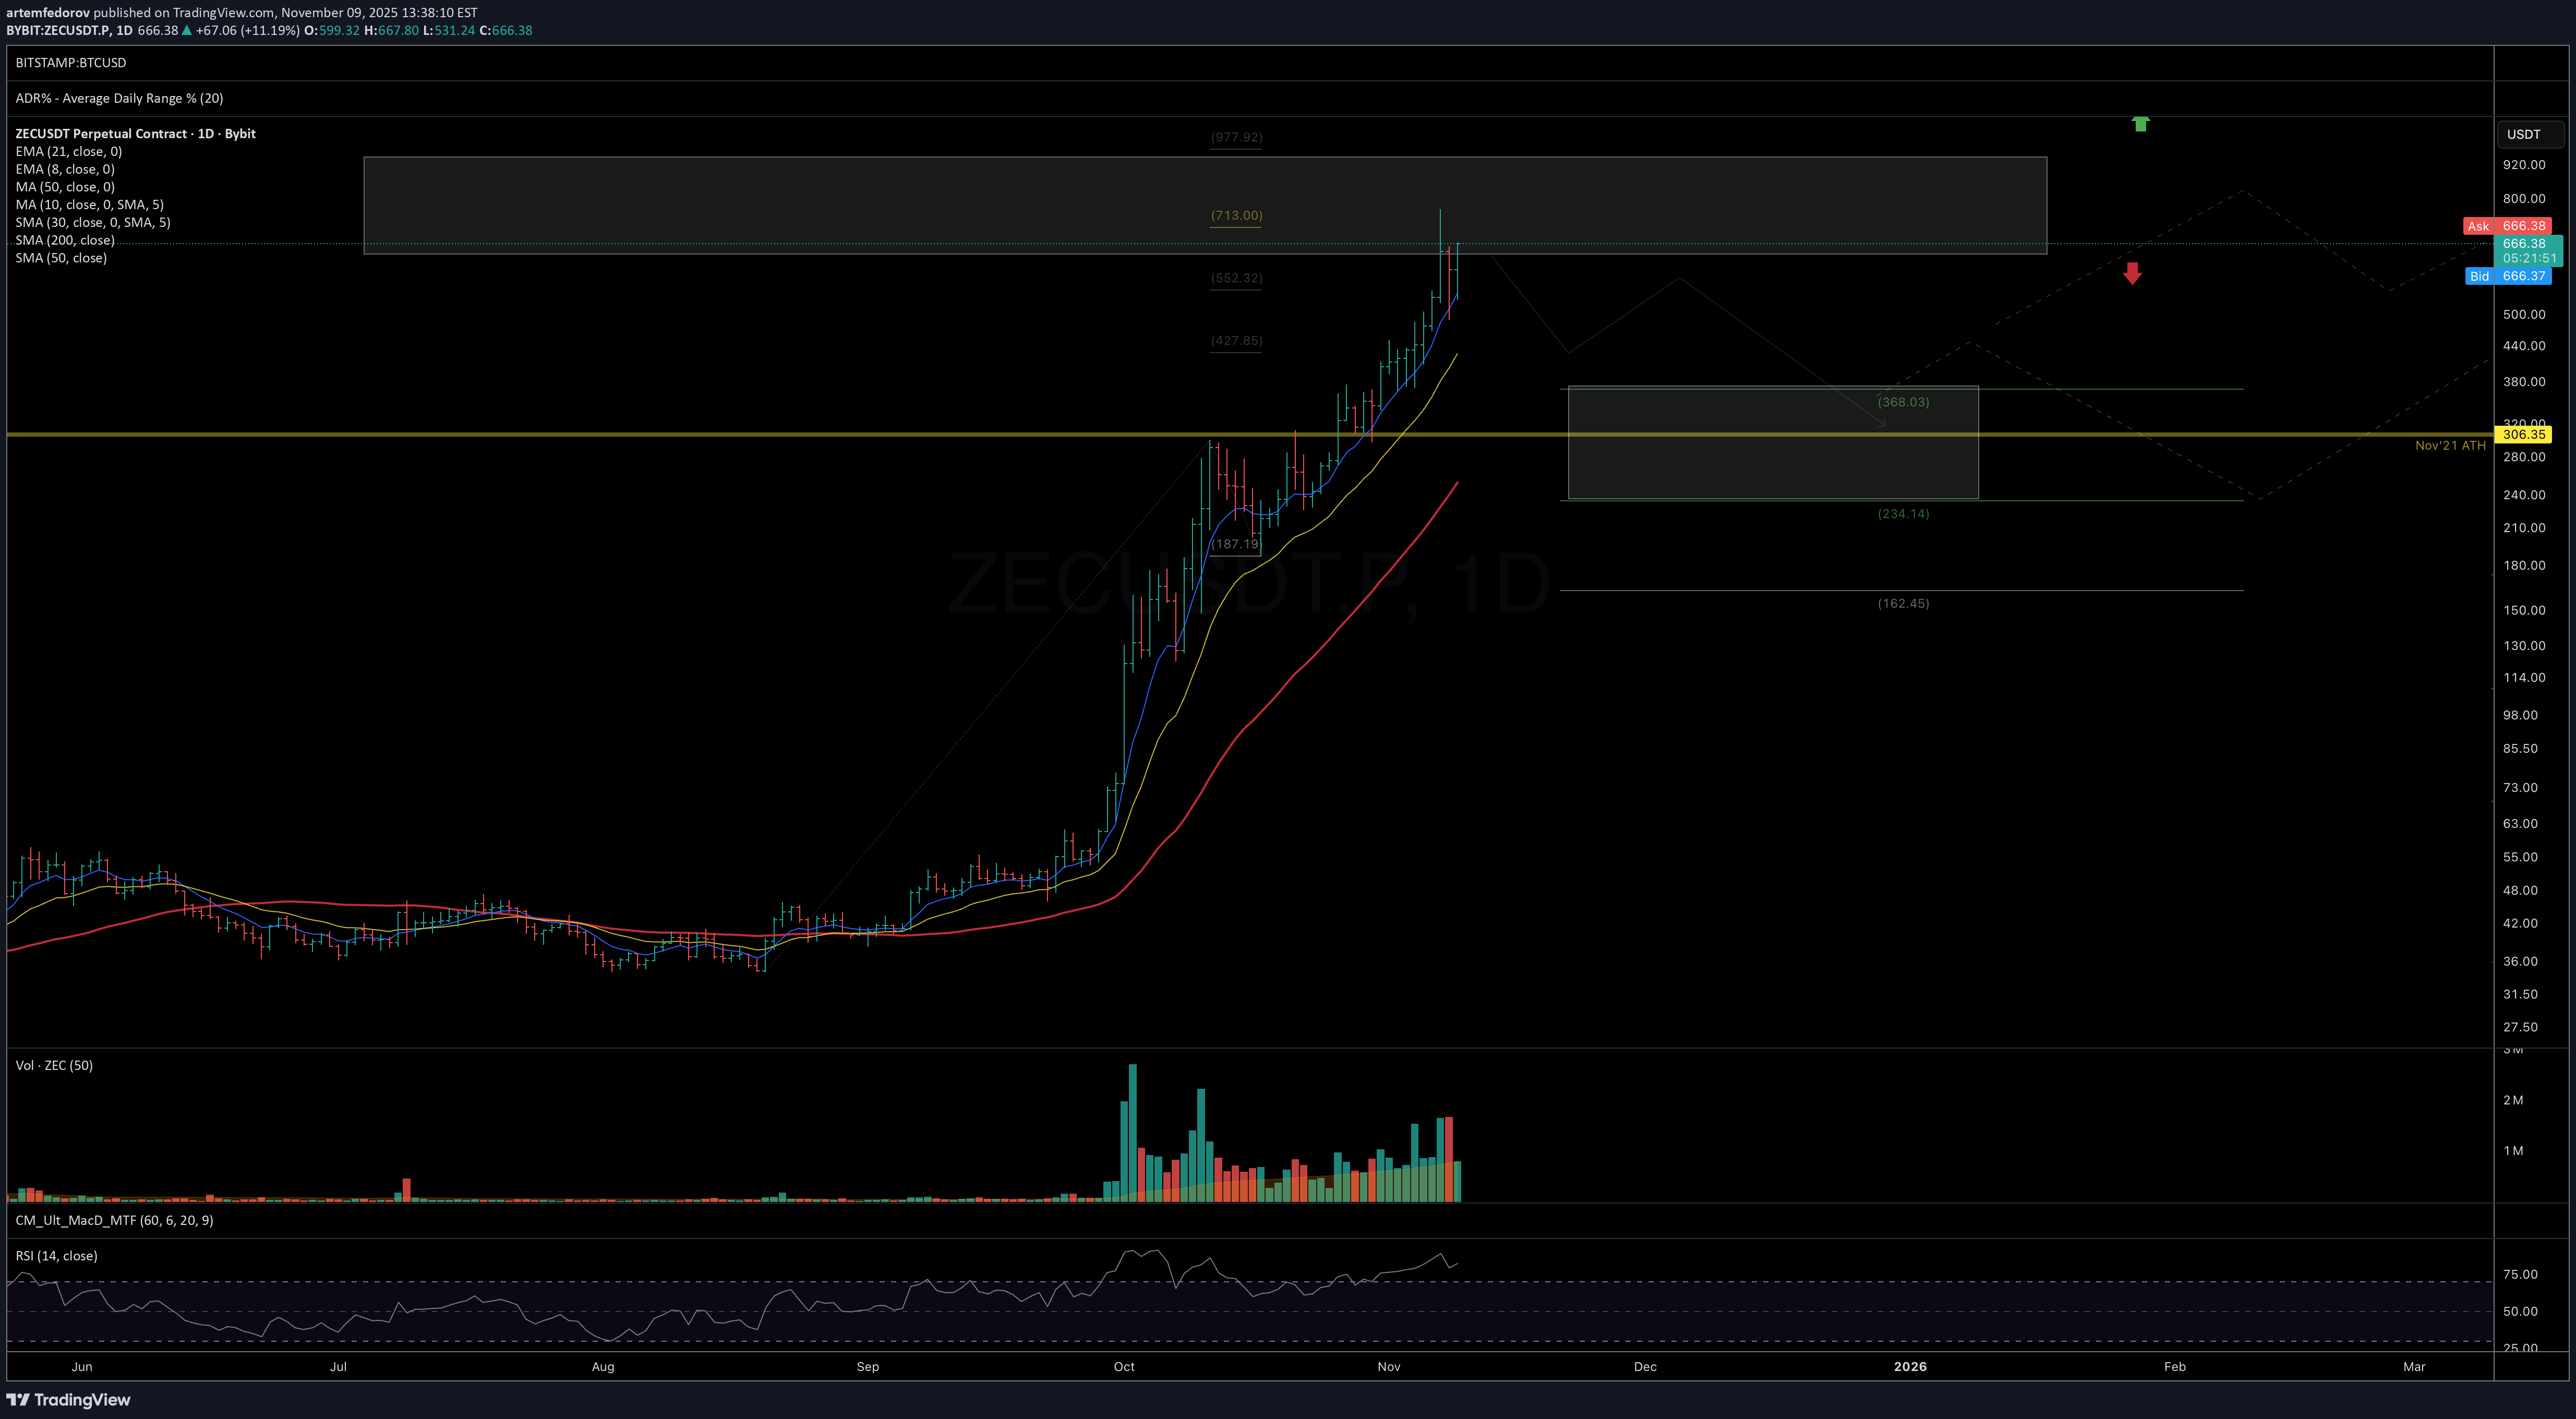
وصل السعر إلى منطقة الامتداد الرئیسیة عند 635-930، حیث من المحتمل على الأقل تشکیل قمة متوسطة المدى. وطالما أن السعر یستقر داخل هذه المنطقة أو تحتها، فأنا أراقب علامات القمة وبدایة التراجع نحو منطقة الدعم 370-235. الرسم البیانی: https://www.tradingview.com/x/m2J07kcf/ عرض الماکرو: https://www.tradingview.com/x/RnWZvi6Y/
artemfedorov
احتمال سقوط دوباره تسلا: آیا کف قیمتی 430 دلاری محقق میشود؟
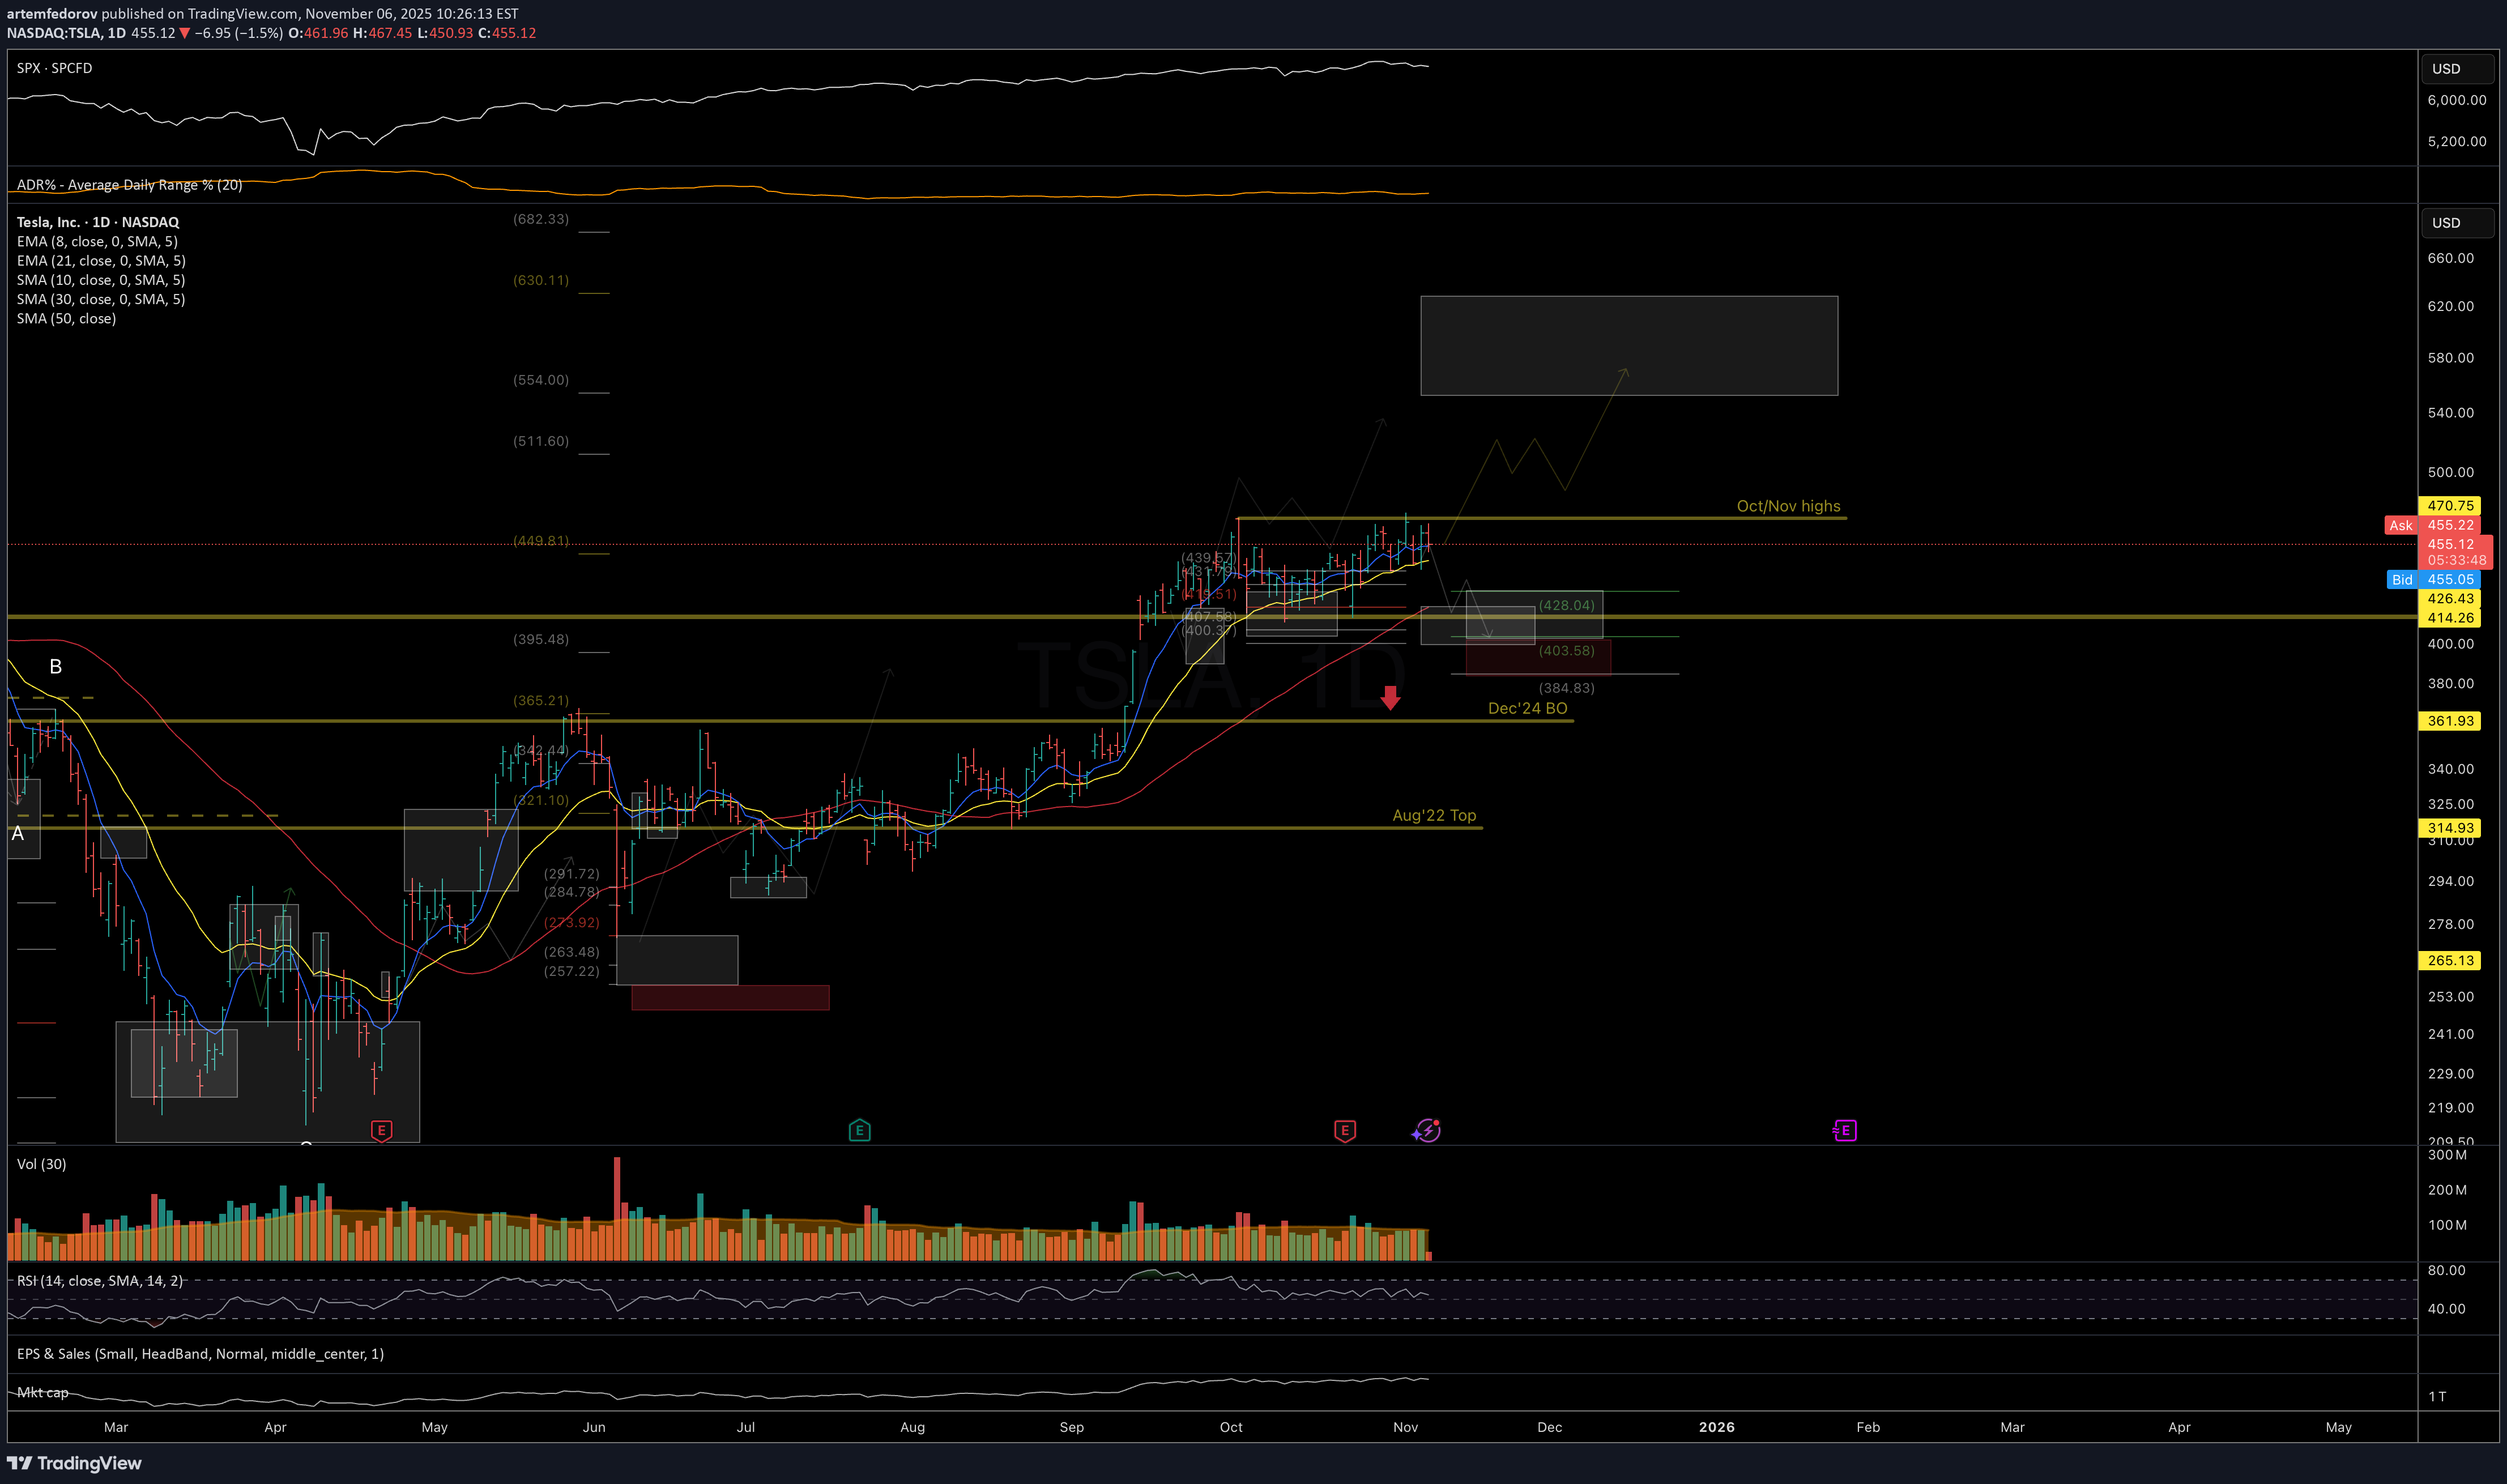
TSLA نترقب تحرکًا آخر نحو منطقة الدعم متوسطة المدى 430-400 لاستکمال الهیکل التصحیحی، إذا ظل السعر غیر قادر على الاختراق فوق أعلى مستویاته فی أکتوبر/نوفمبر. الرسم البیانی: https://www.tradingview.com/x/fxaKSBiD/ وبدلاً من ذلک، إذا تمکن السعر من الاختراق والبقاء فوق مستوى المقاومة الأخیر، فإن الاحتمالات تفضل الاستمرار إلى منطقة المقاومة 555-630. الرسم البیانی: https://www.tradingview.com/x/F6LjJxbc/ سابقا: • فیما یتعلق بإمکانیة الوصول إلى القاع الکلی (6 یونیو): https://tradingview.com/symbols/NASDAQ-TSLA/minds/?mind=yJtQ-ZNkTZ2JLpW24O8Rgw • بخصوص الدعم (19 سبتمبر): https://www.tradingview.com/x/LgEJk7t4/ • حول دعم منتصف المدة (7 أکتوبر):
artemfedorov
ریزش سنگین در راه است؟ تحلیل فنی سطح کلیدی برای سکه (COIN)
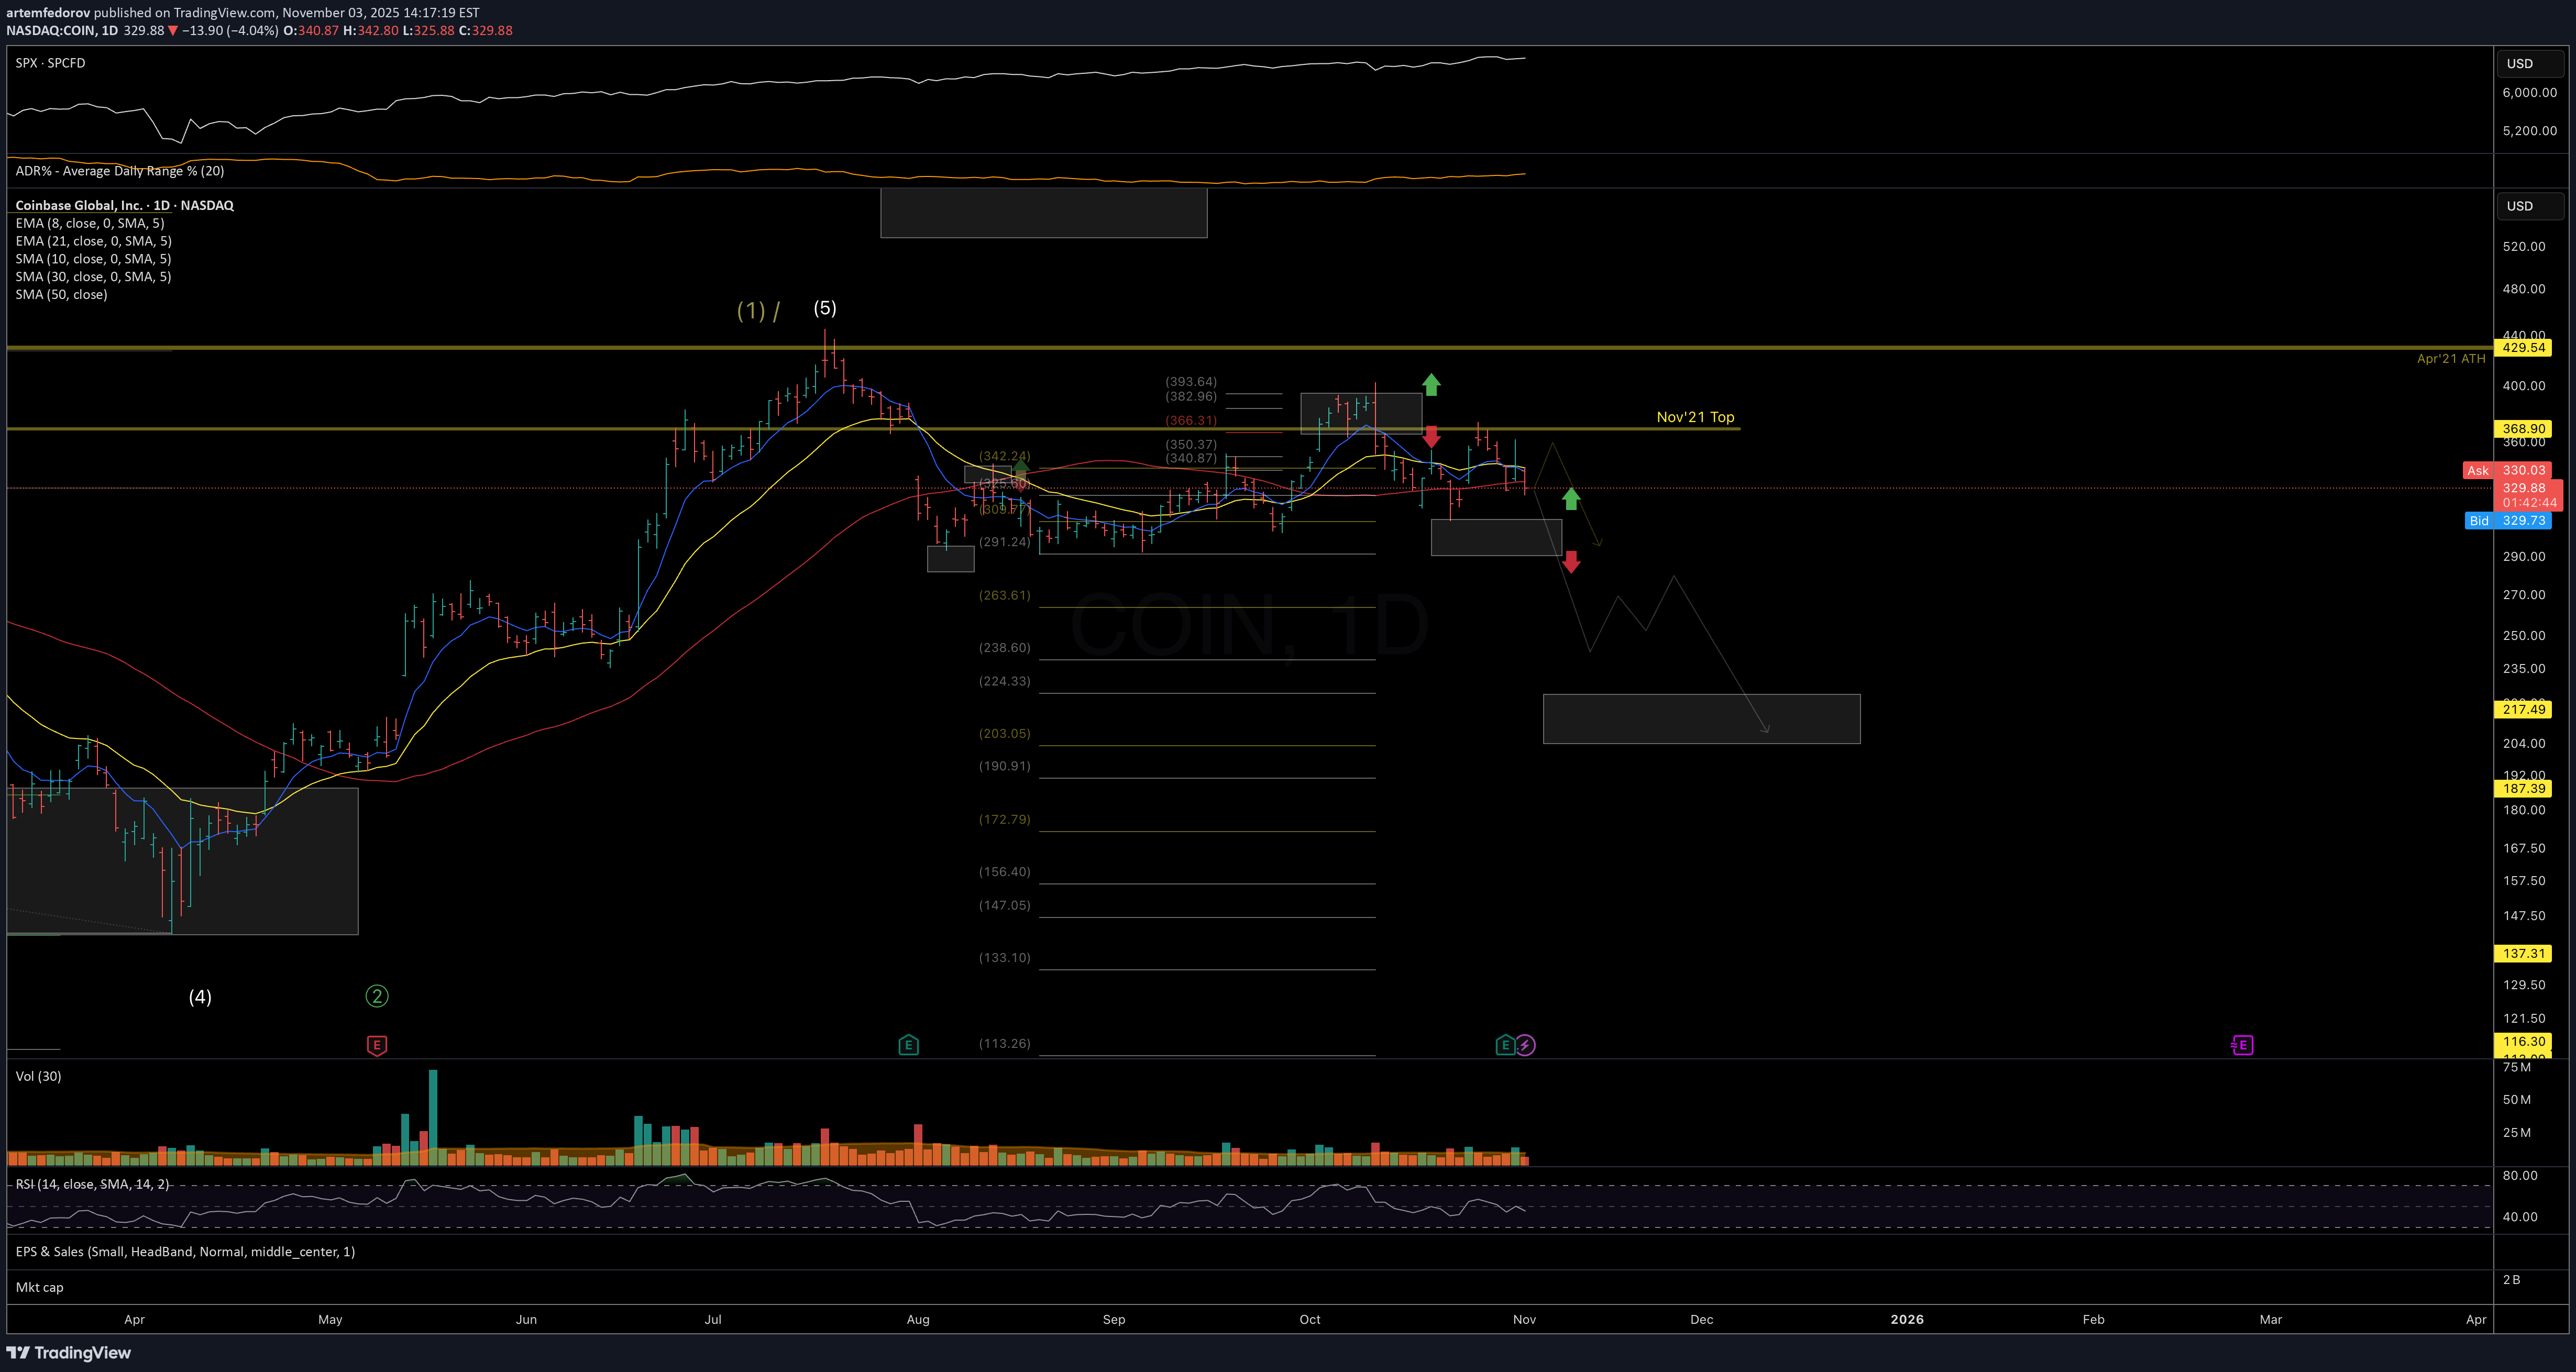
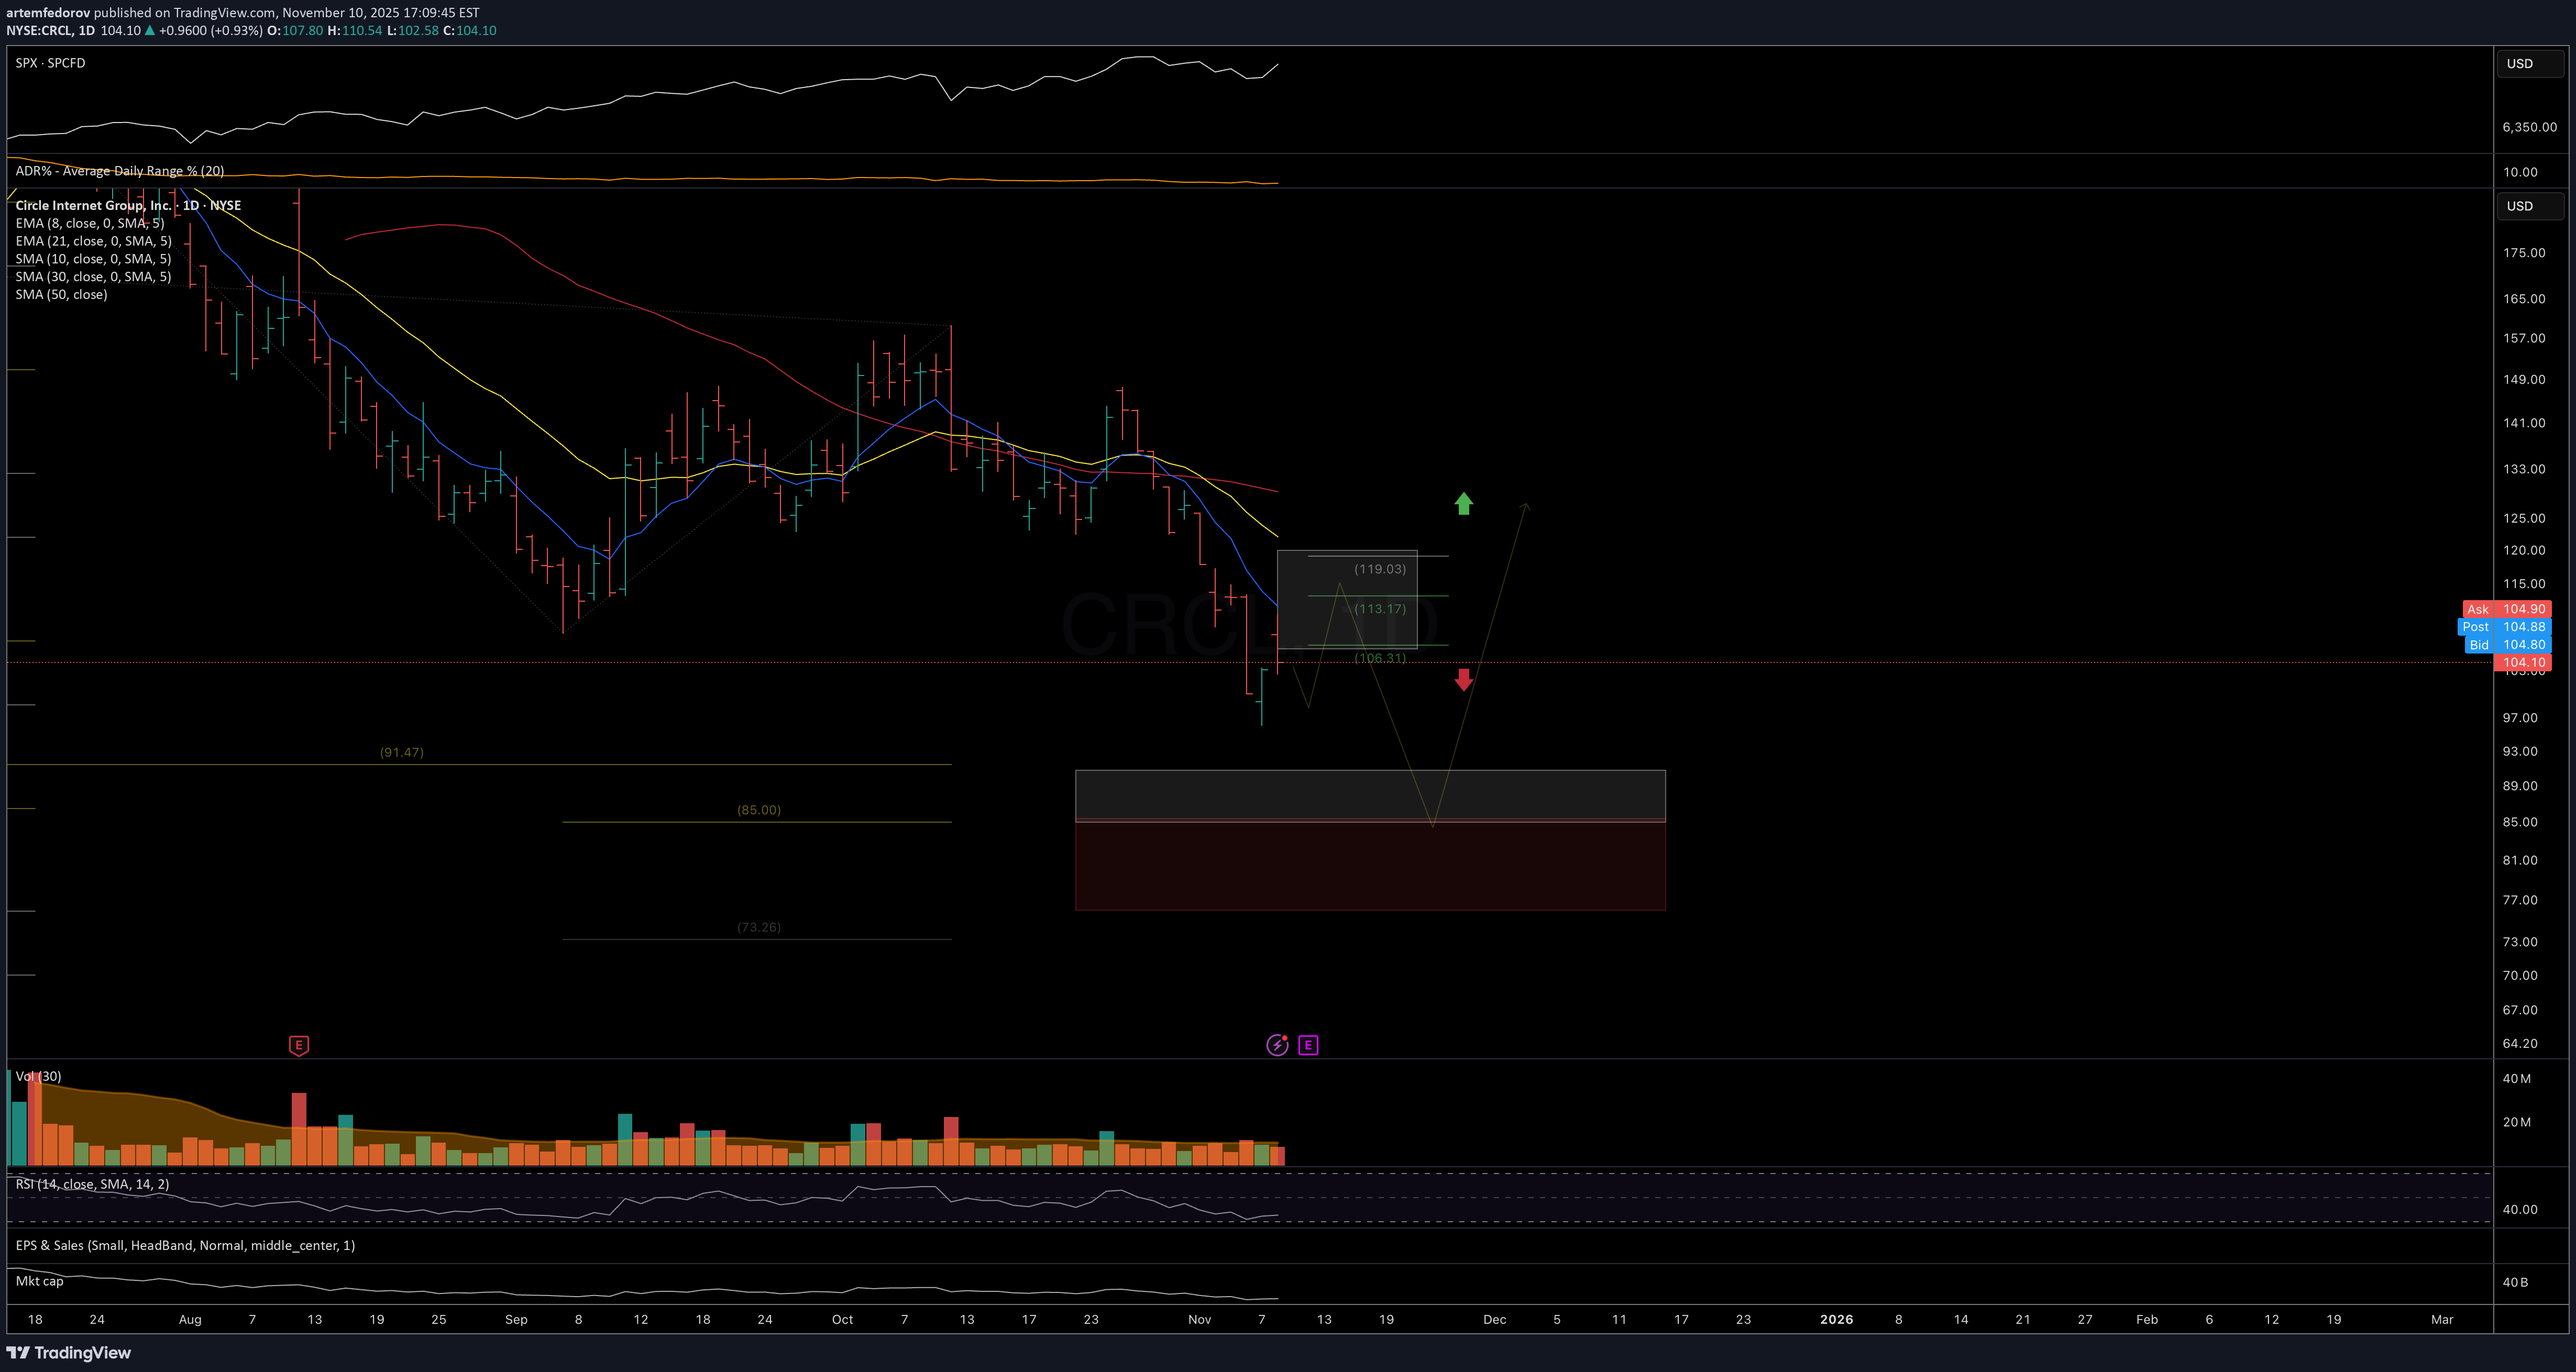
وطالما ظل السعر أدنى من أعلى مستوى سجله فی أکتوبر، فإننی أراقب احتمالات هیکلیة تشیر إلى المزید من الاتجاه الهبوطی فی الأسابیع المقبلة، مع مستویات الدعم الرئیسیة التالیة عند 240-200. إذا تمکن السعر من البدء فی الإغلاق فوق 375، فسأحتاج إلى إعادة تقییم هیکل الاتجاه المقترح من أجل اتجاه صعودی أکثر فوریة لا أرى بوضوح فی هذه المرحلة. الرسم البیانی: https://www.tradingview.com/x/WPz1u3Lx/
artemfedorov
تحلیل هفتگی ارز دیجیتال: آیا بیت کوین به اوج جدید میرسد؟ (سطوح کلیدی)
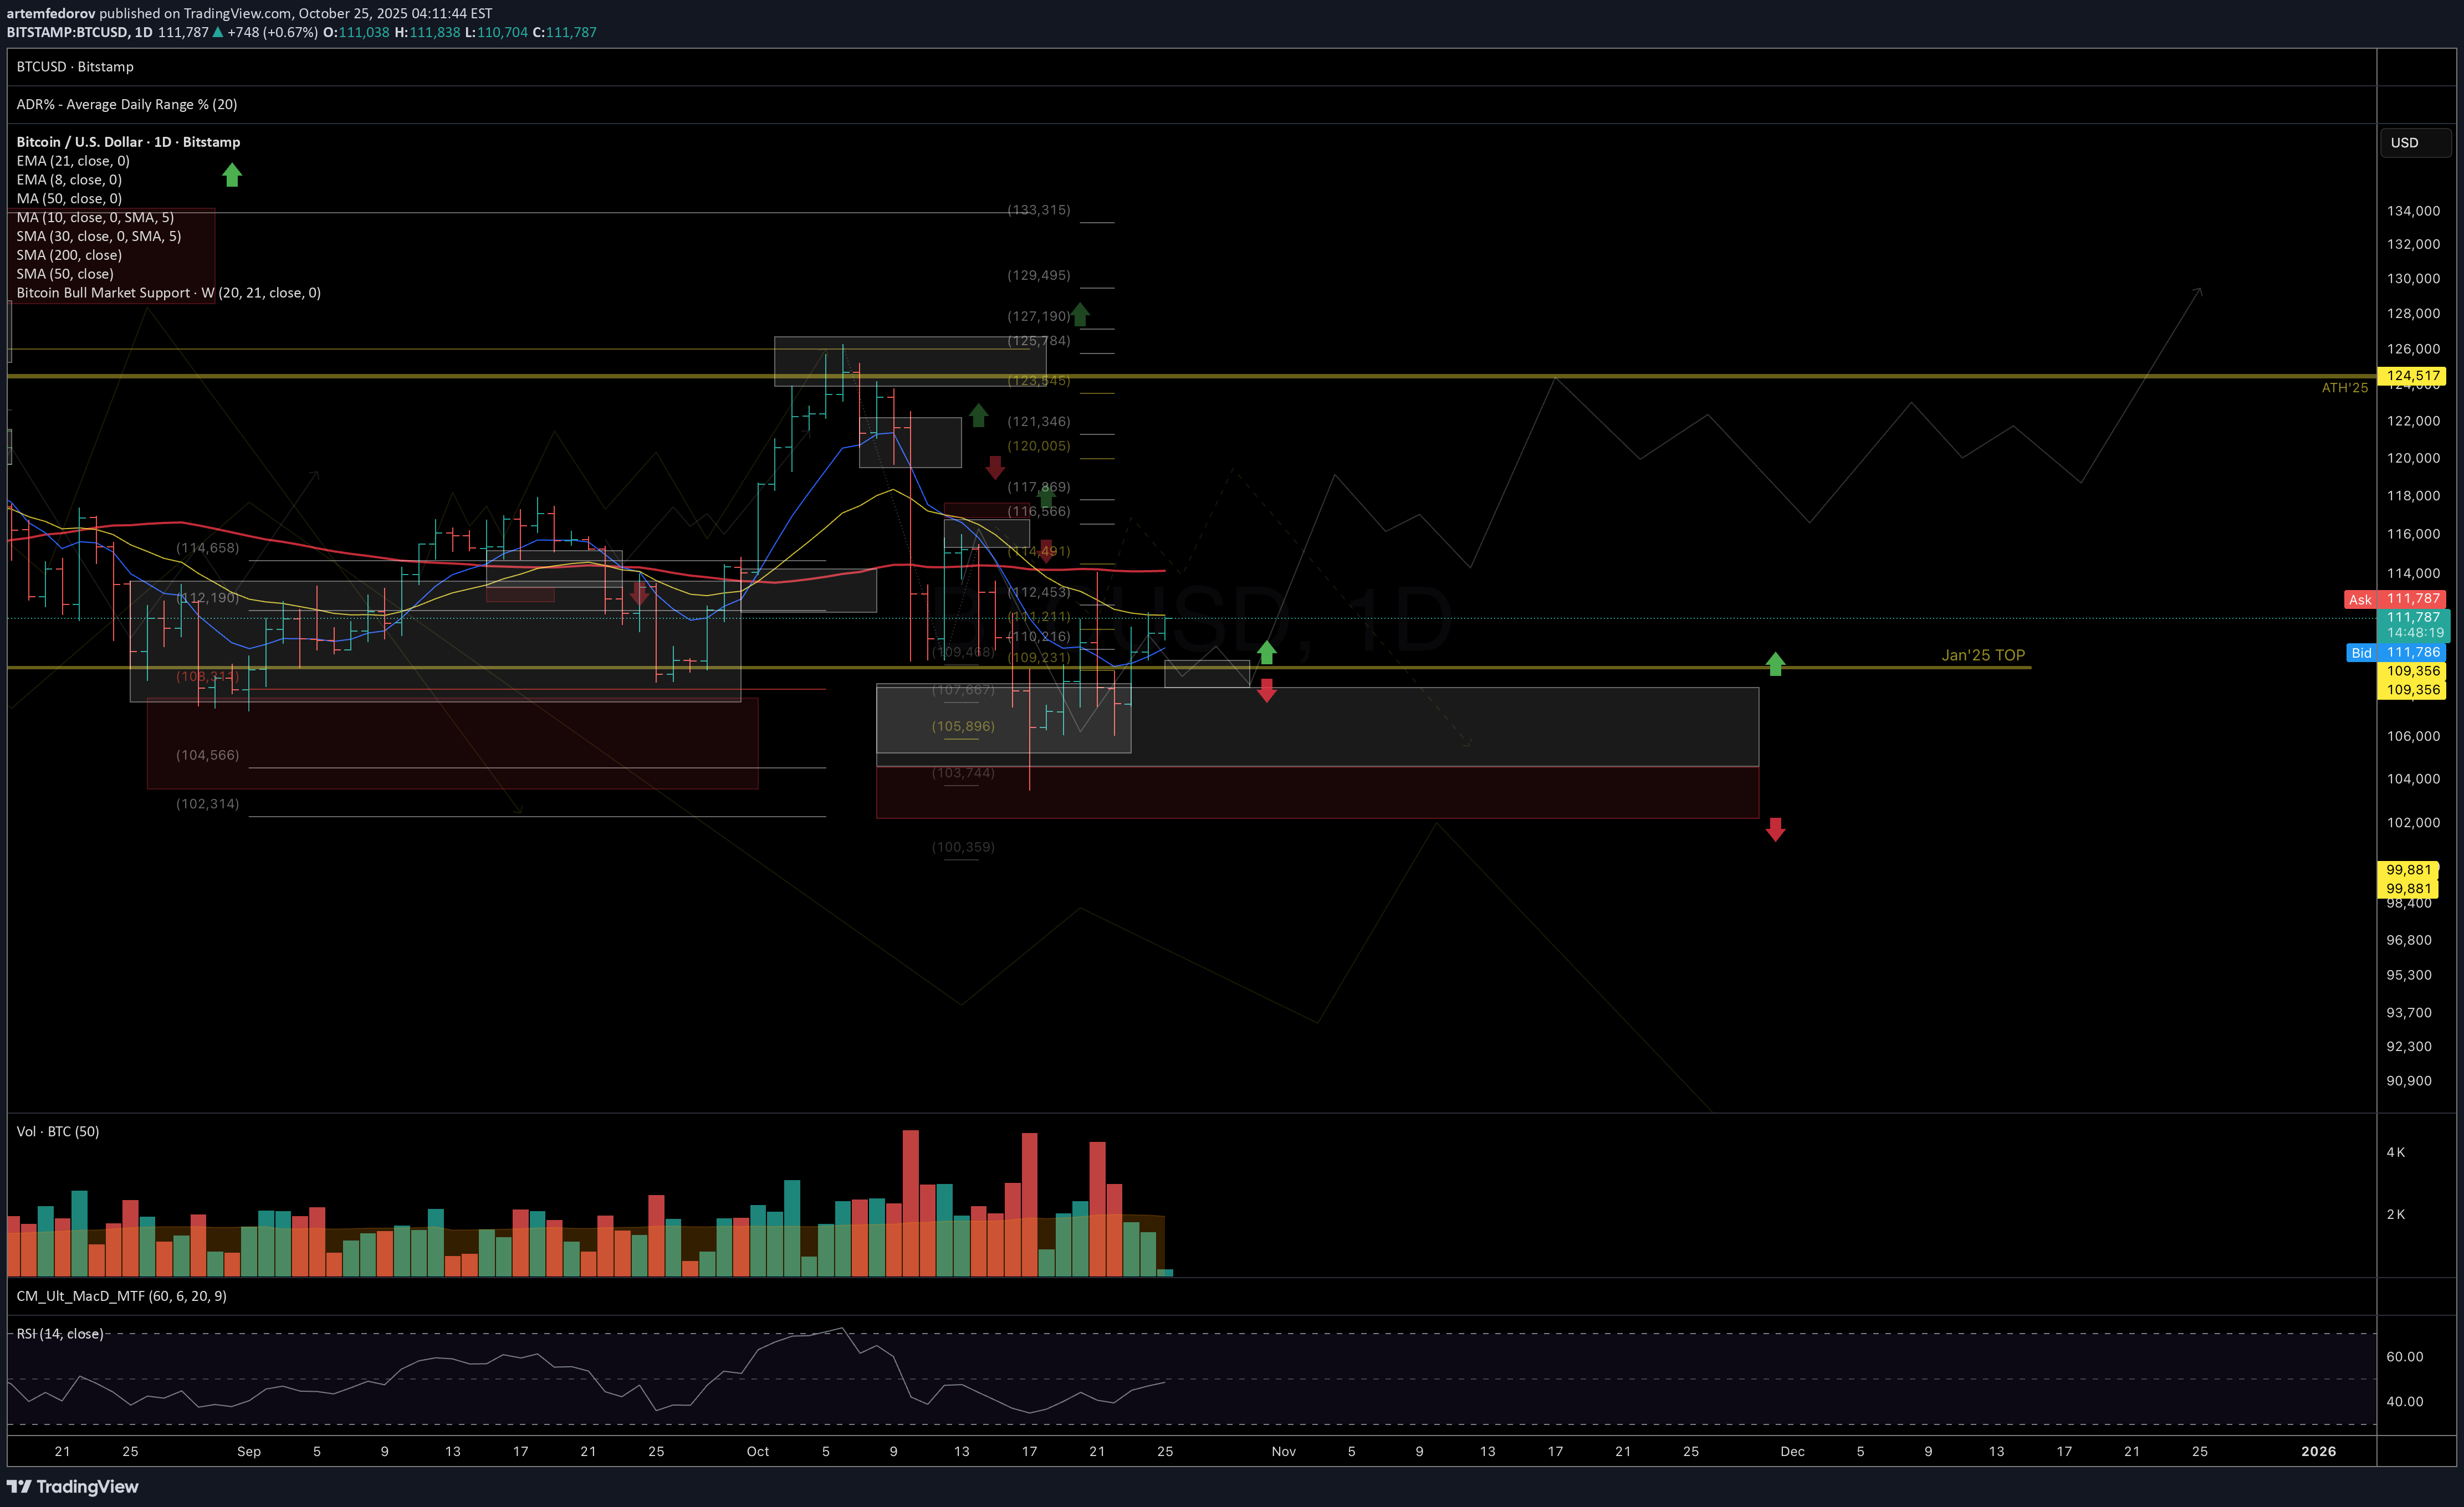
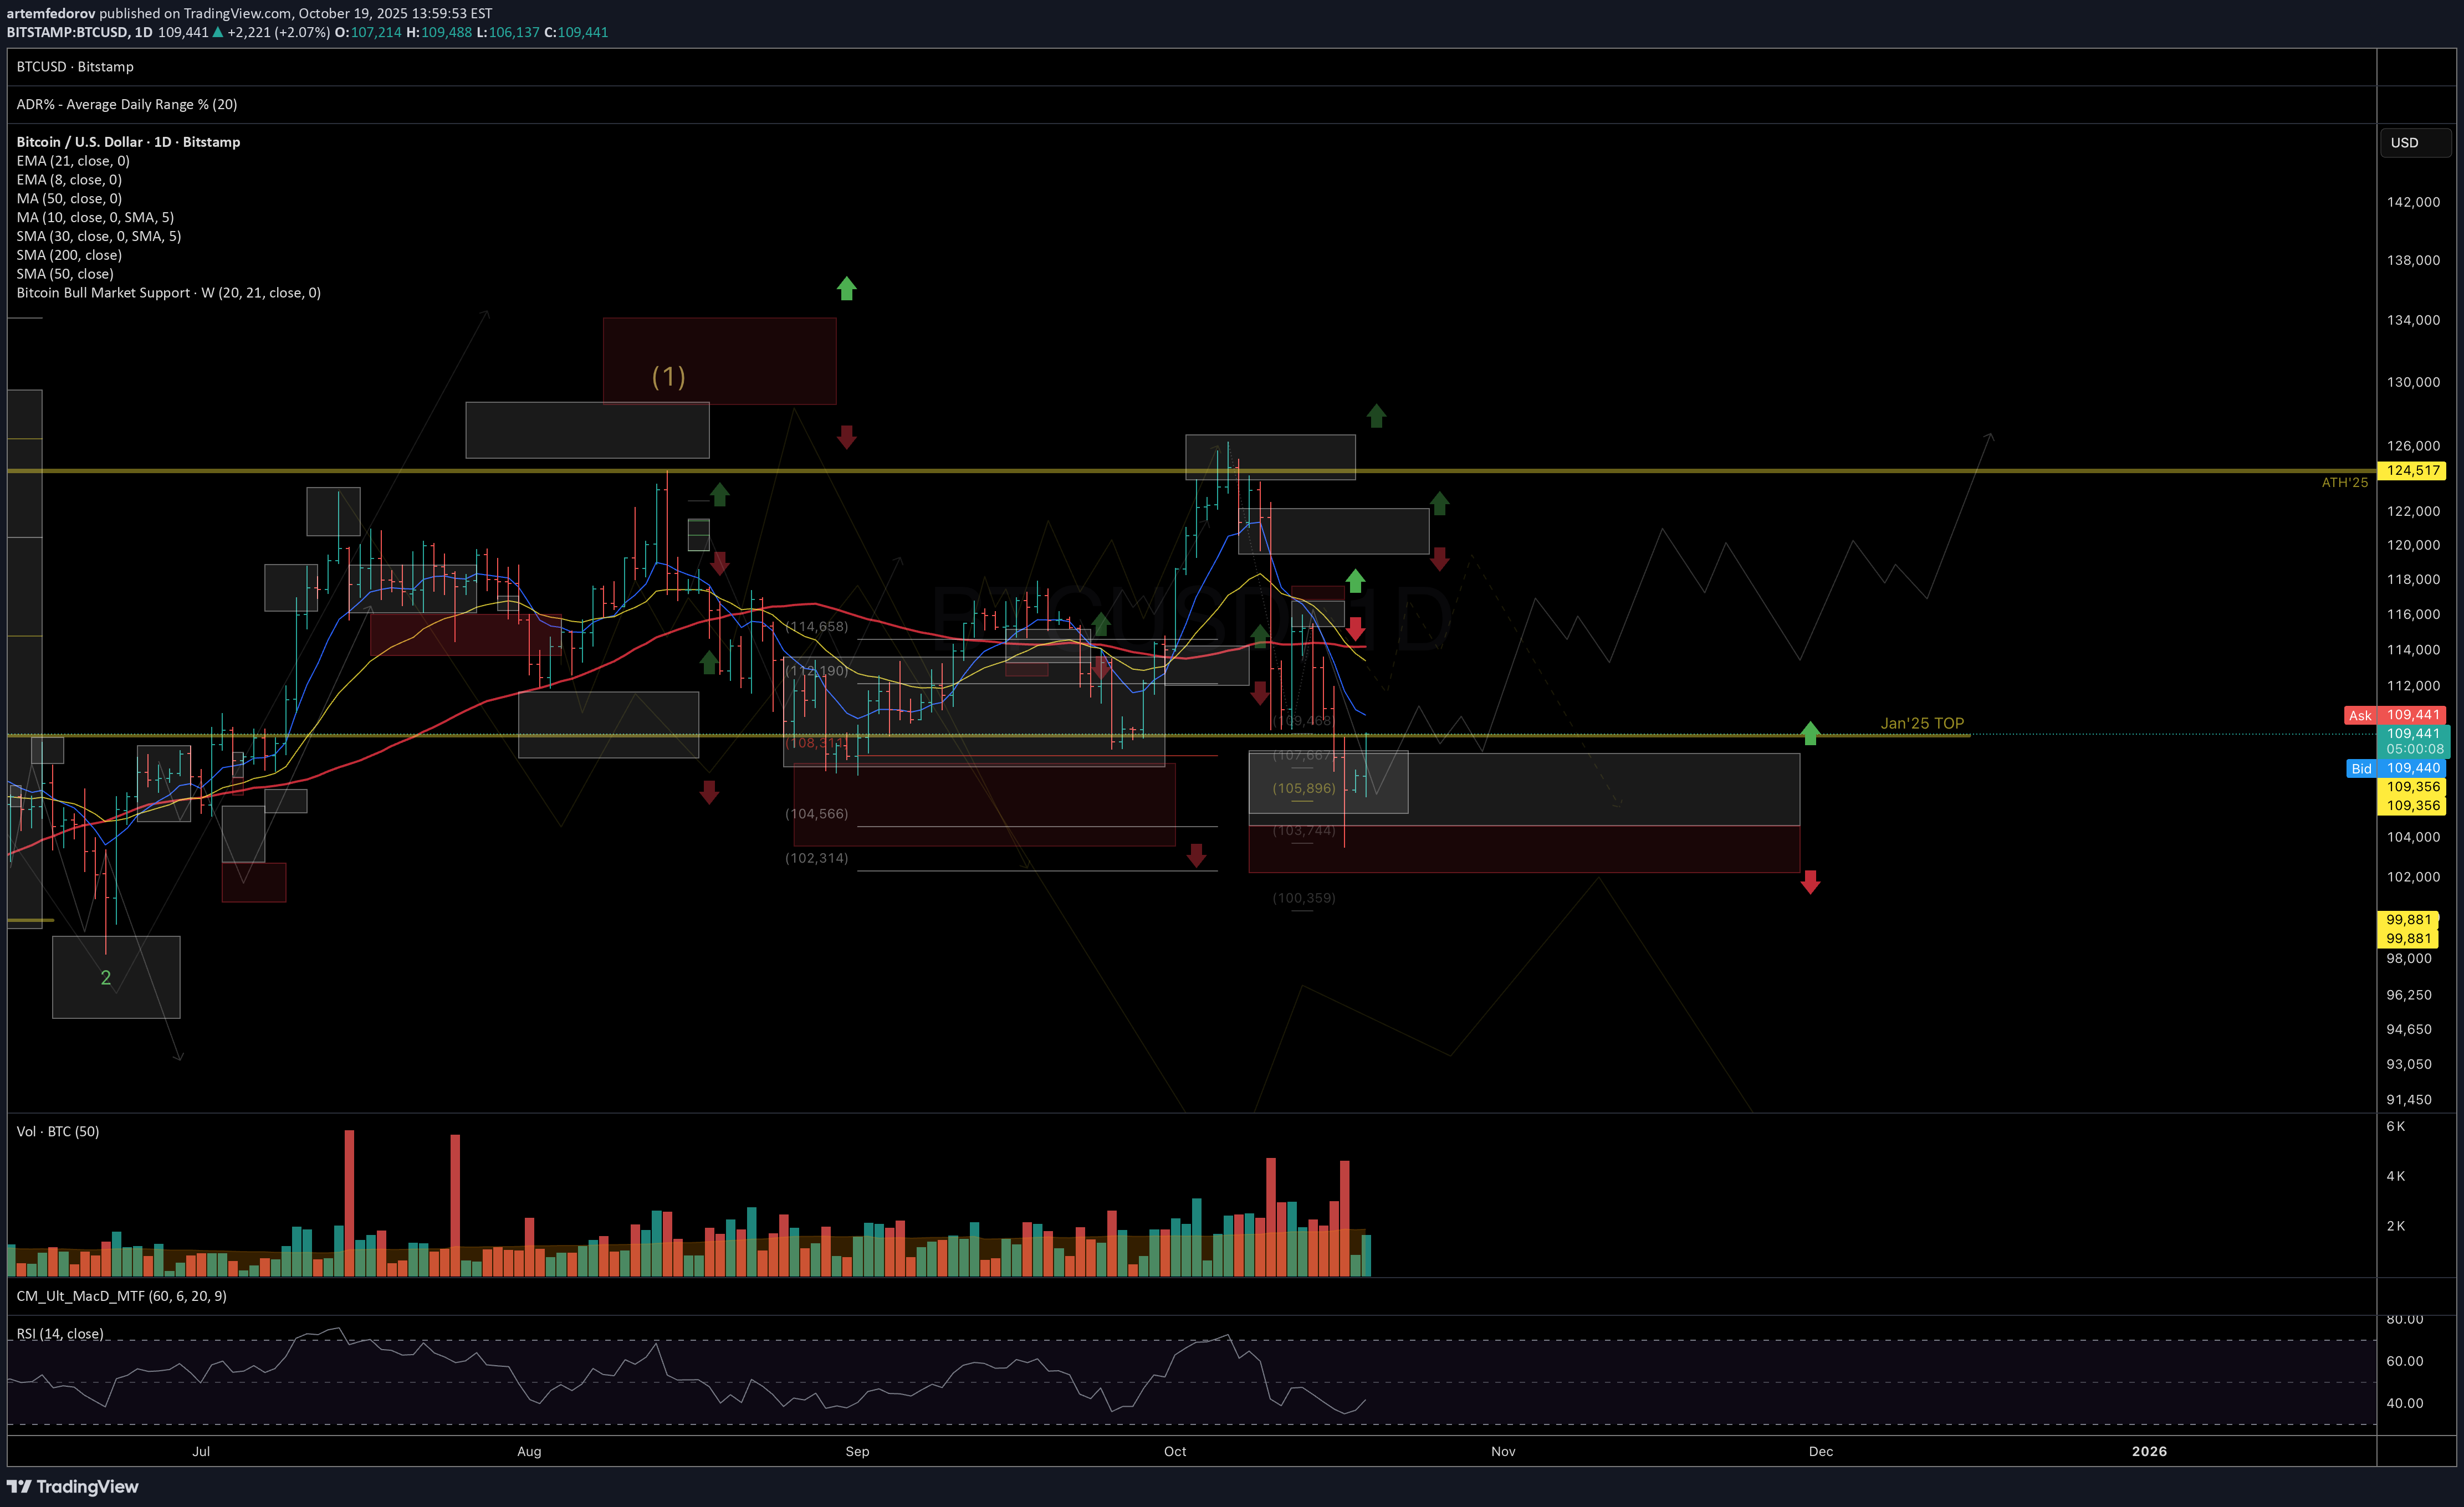
یستمر السعر فی الارتفاع move تماشیًا مع السیناریو الرئیسی الذی تمت مناقشته فی التحدیثات الأسبوعیة السابقة. وطالما ظل الهیکل بناءًا وظل الدعم الرئیسی ثابتًا، فسوف أتمسک بالفرضیة الأساسیة المتمثلة فی اکتمال التصحیح والانتعاش التدریجی للاتجاه کفرضیة أساسیة. فی هذا السیناریو، خلال الأسابیع المقبلة وحتى الربع الرابع، أود أن أرى: • ثبات السعر فوق مستوى الدعم المحلی ; • الاختراق والثبات فوق المتوسط المتحرک الأسی لـ 21 یومًا والمتوسط المتحرک لـ 50 یومًا. • تدریجیًا movement نحو مناطق المقاومة التالیة — 115-120 ألفًا، یلیها 123 ألفًا+. المستویات الرئیسیة: • الدعم المحلی: 109-107 ألف • المقاومة المحلیة: 114 – 116 ألف، ثم 120 – 123.5 ألف • منطقة دعم الماکرو: 102 کیلو بایت قد یؤدی الانهیار تحت الدعم المحلی إلى إعادة اختبار آخر للحد الأدنى لمنطقة الدعم الکلی. إذا حدث الإغلاق الأسبوعی تحت 102 ألف، فسیزید ذلک بشکل ملحوظ من احتمال انتهاء دورة الاتجاه الصعودی الحالیة طویلة المدى وبدء مرحلة التصحیح الکلی. الإطار الزمنی الیومی: أسبوعی: شکرًا لک على اهتمامک - أتمنى للجمیع عطلة نهایة أسبوع هادئة وبدایة مثمرة للأسبوع الجدید!
artemfedorov
گوگل (GOOGL) در آستانه مقاومت حیاتی: مراقب فروشندگان باشید!
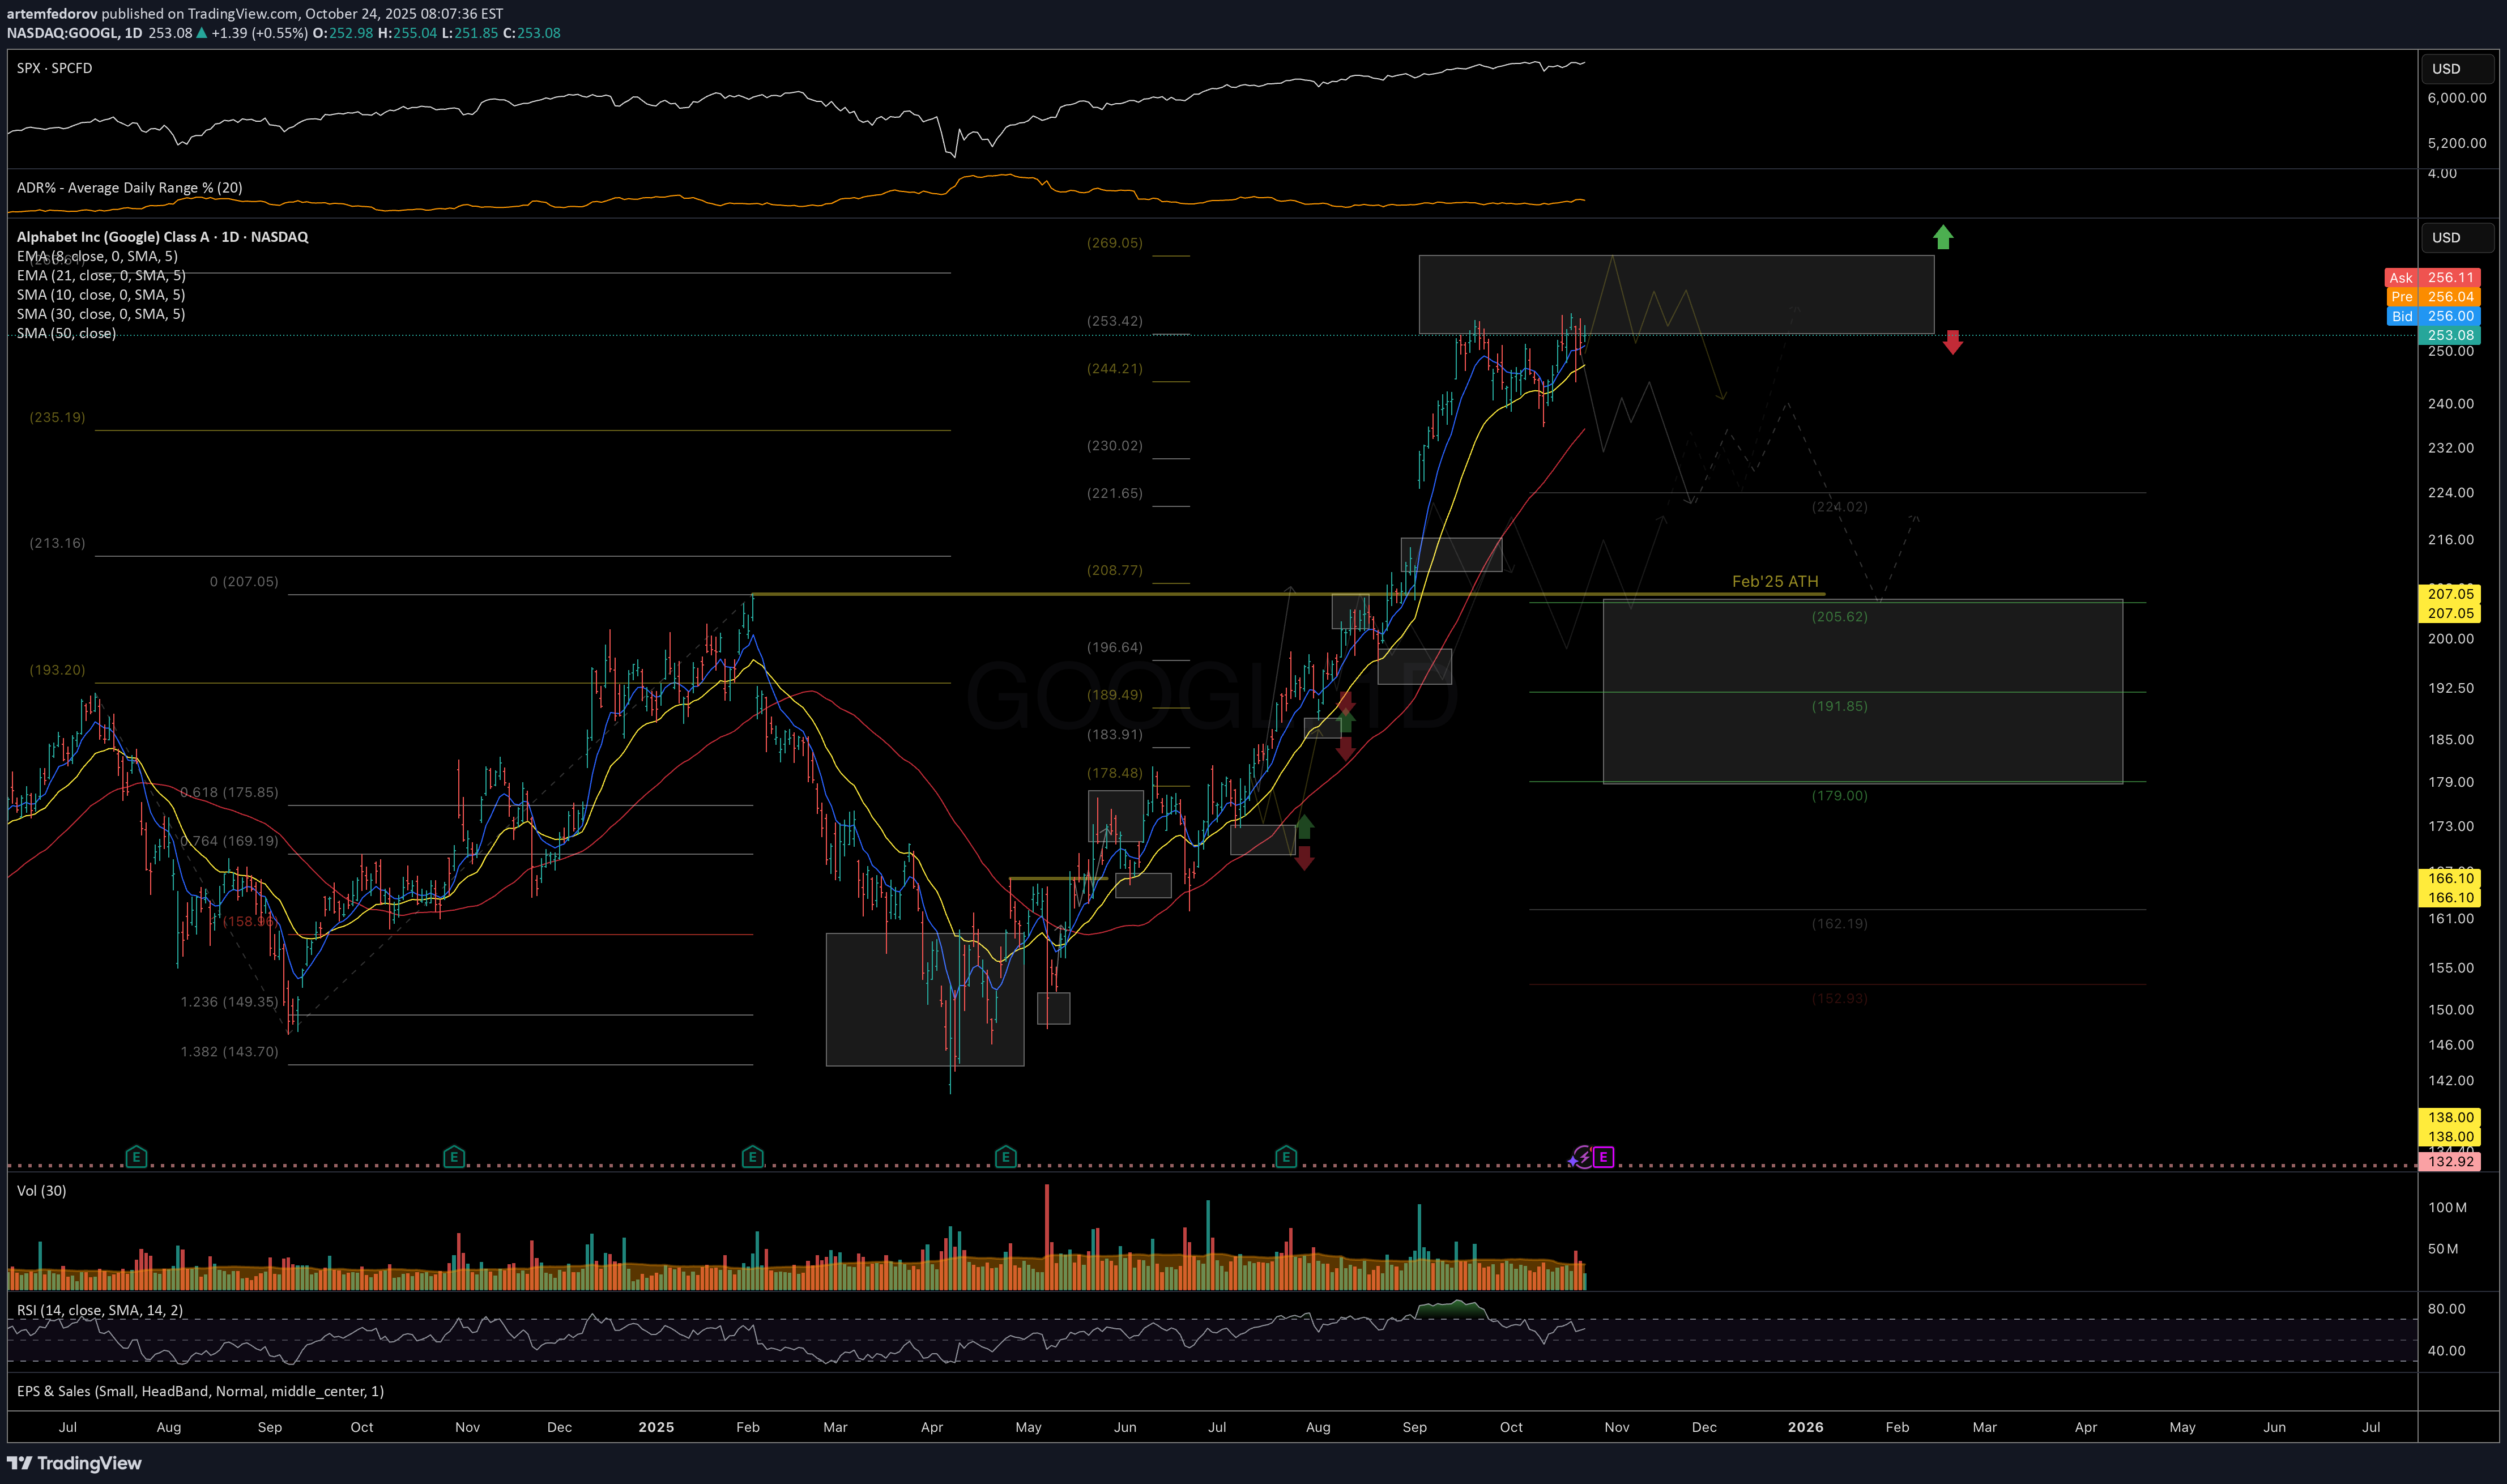
یتبع السعر الهیکل الموضح من تحدیثات یولیو وأغسطس، مما یوضح الأداء المتفوق النسبی المتوقع مقابل SPX. ومع ذلک، بدلاً من تشکیل تماسک طویل فی الخریف، تحرک السعر بشکل مباشر تقریبًا إلى منطقة المقاومة المستهدفة للاتجاه الصعودی منذ قاع أبریل: 250-270. فی حین أنه من الممکن حدوث دفعة أخرى على المدى القصیر نحو قمة منطقة المقاومة، طالما ظل السعر أقل من 270، فإننی أراقب ارتفاع ضغط البیع واحتمال حدوث تماسک دائم فی الأسابیع المقبلة. إذا تمکن السعر من تسجیل اختراق مستدام فوق 270، فستحتاج النظرة الهیکلیة الحالیة إلى إعادة تقییم. یُنصح بالحذر مع أی تعرض طویل جدید عند هذه المستویات، والنظر فی حمایة مراکز الشراء المفتوحة فی حالة حدوث انعکاس أو ضعف أوسع فی السوق. جدول: سابقًا: • حول المقاومة والتماسک المحتمل (29 أغسطس): جدول: Link: https://www.tradingview.com/symbols/NASDAQ-GOOGL/minds/?mind=uAr6w4iORjSXBxZ026OPTQ • حول الدعم المحلی (11 أغسطس): جدول: Link: https://www.tradingview.com/symbols/NASDAQ-GOOGL/minds/?mind=2gOSfJ2US8eHesa1_3FimA • فیما یتعلق باحتمالیة الارتفاع والقوة النسبیة مقابل SPX (5 أغسطس): Link: https://www.tradingview.com/symbols/NASDAQ-GOOGL/minds/?mind=O3UTkv8ESv6n5A5-9tS9sA • عند إعداد الاختراق (13 یولیو): جدول: Link: https://www.tradingview.com/symbols/NASDAQ-GOOGL/minds/?mind=dqJeeM9_REq6HIrMR8Us1A
artemfedorov
تحلیل هفتگی بیت کوین و اتریوم: آیا روند صعودی ادامه مییابد یا منتظر ریزش بزرگ باشیم؟
یستمر السوق فی move فی إطار الفرضیة الرئیسیة - احتمال اکتمال التصحیح من أعلى مستویاته التاریخیة والعلامات المبکرة على انعکاس الاتجاه المحتمل، کما تمت مناقشته فی مراجعتی الأخیرة للسوق: https://www.tradingview.com/chart/BTCUSD/4FXGCnwn-BTC-and-ETH-key-levels-to-watch-in-coming-weeks/ وطالما حافظ #BTC على الإغلاق الأسبوعی فوق 102 ألف، فإن السیناریو الأساسی (لکل من #BTC و#ETH) یظل دون تغییر - التعافی التدریجی، والتماسک، وmove نحو قمم جدیدة. ولا أستبعد احتمال حدوث ذلک حتى قبل نهایة العام. ومع ذلک، فإن الإغلاق الأسبوعی أقل من 102 ألف سیشیر إلى زیادة احتمال انتهاء دورة النمو الکلی لمدة أربع سنوات ویمکن أن ینتقل السوق إلى مرحلة تصحیحیة کلیة عبر مجال العملات المشفرة. تحدیث المستویات الرئیسیة والرسوم البیانیة: بیتکوین مقابل الدولار الدعم: 106 کیلو | المقاومة: 110-112 ک جدول: إیثریوم/دولار الدعم: 3680 | المقاومة: 4360 جدول: شکرًا لک على اهتمامک، وأتمنى لک بدایة مثمرة للأسبوع وقرارات تداول ناجحة فی المستقبل!
إخلاء المسؤولية
أي محتوى ومواد مدرجة في موقع Sahmeto وقنوات الاتصال الرسمية هي عبارة عن تجميع للآراء والتحليلات الشخصية وغير ملزمة. لا تشكل أي توصية للشراء أو البيع أو الدخول أو الخروج من سوق الأوراق المالية وسوق العملات المشفرة. كما أن جميع الأخبار والتحليلات المدرجة في الموقع والقنوات هي مجرد معلومات منشورة من مصادر رسمية وغير رسمية محلية وأجنبية، ومن الواضح أن مستخدمي المحتوى المذكور مسؤولون عن متابعة وضمان أصالة ودقة المواد. لذلك، مع إخلاء المسؤولية، يُعلن أن المسؤولية عن أي اتخاذ قرار وإجراء وأي ربح وخسارة محتملة في سوق رأس المال وسوق العملات المشفرة تقع على عاتق المتداول.