Pepperstone
@t_Pepperstone

ما هو الشيء الذي ننصحك بشراءه من المواد الغذائية؟
سابق في الشراء
پیام های تریدر
مرشح
Pepperstone
Gold – Could it be on Course to Post New Record Highs?
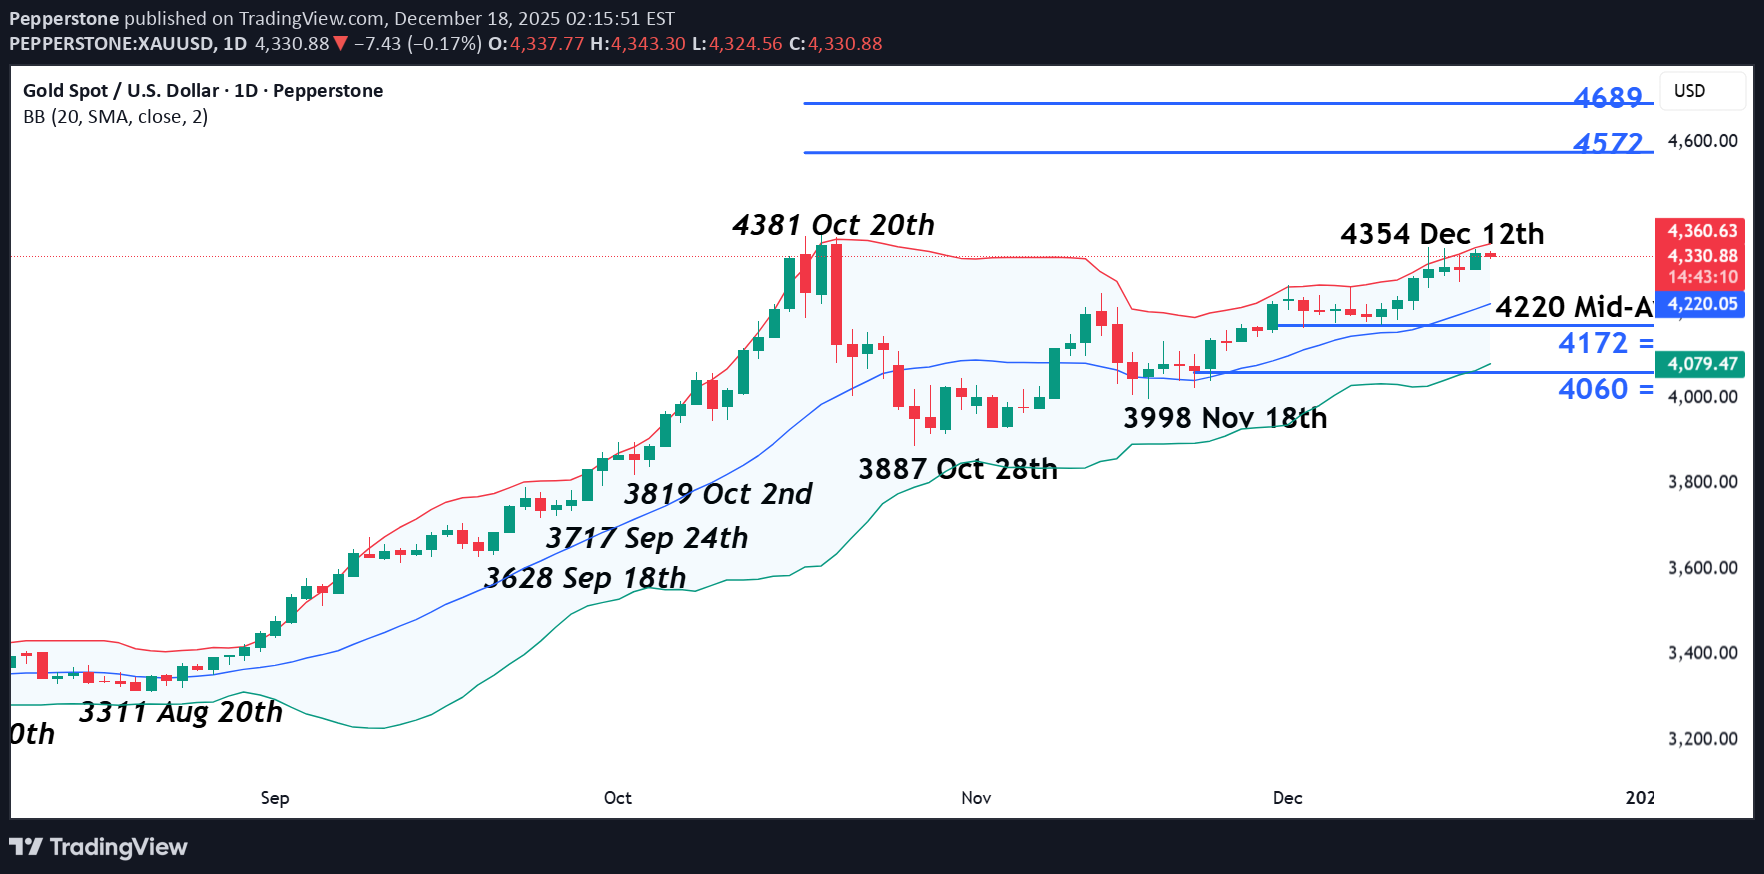
قد یکون الذهب قد احتل مقعدًا خلفیًا أمام الفضة فی الأسبوعین الماضیین، لکنه لا یزال یقع على مسافة قریبة من أعلى مستوى له على الإطلاق عند 4381 المسجل فی أواخر أکتوبر، ویتداول حالیًا حول 4335 فی وقت کتابة هذا التقریر (0630 GMT). وبالنظر إلى المستقبل، مع انخفاض السیولة بسبب فترة العطلات الاحتفالیة القادمة، قد یحاول المتداولون تقییم ما إذا کان إصدار معدل التضخم الأمریکی الیوم (CPI) والتحدیثات فی الوقت الفعلی حول تصاعد التوترات الجیوسیاسیة بین الولایات المتحدة وفنزویلا، قد یوفر ما یکفی من الحافز لدفع أسعار الذهب إلى مستویات أعلى أو قد یؤدی إلى خیبة الأمل والتراجع إلى مستویات أقل. یمکن أن یکون إصدار مؤشر أسعار المستهلکین الأمریکی الیوم فی الساعة 1330 بتوقیت جرینتش محرکًا مهمًا للتقلبات نظرًا لأن بعض صناع السیاسة فی بنک الاحتیاطی الفیدرالی أشاروا إلى أن أسعار المستهلکین التی تتجه فوق هدف البنک المرکزی الأمریکی البالغ 2٪ هی سبب محتمل لوقف المزید من تخفیضات أسعار الفائدة فی النصف الأول من عام 2026. إن انخفاض أسعار الفائدة کقاعدة یفید المعادن الثمینة التی هی أصول لا تدر فائدة. ولذلک، فإن رقم مؤشر أسعار المستهلک الأعلى من المتوقع یمکن أن یؤثر على أسعار الذهب، فی حین أن القراءة الأقل قد تشهد محاولات للدفع نحو قمم جدیدة. قد یکون الوضع الجیوسیاسی المتطور فی فنزویلا، حیث أمر الرئیس Trump بفرض حصار على ناقلات النفط الخاضعة للعقوبات التی تدخل وتخرج من البلاد، ذا صلة أیضًا بالمکان الذی یتحرک فیه الذهب بعد ذلک حیث یُنظر إلیه تقلیدیًا على أنه أصل ملاذ safe فی أوقات الأزمات. وسط حشد القوات العسکریة الأمریکیة فی المنطقة، فإن أی تصعید قد یؤدی إلى ارتفاع أسعار الذهب، فی حین أن أی علامات على الحل قد تؤدی إلى التراجع حتى نهایة الأسبوع. التحدیث الفنی للذهب: هل یمکن أن یکون فی طریقه لتسجیل أعلى مستویاته على الإطلاق؟ بعد فترة من النشاط الجانبی المتقلب، یظهر الذهب بعض الإمکانیة لمرحلة أخرى من قوة السعر. ومع ذلک، فإن المقاومة عند أعلى مستوى على الإطلاق فی 20 أکتوبر عند 4381 لا تزال تحد من التقدم الحالی، مع تباطؤ الزخم الصعودی مع اقتراب هذا المستوى. على هذا النحو، قد یکون من المهم مراقبة کیفیة الدفاع عن هذه المقاومة عند 4381 على أساس الإغلاق لأنها یمکن أن تساعد فی قیاس المواضیع الاتجاهیة لتحرک الذهب للأمام. مستویات المقاومة المحتملة: غالبًا ما یکون أعلى مستوى قدیم على الإطلاق بمثابة نقطة محوریة مهمة للمتداولین. فی حالة الذهب، أثبتت قمة 20 أکتوبر عند 4381 فی السابق قوتها بما یکفی لیس فقط للحد من التقدم ولکن أیضًا للمساعدة فی بدء عملیات بیع هبوطًا إلى أدنى مستوى لیوم 28 أکتوبر عند 3887، کما هو موضح فی الرسم البیانی أعلاه. إذا کان لنشاط السعر الحالی أن یتطور إلى مرحلة أخرى من القوة، فقد یکون الإغلاق فوق مستوى المقاومة 4381 مطلوبًا الآن. یمکن أن تؤدی الاختراقات الناجحة بعد ذلک إلى تحویل الترکیز إلى مستویات مقاومة أعلى، مثل امتداد فیبوناتشی 38.2% عند 4572، أو حتى امتداد 61.8% عند 4689. مستویات الدعم المحتملة: بالطبع، لا یزال المستوى 4381 سلیماً فی الوقت الحالی، ومن الممکن أن یؤدی هذا المستوى إلى تحدید سقف للأسعار مرة أخرى ویؤدی إلى ضعف جدید. إذا تجدد ضغط البیع خلال الفترة المتبقیة من الأسبوع، مع بقاء مستوى المقاومة عند 4381 سلیمًا على أساس الإغلاق، فقد یتحول ترکیز المتداولین بعد ذلک إلى الدعم الذی یوفره متوسط متوسط بولینجر الصاعد، والذی یقع حالیًا عند 4220. إذا رأینا ذلک، فإن کسر الإغلاق تحت هذا الدعم المحتمل عند 4220 قد یفتح المجال لمزید من انخفاضات الأسعار نحو 4172، وهو دعم تصحیح فیبوناتشی 38.2٪. قد یؤدی الفشل فی الثبات عند هذا المستوى 4172 إلى فتح الطریق للتحرک نحو المستوى 4060، وهو مستوى التصحیح الأعمق بنسبة 61.8%. لم یتم إعداد المواد المقدمة هنا وفقًا للمتطلبات القانونیة المصممة لتعزیز استقلالیة أبحاث الاستثمار وبالتالی تعتبر بمثابة اتصالات تسویقیة. على الرغم من أنها لا تخضع لأی حظر على التعامل قبل نشر أبحاث الاستثمار، إلا أننا لن نسعى للاستفادة من أی میزة قبل تقدیمها لعملائنا. لا تقر Pepperstone أن المواد المقدمة هنا دقیقة أو حدیثة أو کاملة، وبالتالی لا ینبغی الاعتماد علیها على هذا النحو. المعلومات، سواء کانت من طرف ثالث أم لا، لا تعتبر بمثابة توصیة؛ أو عرض شراء أو بیع؛ أو التماس عرض لشراء أو بیع أی ورقة مالیة أو منتج مالی أو أداة؛ أو المشارکة فی أی استراتیجیة تداول معینة. ولا یأخذ فی الاعتبار الوضع المالی للقراء أو الأهداف الاستثماریة. ننصح أی قراء لهذا المحتوى بطلب المشورة الخاصة بهم. بدون موافقة Pepperstone، لا یُسمح بإعادة إنتاج أو إعادة توزیع هذه المعلومات.
Pepperstone
پیناسکنر تریدینگویو: اسکن قدرتمند برای یافتن بهترین فرصتهای معاملاتی
لقد قمنا بتشغیل وظیفة PineScreener الخاصة بـ TradingView، حیث قمنا بتحدید المؤشرات ضمن عملیات مسح مخصصة لحرکة السطح والتقلب والزخم مباشرة إلى المتداول. نحن نقوم بتحلیل الإعدادات التی یتم عرضها بشکل جید ونستکشف کیف یمکن تداولها بشکل أکثر فعالیة. ألق نظرة…
Pepperstone
بیت کوین در کف ترس؛ آیا قیمت هم به همین اندازه سقوط کرده است؟
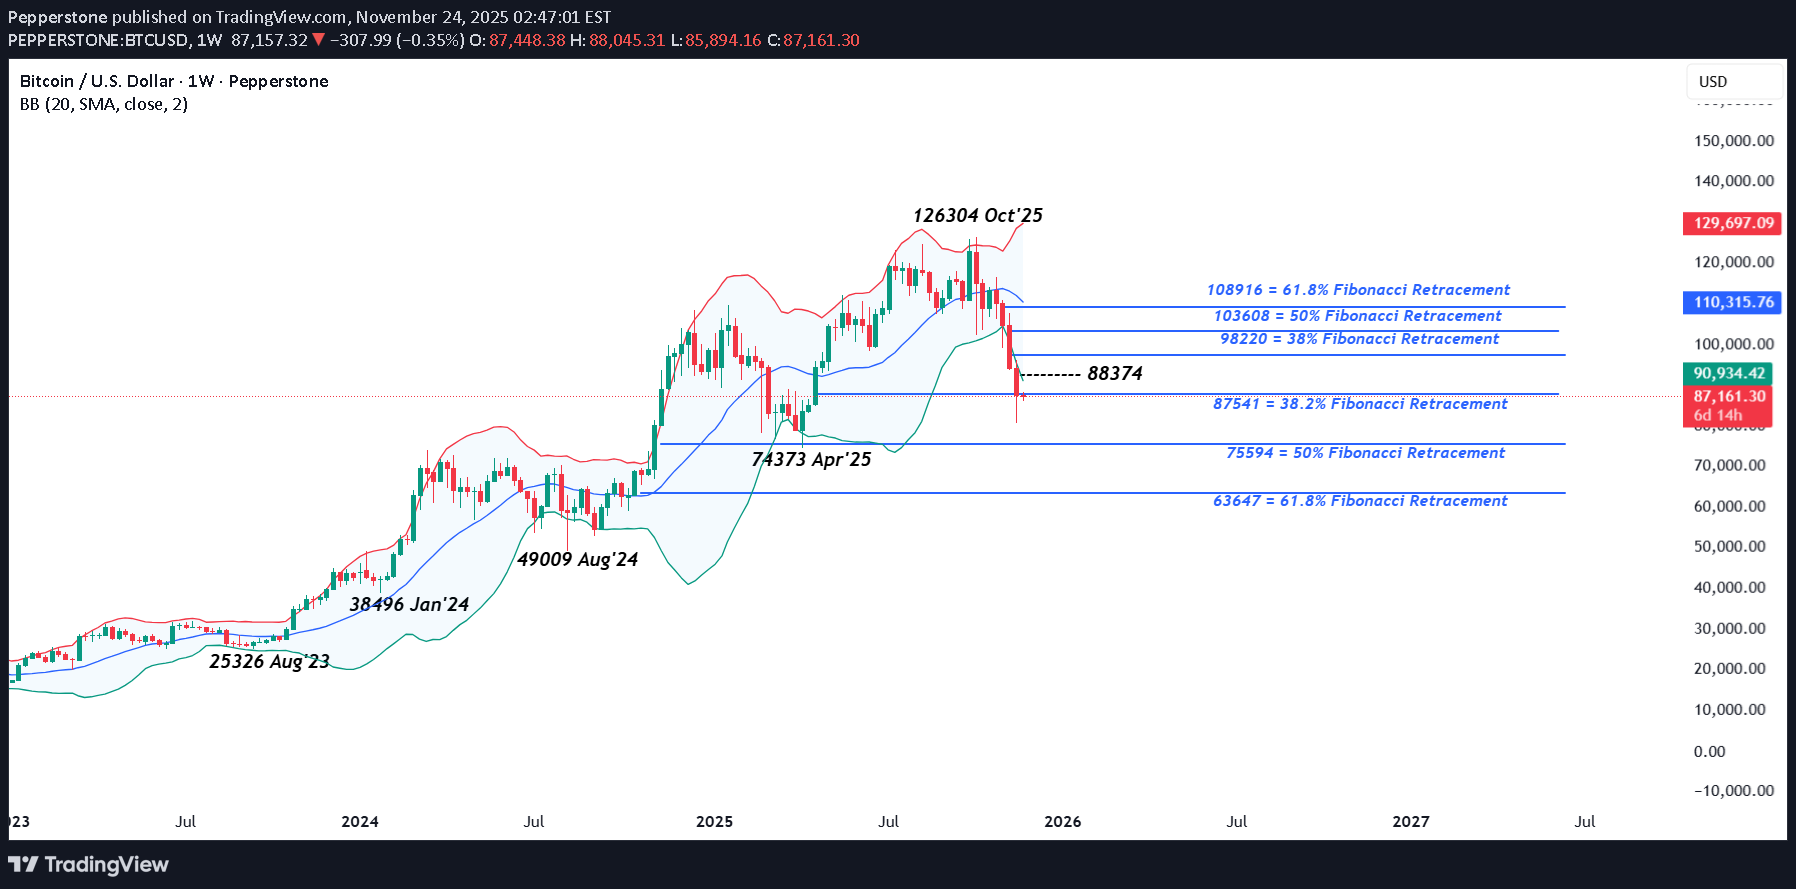
انخفض Bitcoin إلى مستوى 80498 یوم الجمعة، وهو أدنى مستوى تداول له منذ أواخر أبریل وبنسبة 27% عن مستوى الافتتاح عند حوالی 110000 فی بدایة نوفمبر. ومع ذلک، لم تقتصر السلبیة على عملة البیتکوین فحسب، بل خسر سوق العملات المشفرة أکثر من تریلیون دولار من قیمته خلال نفس الفترة، وهو ما أرسل مؤشر الخوف والجشع الخاص بـ CoinMarketCap إلى منطقة الخوف الشدید بقراءة 10 من 100. وهو أمر ربما لا یکون مفاجئًا نظرًا لمدى سرعة حدوث move. لقد کافح مراقبو السوق للإشارة إلى سبب واحد وحید للانخفاض الکبیر ولکن یمکن ربطه بجنی الأرباح من عملیات التداول الشهیرة بالرافعة المالیة عبر العدید من فئات الأصول التی أنتجت مکاسب قویة فی عام 2025. على سبیل المثال، فی أکتوبر، انخفض الذهب بنسبة 11٪ من مستوى قیاسی مرتفع عند 4381 إلى 3886، وفی مساحة AI، خلال شهر نوفمبر، تراجعت Palantir Technologies بنسبة 33٪ 221.75 إلى 147.50. قد یکون تحول البیتکوین إلى الاتجاه السائد أمرًا مهمًا أیضًا. لا یخشى المستثمرون المؤسسیون من خفض المراکز ذات الأداء الضعیف خلال فترات النفور من المخاطرة، وقد لوحظ أنه تم إخراج الملیارات من الصنادیق المتداولة فی البورصة (ETFs) خلال شهر نوفمبر. هذا الاندفاع من قبل المستثمرین للخروج فی نفس الوقت یمکن أن یقلل السیولة ویمتد التحرکات إلى مستویات أکثر تطرفا. خلال عطلة نهایة الأسبوع، استقرت الأسعار، التی یتم تداولها 24 ساعة فی الیوم و7 أیام فی الأسبوع على عکس الأسواق المالیة التقلیدیة، فی التداول قصیر المدى مرة أخرى فوق 86000 فی وقت مبکر من صباح یوم الاثنین. والسؤال الآن هو "ماذا سیأتی بعد ذلک؟" للإجابة على هذا السؤال، قد یتطلع المتداولون إلى الرسوم البیانیة لتحدید المستویات المهمة المحتملة التی یمکن أن تشیر إلى تحرکات الاتجاه التالیة لـ Bitcoin. التحدیث الفنی: مستویات دعم التصحیح قید الترکیز: الاختراق للأسفل أم الثبات؟ وانخفض Bitcoin بنسبة 36% من أعلى مستوى له على الإطلاق فی أکتوبر عند 126304، مما یمثل تصحیحًا حادًا فی السعر. تاریخیًا، کان هذا التقلب نموذجیًا فی أسواق العملات المشفرة و یمکن للمتداولین الآن أن یفکروا فیما إذا کان هذا الانخفاض قد یمتد أکثر أم أنه تراجع مؤقت قبل انتعاش الأسعار، کما ثبت أنه کان علیه الحال فی الماضی القریب. وکما یبین الرسم البیانی أعلاه، قد یکون مصدر القلق بالنسبة للمضاربین على الارتفاع Bitcoin هو أن الدعم عند 87541، وهو مستوى تصحیح فیبوناتشی 38.2%، قد تم کسره على أساس الإغلاق. عادة من المتوقع أن یحد هذا المستوى من الانخفاضات، بل ویشجع على استئناف الاتجاه الصعودی، ولکن المخاطر الحالیة هی أن الفشل فی القیام بذلک فی الأسبوع الماضی قد یؤدی إلى احتمال حدوث المزید من الضعف. مستویات الدعم المحتملة: یمکن النظر إلى الإغلاق تحت مستوى دعم تصحیح فیبوناتشی 38.2% على أنه مجال مفتوح لمزید من التحرکات الهبوطیة. ویظل من غیر المؤکد ما إذا کان هذا صحیحًا بالنسبة لـ Bitcoin فی الأسبوع المقبل، ولکن الاختراق تحت 87541 یزید من احتمالیة اختبار مستویات دعم أقل. إذا حدث ذلک، فقد یحول المتداولون انتباههم إلى مستوى تصحیح فیبوناتشی 50% عند 75594، والذی یرتبط بقاع أبریل 2025 عند 74373. وفی حالة حدوث اختراقات إغلاق تحت هذه المستویات، فقد تمتد احتمالیة الاتجاه الهبوطی نحو 63647، والذی یمثل تصحیحًا أعمق بنسبة 62%. مستویات المقاومة المحتملة: وبعد هذا الانخفاض الحاد، من الممکن حدوث انتعاش قصیر المدى للمساعدة فی تفکیک الظروف المفرطة فی التوسع. ومع ذلک، لکی یتطور هذا إلى انتعاش أکثر استدامة، قد یکون الإغلاق فوق 88374 (نصف نطاق الأسبوع الماضی) ضروریًا. على الرغم من أنها لیست إشارة إیجابیة تمامًا، إلا أن الإغلاق فوق 88374 قد یؤدی إلى اختبار 98220، وهو مستوى یساوی ارتداد 38% من انخفاضات أکتوبر/نوفمبر. فی حالة تحقیق اختراقات إغلاق فوق مستوى 98220، فقد یمهد هذا بدوره الطریق لمزید من القوة نحو مستوى 103608، وهو مستوى تصحیح 50%. لم یتم إعداد المواد المقدمة هنا وفقًا للمتطلبات القانونیة المصممة لتعزیز استقلالیة أبحاث الاستثمار وبالتالی تعتبر بمثابة اتصالات تسویقیة. على الرغم من أنها لا تخضع لأی حظر على التعامل قبل نشر أبحاث الاستثمار، إلا أننا لن نسعى للاستفادة من أی میزة قبل تقدیمها لعملائنا. لا تقر Pepperstone أن المواد المقدمة هنا دقیقة أو حدیثة أو کاملة، وبالتالی لا ینبغی الاعتماد علیها على هذا النحو. المعلومات، سواء کانت من طرف ثالث أم لا، لا تعتبر بمثابة توصیة؛ أو عرض شراء أو بیع؛ أو التماس عرض لشراء أو بیع أی ورقة مالیة أو منتج مالی أو أداة؛ أو المشارکة فی أی استراتیجیة تداول معینة. ولا یأخذ فی الاعتبار الوضع المالی للقراء أو الأهداف الاستثماریة. ننصح أی قراء لهذا المحتوى بطلب المشورة الخاصة بهم. بدون موافقة Pepperstone، لا یُسمح بإعادة إنتاج أو إعادة توزیع هذه المعلومات.
Pepperstone
وضعیت سهام انویدیا قبل از گزارش درآمد: اصلاح جزئی یا تغییر کامل بازار؟
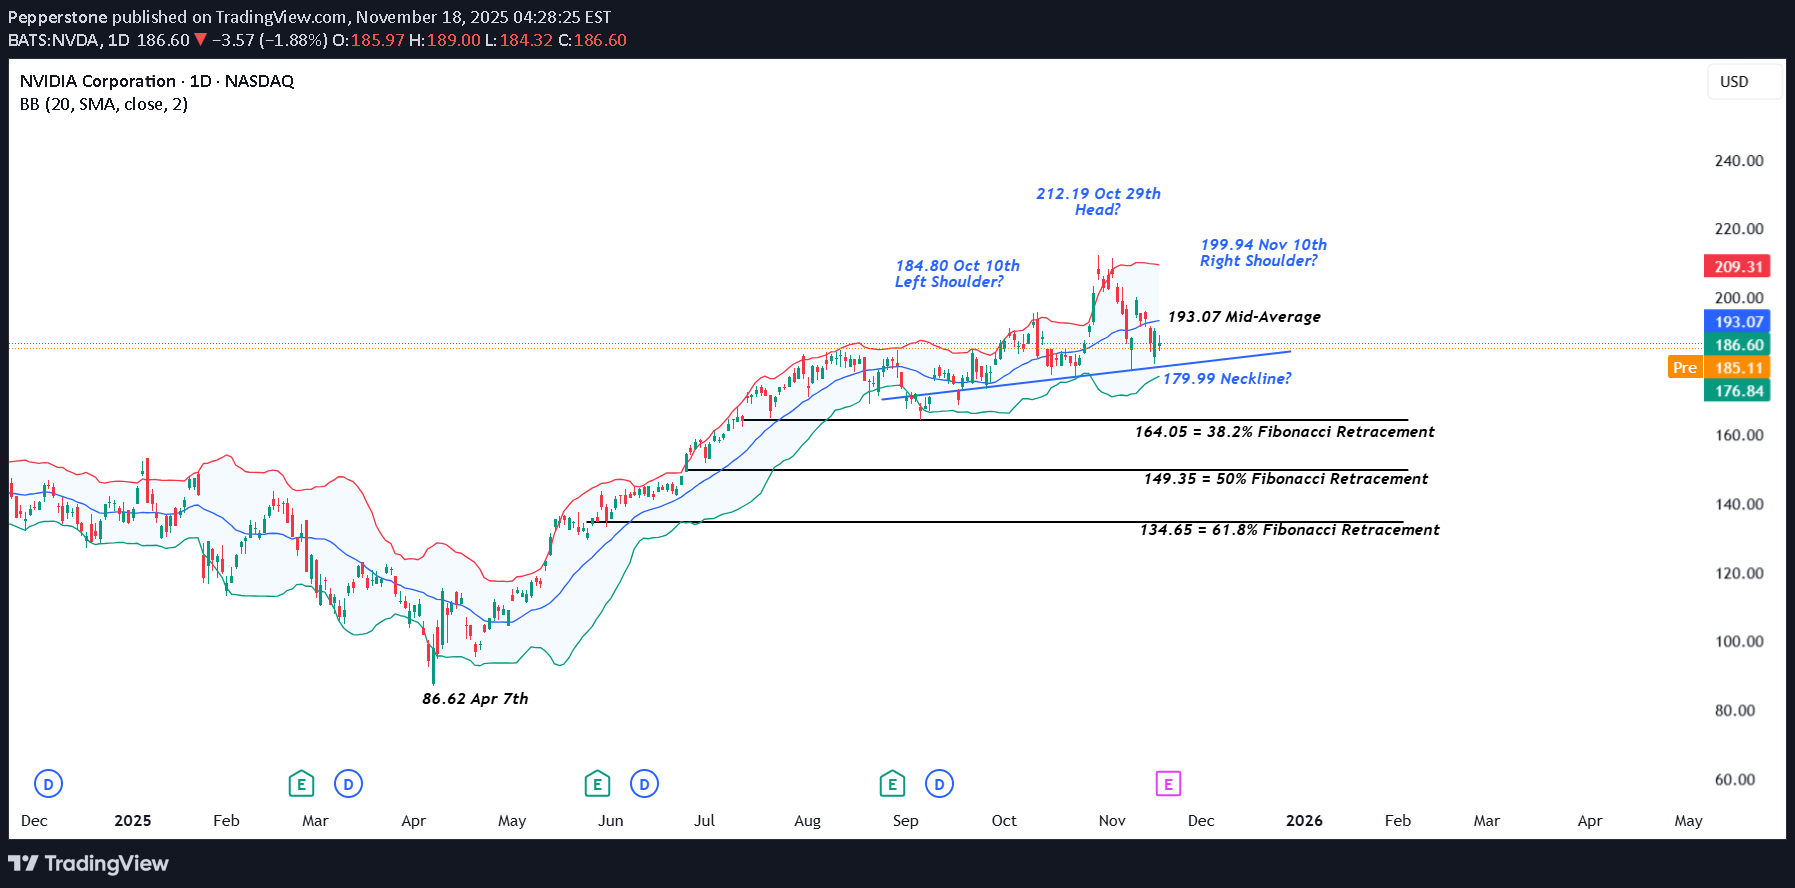
There is no getting away from it, NVIDIA’s earnings, which are due on Wednesday after the close are making traders nervous. The problem with being the largest company in the world by market capitalisation (approx.$4.53 trillion) with a roughly 7.5% weighting in the S&P 500 and closer to 10% weighting in the Nasdaq 100 is that everything related to your company matters, especially when you are seen as the global AI benchmark at a time when traders are wondering if lofty valuations given to the leading companies in the space are justified or not. Suddenly, stories like Softbank selling its entire NVIDIA stake of $5.8 billion last week, gets more headline space in the financial press and now your Q3 earnings are potentially being seen as important to the direction of market sentiment and risk appetite as whether the Federal Reserve decides to cut interest rates again at its final meeting of the year on December 10th. The earnings, when they are released are anticipated to be strong, with Reuters reporting analysts expecting an average 54% year on year rise on Q3 earnings per share. However, while traders may be judging the actual results against market expectations, they may also be keen to hear the updates from CEO Jensen Huang regarding future revenue and chips sales moving forward. With the potential for extra volatility in NVIDIA’s share price across the next 48 hours being apprised of the technical backdrop could be important. Technical Update: Limited Correction or Sentiment Shift? It has been a choppy period for the Nvidia share price since mid-September 2025, activity that has seen 3 distinct highs in price posted. As the chart below shows, these stand at 184.80 on October 10th, 212.19 from October 29th and 199.94, scored on November 10th. As you can also see on the chart, the 2nd of these 3 peaks at 212.19, is higher than the other 2, which is important from a technical perspective. This may lead some analysts to suggest this activity could be forming a potential Head and Shoulders top pattern. It is important to stress that a Head and Shoulders pattern must be completed by a close below the ‘neckline’ or the trend connecting recent price lows, which in the case of Nvidia currently stands at 179.99. Even then, completion of such a pattern isn’t a guarantee of a sentiment shift, but as we approach Nvidia earnings on Wednesday, risks may turn towards increased price volatility, and being aware of potentially relevant support and resistance levels may prove useful. [bWhat if Closes Below 179.99 Support are Seen?: Having seen recent price weakness held and reversed to the upside by the uptrend currently standing at 179.99, this could now be viewed as the first support focus. However, with it also possibly being the neckline of a potential Head and Shoulders pattern, it may prove to be pivotal moving forward. While there is no guarantee closes that below the support at 179.99 may lead to a further phase of price weakness, it might skew risks towards continued declines. Focus may then turn towards 164.05, a level equal to the 38.2% retracement level of April to October strength, possibly even towards 149.35, which is the 50% retracement. What if 179.99 Support Remains Intact?: As already said, any Head and Shoulders pattern must see closes below neckline support to suggest a completion and risks for further price declines. For Nvidia the 179.99 support is still intact on a closing basis, and it could be argued this is not yet a valid reversal pattern. As such, while the 179.99 level holds, traders may view recent price declines as a limited correction within what could still be classed as an uptrend in price. However, if a further phase of price strength is to materialise, traders may require closes back above the still rising Bollinger mid-average currently at 193.07. Such moves if seen, could then lead to tests of 199.94 the November 10th high, even on towards 212.19, the October 29th extreme. The material provided here has not been prepared accordance with legal requirements designed to promote the independence of investment research and as such is considered to be a marketing communication. Whilst it is not subject to any prohibition on dealing ahead of the dissemination of investment research, we will not seek to take any advantage before providing it to our clients. Pepperstone doesn’t represent that the material provided here is accurate, current or complete, and therefore shouldn’t be relied upon as such. The information, whether from a third party or not, isn’t to be considered as a recommendation; or an offer to buy or sell; or the solicitation of an offer to buy or sell any security, financial product or instrument; or to participate in any particular trading strategy. It does not take into account readers’ financial situation or investment objectives. We advise any readers of this content to seek their own advice. Without the approval of Pepperstone, reproduction or redistribution of this information isn’t permitted.
Pepperstone
صعود انفجاری طلا: چرا آرامش سیاسی بازار آمریکا قیمتها را به اوج رساند؟
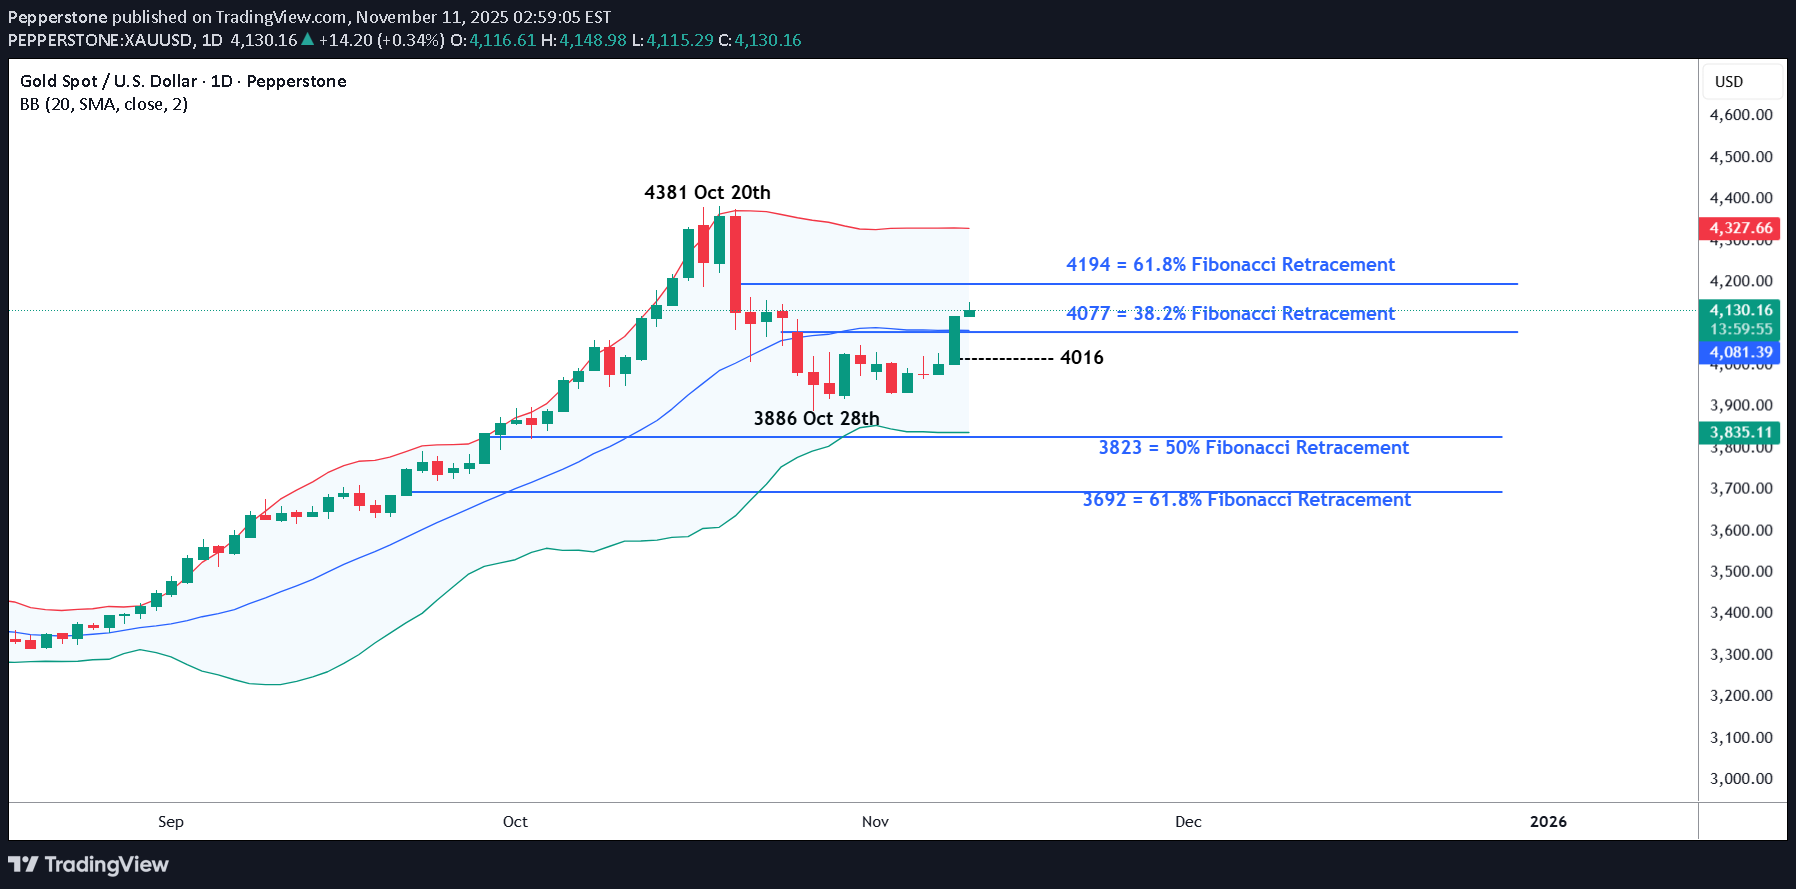
کان من المثیر للاهتمام أن نرى أن التقدم فی عطلة نهایة الأسبوع بین المشرعین الدیمقراطیین والجمهوریین بشأن وضع حد لأطول إغلاق للحکومة الفیدرالیة فی تاریخ الولایات المتحدة أدى إلى ارتفاع بنسبة 2.6٪ فی الذهب، من مستویات الافتتاح حول 4000 یوم الاثنین إلى أعلى مستوى فی أسبوعین عند 4116، وهو move الذی امتد هذا الصباح لیسجل أعلى مستوى عند 4149. اختار المتداولون الترکیز على الوضوح المحتمل الذی یمکن أن یجلبه move إلى سعر الفائدة الحالی لمجلس الاحتیاطی الفیدرالی (الاحتیاطی الفیدرالی). التوقعات المستقبلیة، بدلاً من تقلیص تعرضهم للذهب، حیث ظلوا ملاذًا للتحوط ضد حالة عدم الیقین الاقتصادی والضرر المحتمل الذی ألحقه الإغلاق طویل الأمد بالاقتصاد الأمریکی. من المأمول أن تؤدی إعادة فتح الحکومة الأمریکیة إلى استعادة الاقتصاد data flow مما یوفر تحدیثات حول صحة سوق العمل الأمریکی واتجاه التضخم فی الوقت المناسب للتأثیر على عملیة صنع القرار لدى صناع السیاسة فی بنک الاحتیاطی الفیدرالی قبل قرارهم النهائی بشأن سعر الفائدة لهذا العام فی 10 دیسمبر. وقد ساعد تسعیر السوق الحالی الذی یمثل فرصة بنسبة 65٪ تقریبًا لخفض سعر الفائدة بمقدار 25 نقطة أساس أخرى فی هذا الاجتماع على دعم ارتفاع الذهب بمقدار move، باعتباره أصلًا لا یحمل فائدة. یبدو أن التقدم فی إنهاء الإغلاق یتسارع مع تصویت مجلس الشیوخ للموافقة على حزمة الإنفاق التی تبقی معظم الحکومة مفتوحة حتى نهایة ینایر، وبعض الإدارات مفتوحة حتى نهایة سبتمبر. ینتقل مشروع القانون الآن إلى مجلس النواب للموافقة علیه قبل إرساله إلى الرئیس Trump لتوقیعه. هناک عائقان محتملان قد یضیفان المزید من التقلبات إلى أسعار الذهب خلال الفترة المتبقیة من الأسبوع. یمکن أن تکون النظرة الفنیة مؤثرة أیضًا بعد إغلاق یوم أمس فوق مستوى المقاومة عند 4077، وهو ارتداد بنسبة 38.2% من انخفاض الأسعار فی أکتوبر. التحدیث الفنی للذهب: هل هناک علامات على استئناف الاتجاه الصعودی؟ بعد انخفاض الأسعار إلى أدنى مستوى یوم 28 أکتوبر عند 3886، دخل الذهب مرحلة من حرکة السعر الأکثر توازنًا، مع سیطرة التماسک الجانبی على الجلسات الأخیرة. یشیر هذا إلى توقف الزخم الاتجاهی حیث یقوم المتداولون بتقییم ما إذا کان الانخفاض قد وصل إلى مساره أو ما إذا کان المزید من ضعف الأسعار قد یستأنف. ومع ذلک، بعد أنباء عطلة نهایة الأسبوع عن احتمال إعادة فتح الحکومة الأمریکیة، ظهر دعم جدید یوم الاثنین. ونتیجة لذلک، ارتفع الذهب الآن بما یزید عن 6.7% من أدنى مستوى سجله فی 28 أکتوبر (3886)، مما یمثل انتعاشًا ملحوظًا من الضعف الأخیر. قد یرکز المتداولون الآن على اختراق الإغلاق یوم الاثنین فوق مستوى المقاومة عند 4077، وهو مستوى یساوی تصحیح فیبوناتشی 38.2% لضعف أکتوبر. وفی حین أن هذا لا یضمن المزید من قوة الأسعار، إلا أن هذا move قد یؤدی إلى مرحلة من التعافی. لذلک، قد یکون من المفید قیاس مستویات الدعم والمقاومة بعد آخر نشاط للسعر للحصول على أدلة محتملة لموضوعات الاتجاه التالیة. مستویات المقاومة المحتملة: فی حین أن حرکة السعر المستقبلیة ستحدد فی النهایة تحرک الذهب بعد ذلک، فإن الإغلاق الأخیر فوق 4077 قد یشیر إلى مزید من الارتفاع فی السعر. وقد یؤدی هذا إلى زیادة احتمالیة اختبار مستوى 4194، وهو مستوى تصحیح أعلى بنسبة 61.8% من انخفاض شهر أکتوبر. من المحتمل أن یکون مستوى تصحیح 61.8% عند 4194 عائقًا قویًا أمام قوة السعر، وإذا تم اختباره فقد یواجه الذهب مقاومة أقوى هنا. ومع ذلک، فإن کسر الإغلاق فوق هذا المستوى قد یفتح المجال أمام تحرکات صعودیة أعمق نحو مستوى 4381، وهو الحد الأقصى لیوم 20 أکتوبر. مستویات الدعم المحتملة: بعد سرعة الحرکة الصعودیة یوم أمس، قد یکون أول دعم محتمل للمتداولین لمراقبته عند 4016، وهو مستوى یمثل نصف الارتفاع الأخیر من أدنى مستویاته عند 3886 (قاع 27 أکتوبر). قد یکون التراجع إلى هذا المستوى بمثابة رد فعل روتینی على القوة الأخیرة، ولکن الإغلاق تحت هذا المستوى قد یشیر إلى تجدد الضغط الهبوطی. على الرغم من أنها لیست إشارة نهائیة على الضعف المتجدد، إلا أن الإغلاق تحت 4016 قد یفتح الباب لإعادة اختبار 3886، وهو أدنى مستوى لیوم 28 أکتوبر، وربما حتى 3823، وهو مستوى یساوی تصحیح فیبوناتشی 50% لتقدم أغسطس إلى أکتوبر.
Pepperstone
شاخص US 500: آیا پایان تعطیلی دولت، اخبار خوب را تمام کرد؟
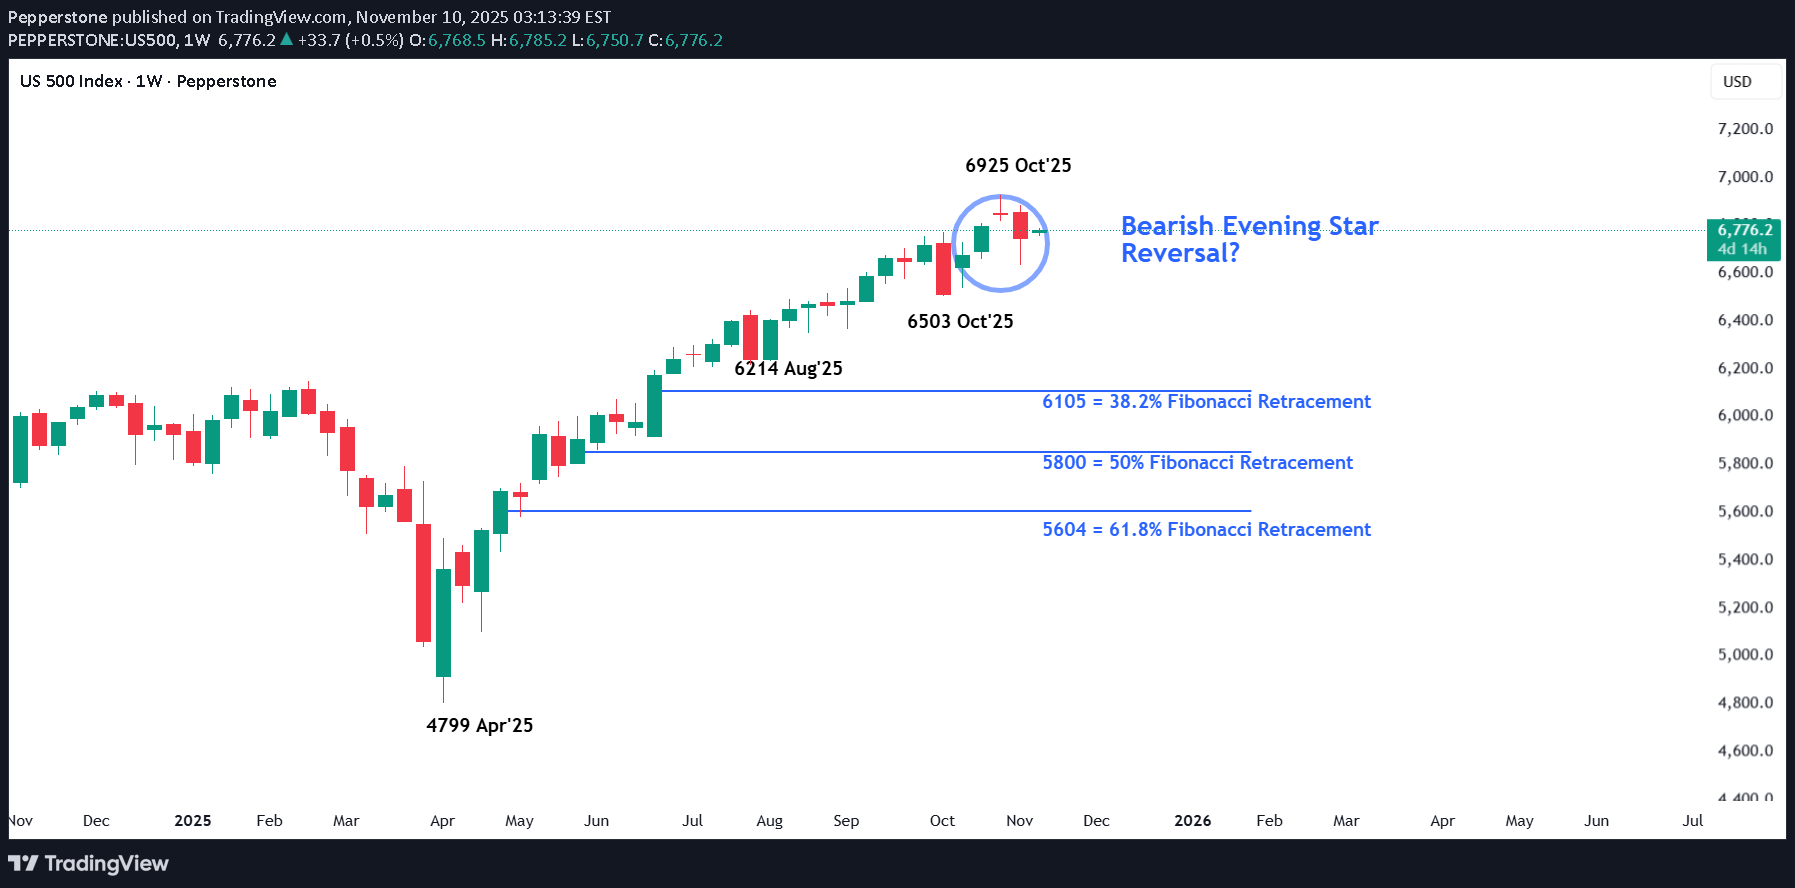
After a volatile and nervy 5 days for US stock indices the week ended on a slightly more stable and positive footing. In relation to the US 500 index this volatility saw it open on Monday November 3rd around 6885, trade down to a low of 6633 early on Friday November 7th, before rallying by over 1% late in the session to close the week at 6742. The driver for the rally was news that Democrats and Republican lawmakers had restarted negotiations to try and resolve what has become the longest US government shutdown in history. This shutdown has been reported by Bloomberg to be costing the US economy around $15 billion per week in lost productivity and has stopped the release of key US economic data readings, leaving Federal Reserve (Fed) policymakers in the dark regarding the health of the US labour market (Non-farm Payrolls) and the direction of inflation (CPI/PPI/PCE). Two areas which are crucial in helping them decide whether they have room, or the need to cut interest rates again at their next meeting in December. Perhaps unsurprisingly, after a jittery week where the lofty valuations of AI firms were called into question and weighed on the price of the US 500 index, traders may now be looking at whether a resolution to the shutdown, which would restart the economic data flow again ahead of the Fed’s next rate decision on December 10th could be possible, bringing with it a potentially much needed boost to flagging sentiment. On Sunday, traders received the news that the Senate had moved closer to an agreement, an update which has helped the US 500 to register an early gain of 0.5% (6790 at 0700 GMT) to start this new trading week. However, even if the agreed bill is eventually passed by the Senate, it must be approved by the House of Representatives and signed by President Trump (Reuters), meaning there could be more volatility ahead for the US 500. Technical Update: Conflicting Signals Within Weekly & Daily Perspectives Since the October 30th all-time high at 6925, the US 500 index has slipped just over 4.2%, reflecting an unwind of potentially over-extended upside conditions. Looking at the charts there appears to be conflicting technical signals between the weekly and daily perspectives at present, leaving the directional bias uncertain heading into the new week. Upcoming sessions could offer clarity on whether the constructive themes emerging on the daily chart or the possibly negative developments evident in the weekly view may take control. Weekly Chart – Potential Negative Outlook?: Over the past three weeks, a possible Evening Star pattern has emerged on the weekly chart, a potentially negative development. Last week’s price weakness may have completed a sentiment shift, and if downside momentum builds, it could lead to further declines in the sessions ahead. It remains to be seen whether this leads to further price weakness, but downside pressure may now build. If developed further, breaks below support at 6503, the October 2025 low could materialise, opening the door to a deeper phase of weakness toward 6214, a level equal to the August 2025 low, potentially even 6105, the 38.2% Fibonacci retracement of the April to October 2025 rally. Daily Chart – Potential Positive Sentiment Shift?: Following the recent sharp price decline, the daily chart presents a dilemma for traders, especially against the backdrop of a potentially negative weekly setup. Friday’s session initially extended recent downside moves but found support at 6647, the 38.2% Fibonacci retracement of the April to October rally. From there, fresh strength emerged, and the session closed near its opening level at the upper end of the day’s range. Candlestick analysis suggests a potentially positive Dragonfly Doji has formed, hinting at an attempt to resume price strength. Confirmation is key, a positive candle on Monday, seen with a close above todays 6769 opening level, would offer weight to this pattern. While not a guarantee of further upside, such activity might also see a close above resistance at 6779 (half the latest decline) a level at present being tested (0700 GMT), to potentially suggest a retest of 6925, the October 30th high. Initially it is unclear whether the weekly or daily outlook will gain the upper hand in the US 500 index, but next week’s price action, especially the moves on Monday, could be important. With the weekly chart hinting at a negative reversal risk and the daily chart showing signs of potential stabilisation, even possible positive risks, Monday’s candle direction may offer clues, and traders may be watching closely for evidence of the next directional themes. The material provided here has not been prepared accordance with legal requirements designed to promote the independence of investment research and as such is considered to be a marketing communication. Whilst it is not subject to any prohibition on dealing ahead of the dissemination of investment research, we will not seek to take any advantage before providing it to our clients. Pepperstone doesn’t represent that the material provided here is accurate, current or complete, and therefore shouldn’t be relied upon as such. The information, whether from a third party or not, isn’t to be considered as a recommendation; or an offer to buy or sell; or the solicitation of an offer to buy or sell any security, financial product or instrument; or to participate in any particular trading strategy. It does not take into account readers’ financial situation or investment objectives. We advise any readers of this content to seek their own advice. Without the approval of Pepperstone, reproduction or redistribution of this information isn’t permitted.
Pepperstone
بیت کوین در آستانه سقوط عمیقتر؟ تحلیل تکنیکال حمایتها و مقاومتها
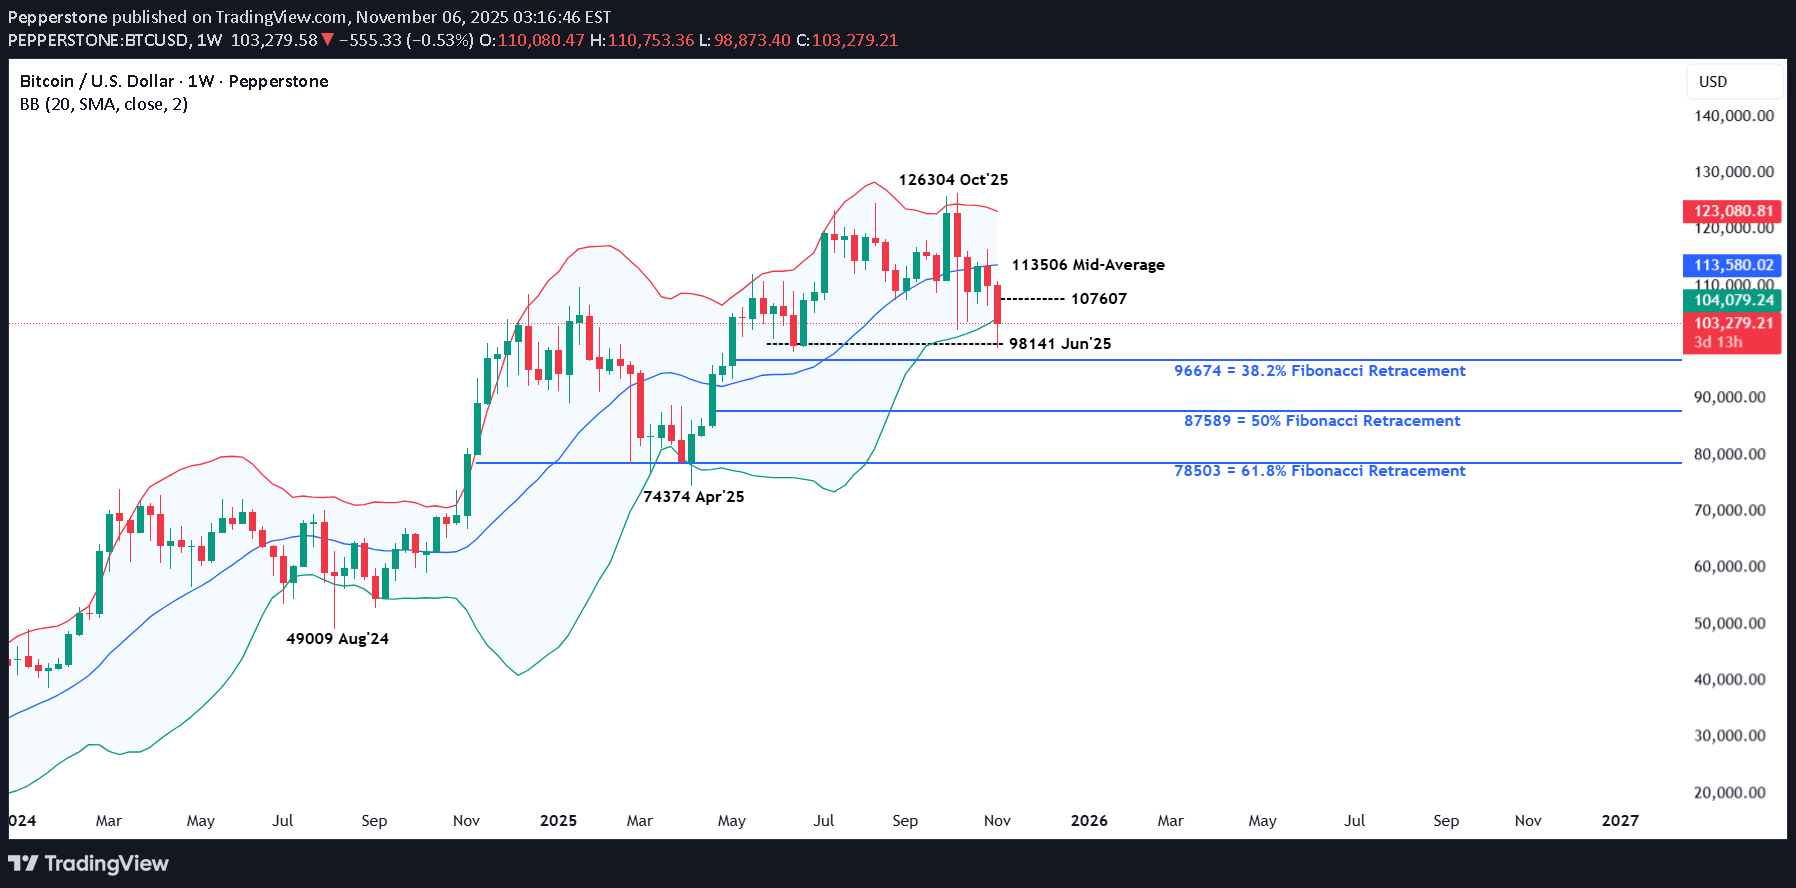
لم یکن Bitcoin وسوق العملات الرقمیة الأوسع محصنین ضد النفور من المخاطرة السائد فی الأسواق المالیة هذا الأسبوع، حیث یقوم المتداولون بإعادة تقییم ما إذا کانت التقییمات المرتفعة والمراکز المفرطة عبر مجموعة من الأصول لا تزال صالحة أم أنها تستحق التعدیل. وقد شهدت عملیة إعادة تقییم الأسعار هذه تداول Bitcoin من أعلى مستویاته المسجلة فی 6 أکتوبر فوق 126000 إلى أدنى مستوى له عند 98873 بالأمس فقط، أی انخفاض بنسبة 21.7%. الآن بالطبع، یمکن أن تکون العملة المشفرة رقم 1 فی العالم عرضة لفترات من التقلبات قصیرة المدى، ولکن ما قد یثیر قلق المتداولین هذه المرة هو أن أسباب الانخفاض لم تُعزى إلى المضاربین، أو الرافعة المالیة المفرطة، ولکن حاملیها على المدى الطویل لأکثر من 6 أشهر یقومون بتصفیة مراکزهم. إذا کان هذا صحیحًا، فقد یضیف ذلک وزنًا إلى النظریة القائلة بأن الارتفاع الحالی عند 126304 قد یظل قائمًا لفترة طویلة ما لم یتمکن اهتمام الشراء الجدید من العودة بسرعة إلى السوق. عندما تنشأ هذه الأنواع من المواقف فی أحد الأصول الشائعة، فمن المفید غالبًا move العودة إلى الرسوم البیانیة للتحقق من الاتجاهات الفنیة الحالیة لمعرفة ما إذا کانت تدعم تغییر الاتجاه المحتمل. بمجرد اکتمال هذا التقییم الأولی، فإن المرحلة التالیة هی البحث عن تحدید الدعم أو المقاومة الرئیسیة المحتملة. هذه هی المستویات التی یمکن أن یکون لها تأثیر اتجاهی على تحرک Bitcoin للأمام، اعتمادًا على ما إذا کانت تحتفظ بمزید من الاهتمام بالبیع أو الحد من الاهتمام بالشراء أو تم کسرها على أساس الإغلاق للإشارة إلى أن اتجاه أکبر move قد یکون مؤثرًا. فیما یلی التقییم الفنی الحالی لـ Bitcoin. التحدیث الفنی: Bitcoin یقضی على مکاسب الصیف کان شهر أکتوبر وأوائل نوفمبر یمثلان تحدیًا بالنسبة لبیتکوین حتى الآن، حیث انخفض سعرها بنسبة 21.7% من أعلى مستوى على الإطلاق فی 6 أکتوبر عند 126304 إلى أدنى مستوى سجلته یوم أمس عند 98873. وقد صحح هذا الانخفاض بشکل فعال 100% من قوة السعر التی تراکمت منذ أدنى مستویاتها فی یونیو، وقد یرى المتداولین یراقبون علامات الاستقرار أو المزید من ضعف الأسعار. التصحیحات بهذه السرعة والحجم لیست غیر شائعة فی العملات المشفرة، وسوف یدرس المتداولون الآن ما إذا کان الانخفاض الأخیر هو تراجع محدود آخر ضمن اتجاه صعودی طویل المدى، أو علامة مبکرة على تحول أوسع فی المعنویات. ربما یمکن للصورة الفنیة أن تقدم أدلة حول موضوعات الاتجاه التالیة… مستویات الدعم المحتملة: سیستمر الکثیر فی الاعتماد على کیفیة تطور اتجاهات الأسعار المستقبلیة ولکن قد ینظر المتداولون الآن إلى الانخفاض الأخیر Bitcoin باعتباره تصحیحًا نحو منطقة دعم محتملة عند 96674/98141. تعادل هذه المنطقة تصحیح فیبوناتشی 38.2% لارتفاع أغسطس 2024 إلى أکتوبر 2025 وأدنى مستوى شهری فی یونیو 2025، مما قد یجعلها نقطة محوریة رئیسیة لعلامات الاستقرار أو المزید من المخاطر الهبوطیة. یمکن الآن مراقبة مستوى الدعم 96674/98141 band على أساس الإغلاق وتصنیفه کنقطة محوریة محتملة لنشاط السعر الحالی. على الرغم من أن هذا لا یضمن المزید من ضعف الأسعار، إلا أن الإغلاق تحت 96674 قد یشیر إلى إمکانیة حدوث ارتداد أعمق نحو 87589، وهو مستوى الارتداد بنسبة 50%، وحتى 78503، وهو مستوى یساوی المستوى الأعمق 61.8%. مستویات المقاومة المحتملة: فی حین أن الدعم 96674/98141 band یستمر فی الحد من ضعف السعر الحالی، فمن الممکن حدوث انتعاش تفاعلی، خاصة بعد الانخفاض الأخیر بنسبة 21.7٪. وقد یرکز المتداولون الآن على المستوى 105585، وهو مستوى یساوی مستوى تصحیح فیبوناتشی 38.2% من الضعف الذی حدث فی الفترة من 27 أکتوبر إلى 5 نوفمبر. إذا تم اختباره، فإن کیفیة الدفاع عن هذا المستوى على أساس الإغلاق قد تقدم أدلة حول ما إذا کان هناک المزید من قوة السعر. إذا ظهرت اختراقات إغلاق فوق 105585 فی الجلسات القادمة فإن ذلک قد یجدد محاولات الدفع نحو مستویات أعلى. إذا شوهدت مثل هذه التحرکات، فقد تفتح الاحتمالات عند 107607، وهو مستوى تصحیح 50٪، وحتى 109775، والذی یساوی مستوى 61.8٪ الأعلى. لم یتم إعداد المواد المقدمة هنا وفقًا للمتطلبات القانونیة المصممة لتعزیز استقلالیة أبحاث الاستثمار وبالتالی تعتبر بمثابة اتصالات تسویقیة. على الرغم من أنها لا تخضع لأی حظر على التعامل قبل نشر أبحاث الاستثمار، إلا أننا لن نسعى للاستفادة من أی میزة قبل تقدیمها لعملائنا. لا تقر Pepperstone أن المواد المقدمة هنا دقیقة أو حدیثة أو کاملة، وبالتالی لا ینبغی الاعتماد علیها على هذا النحو. المعلومات، سواء کانت من طرف ثالث أم لا، لا تعتبر بمثابة توصیة؛ أو عرض شراء أو بیع؛ أو التماس عرض لشراء أو بیع أی ورقة مالیة أو منتج مالی أو أداة؛ أو المشارکة فی أی استراتیجیة تداول معینة. ولا یأخذ فی الاعتبار الوضع المالی للقراء أو الأهداف الاستثماریة. ننصح أی قراء لهذا المحتوى بطلب المشورة الخاصة بهم. بدون موافقة Pepperstone، لا یُسمح بإعادة إنتاج أو إعادة توزیع هذه المعلومات.
Pepperstone
خبرهای خوب بازار سهام آمریکا تمام شده است؟ تحلیل US 500
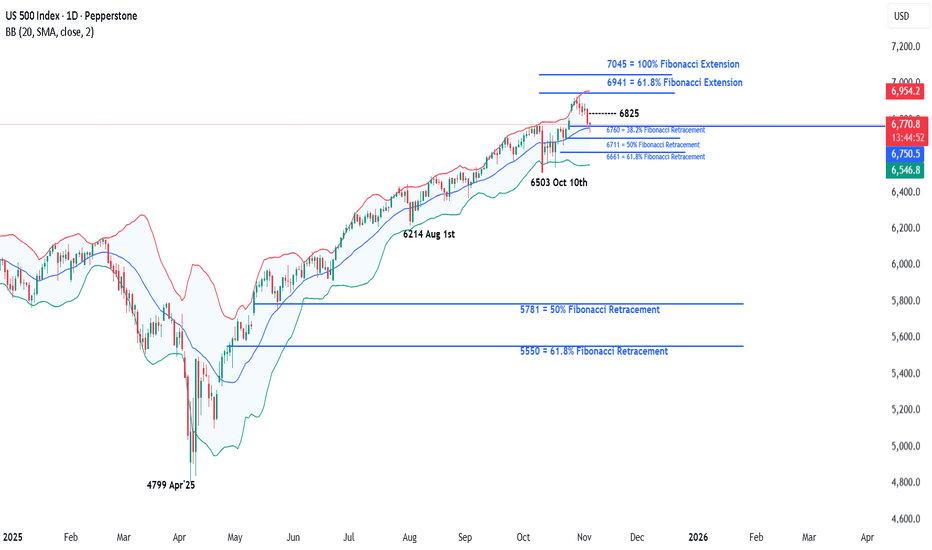
Concerns about excessive stock market valuations, especially when talking about AI focused companies, isn’t something new. In fact, it has been an on-going theme over the last 6 months of the year leading to bouts of risk aversion. This was again the case late on Monday evening, and throughout the day yesterday when the earnings of Palantir Technologies were in the spotlight. The strange thing was that the earnings from this company, released after the close on Monday, beat analysts’ expectations, however a lack of clarity on future revenue needed to justify a market capitalisation of over $600 billion was what brought the latest concerns of an AI bubble back to the attention of traders, leading to a negative sentiment shift for the wider sector and the US 500 index in general. Now, this may or may not be the start of a wider correction and much will depend on future risk events, price action and technical trends (more on this below), however the question for traders this time around is whether the positive news flow for US indices in the short term has already been priced? After all the US 500 index only hit a new record of 6925 on October 30th, 5 days ago. November and December are historically strong performance months for the US 500, however currently traders are faced with several issues to navigate. Only a week ago the Federal Reserve cast some doubt over whether a rate cut in December would happen or not, with policymakers maintaining this stance in their comments at various events since then. This wasn’t expected and has led to some disappointment for traders which weighed on US 500 sentiment. Q3 earnings have generally beaten expectations but then valuations were already high to reflect this, leading to some potential fatigue. Trade tensions between the US-China have cooled, but concerns still remain about economic growth in both countries, especially in the US, where a US government shutdown has led to the delay of key data releases such as CPI, retail sales and the all-important Non-farm Payrolls update on the current health of the US labour market, a key factor influencing the decision making of the Fed on potential interest rate cuts. This means the release of today’s US ADP Private Payrolls data at 1315 GMT and the US ISM Services PMI survey at 1500 GMT could have a bigger influence over the direction of the US 500 moving across the week. Technical levels and trends may also become increasingly important. Technical Update: Back to Fibonacci Retracement Support After reaching a new all-time high of 6925 on October 30th, the US 500 index has corrected by 2.9%, easing short-term overextended upside conditions. This pullback may reflect a healthy pause within a broader uptrend, but the question now appears to be whether this marks the extent of corrective downside moves or is the beginning of a phase of further price weakness. As the chart below shows, latest declines in the US 500 index have now returned to a potential support zone at 6750/6760, marking the 38.2% Fibonacci retracement of the October 10th to 30th rally and the current level of the Bollinger mid-average. This possible support band may limit current declines, but closing behaviour around this area could be important in determining whether buyers can regain the upper hand or if deeper corrective risks can emerge. Traders could now be watching this 6750/6760 support closely, as closing break below might see increased downside pressure. Such moves could then mean focus shifts to 6711, even 6661, marking the deeper 50% and 61.8% Fibonacci retracement levels. That said, while the support is currently under pressure, the 6750/6760 range still holds on a closing basis and may help limit further selling pressure, even possibly see renewed attempts at price upside. However, traders may also now be monitoring 6825, equal to half the recent price decline, as a resistance level in the sessions ahead. If momentum is to shift back toward attempts to renew price strength, a closing break above 6825 may be required to suggest scope to retest the 6925 October 30th all-time high. The material provided here has not been prepared accordance with legal requirements designed to promote the independence of investment research and as such is considered to be a marketing communication. Whilst it is not subject to any prohibition on dealing ahead of the dissemination of investment research, we will not seek to take any advantage before providing it to our clients. Pepperstone doesn’t represent that the material provided here is accurate, current or complete, and therefore shouldn’t be relied upon as such. The information, whether from a third party or not, isn’t to be considered as a recommendation; or an offer to buy or sell; or the solicitation of an offer to buy or sell any security, financial product or instrument; or to participate in any particular trading strategy. It does not take into account readers’ financial situation or investment objectives. We advise any readers of this content to seek their own advice. Without the approval of Pepperstone, reproduction or redistribution of this information isn’t permitted.
Pepperstone
طلا در آستانه ۴۰۰۰ دلار: مسیر بعدی صعود یا سقوط؟ (تحلیل تکنیکال)
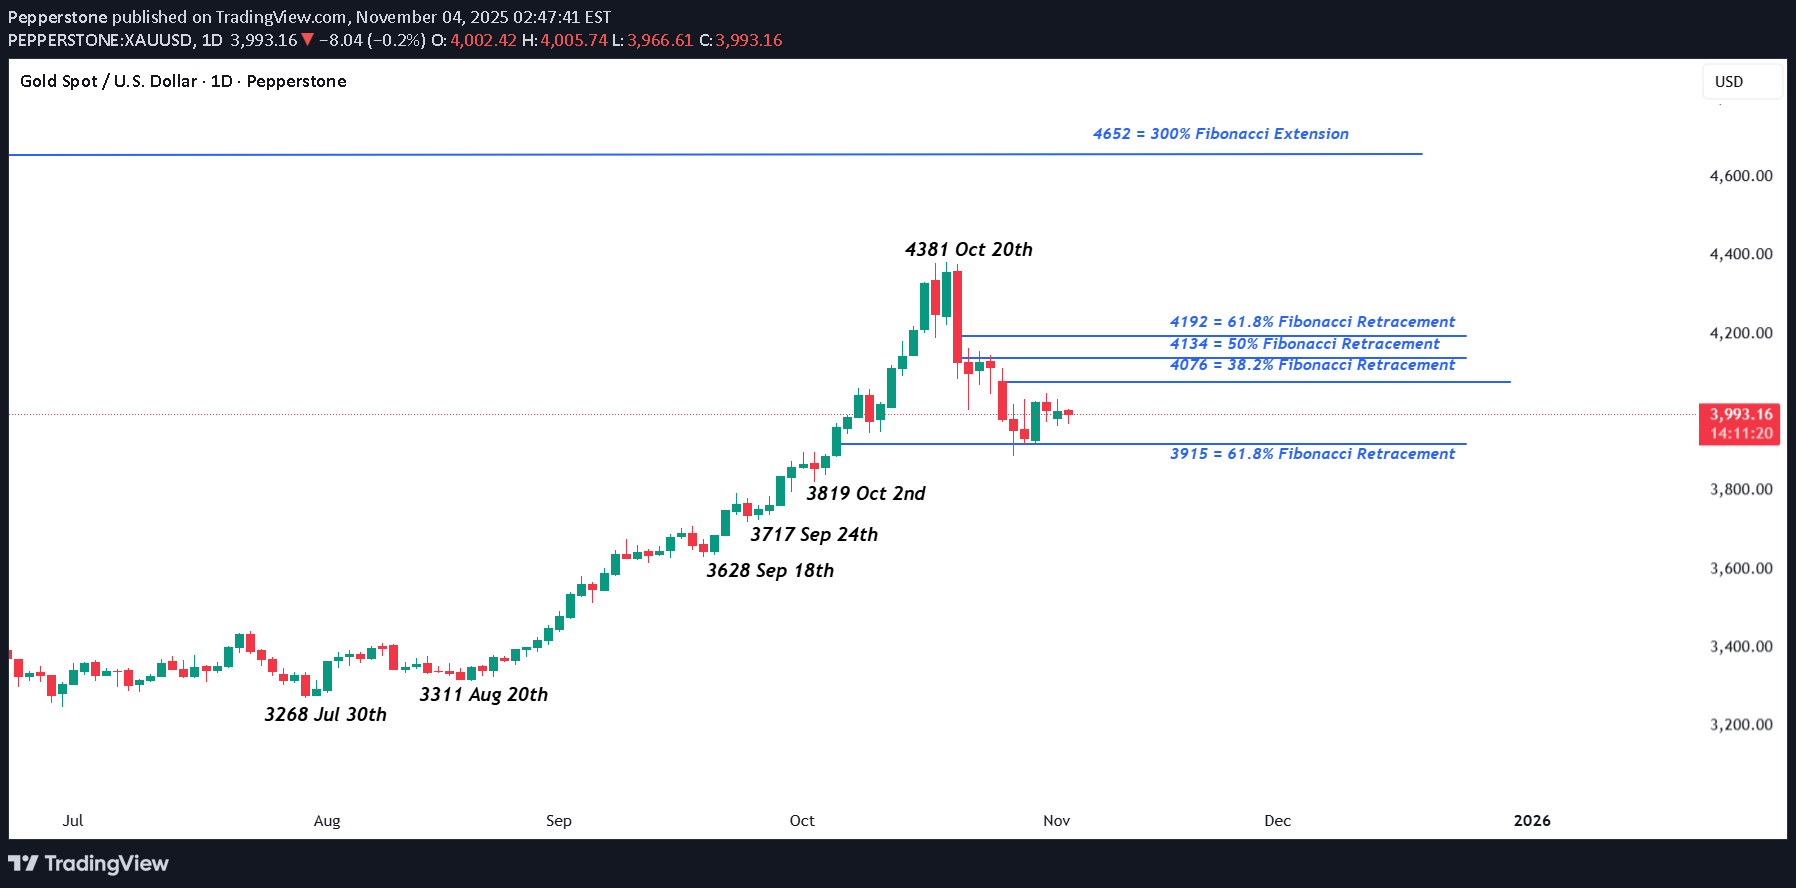
ربما تکون أسعار الذهب قد استقرت بعد تصحیحها الحاد من أعلى مستوى لها على الإطلاق عند 4381 یوم 20 أکتوبر إلى أدنى مستوى عند 3887 یوم 28 أکتوبر، إلا أن المتداولین ما زالوا یتحملون الندوب الناجمة عن ذلک move المفرط والمتقلب الذی ترک metal الشهیر یرقص فی نطاق 3٪ على جانبی 4000. أصبح الحکم على الاتجاه التالی لأسعار الذهب أقل من 2 أمرًا أکثر صعوبة مع محاولة صناع السیاسة فی بنک الاحتیاطی الفیدرالی تهدئة توقعات السوق بشأن المزید من التخفیض فی سعر الفائدة فی اجتماعهم القادم فی دیسمبر. کقاعدة عامة، یمکن أن تساعد أسعار الفائدة المنخفضة فی دعم أسعار الذهب لأنه أصل لا یدر عائدًا. لیس هذا فحسب، بل أدت هذه التوقعات المتغیرة من بنک الاحتیاطی الفیدرالی أیضًا إلى ارتفاع الدولار الأمریکی move إلى أعلى مستوى له منذ 3 أشهر، مما أثر بشکل أکبر على أسعار الذهب، لأنه یجعل أصل الملاذ الآمن safe، والذی یتم تسعیره بالدولار، أکثر تکلفة للمستثمرین العالمیین. ومع ذلک، فإن العدید من الدوافع التی جذبت المتداولین لإضافة الذهب إلى محافظهم الاستثماریة لا تزال قائمة، مثل المخاطر الجیوسیاسیة فی أوکرانیا، ومخاطر الائتمان وعدم الیقین بشأن اتجاه النمو الاقتصادی العالمی. فی هذا النوع من البیئة، یمکن أن یکون الاهتمام بالتوقعات الفنیة بنفس أهمیة البقاء على تقییم المخاطر الرئیسیة الکلیة. التحدیث الفنی: هل یشیر الرقم 3915 إلى مدى التحرکات التصحیحیة؟ قام الذهب بتصحیح ما یزید عن 11.25% من أعلى مستوى له على الإطلاق فی 20 أکتوبر إلى أدنى مستوى خلال جلسة 28 أکتوبر یوم الثلاثاء الماضی، مما أدى إلى تفکیک الظروف الصعودیة المحتملة المفرطة فی التوسع والتی نشأت خلال تقدم الأسعار الحاد فی الفترة من 20 أغسطس إلى 20 أکتوبر. المعضلة الرئیسیة التی یواجهها المتداولون الآن هی ما إذا کان الضعف الأخیر یمثل تصحیحًا صحیًا للسوق أو یشیر إلى تحول أعمق فی المعنویات. إذا کان الأمر کذلک، فیمکننا أن نرى اهتمامًا متجددًا بالشراء واستئناف الاتجاه الصعودی الأوسع. ومع ذلک، إذا کان الأمر الأخیر، فقد تؤدی المخاطر إلى مرحلة أخرى من ضعف الأسعار. فی حین أن الاتجاه التالی للذهب لا یزال غیر مؤکد، فإن التحلیل الفنی یمکن أن یقدم أدلة محتملة. من خلال تحدید مستویات الدعم والمقاومة الرئیسیة، یمکن للمتداولین توقع أین قد تظهر مخاطر الاتجاه، خاصة إذا اخترقت تلک المستویات على أساس الإغلاق. قد یشیر اختراق الدعم إلى خطر تصحیحی أعمق، فی حین أن الإغلاق فوق المقاومة قد یستأنف الزخم الإیجابی. مستویات المقاومة المحتملة: یبدو أن تراجع الذهب بنسبة 11.25% من أعلى مستوى سجله فی 20 أکتوبر قد وجد الدعم عند 3915، وهو مستوى تصحیح فیبوناتشی 61.8% للتقدم الذی سجله فی الفترة من 18 سبتمبر إلى 20 أکتوبر. استقرت حرکة السعر منذ ذلک الحین حول هذا المستوى، مما یشیر إلى احتمالیة محاولات تجدید الاتجاه الصعودی. قد یحول المتداولون الآن ترکیزهم إلى مستویات المقاومة الرئیسیة، مع ضرورة وجود فواصل إغلاق فوق تلک المستویات للإشارة إلى مزید من قوة السعر. مع تطور الاتجاه الصعودی بعد الاختبارات لمستوى الدعم 3915، یمکن للمتداولین الآن مراقبة المستوى 4076، وهو تصحیح فیبوناتشی 38.2% لضعف الأسعار فی أکتوبر. قد یؤدی اختراق الإغلاق الناجح فوق 4076 إلى اختبار مستوى 4134، وهو مستوى 50%، وحتى 4192، وهو مستوى ارتداد 61.8% الأعلى. مستویات الدعم المحتملة: کما هو مقترح أعلاه، مع استمرار المرحلة الأخیرة من ضعف الأسعار عند مستویات تصحیح 3915، فمن المرجح أن یراقب المتداولون هذا باعتباره أول دعم محتمل. قد یکون الإغلاق تحت هذا المستوى حافزًا لاستمرار انخفاض الأسعار. ورغم أن مثل هذه التحرکات لا تضمن حدوث مزید من الضعف فی الأسعار، إلا أنها قد تفتح اختبارات للمستوى 3819، وهو أدنى مستوى لیوم 2 أکتوبر/تشرین الأول، وحتى 3717، وهو الحد الأقصى للجانب السلبی لیوم 24 سبتمبر/أیلول. لم یتم إعداد المواد المقدمة هنا وفقًا للمتطلبات القانونیة المصممة لتعزیز استقلالیة أبحاث الاستثمار وبالتالی تعتبر بمثابة اتصالات تسویقیة. على الرغم من أنها لا تخضع لأی حظر على التعامل قبل نشر أبحاث الاستثمار، إلا أننا لن نسعى للاستفادة من أی میزة قبل تقدیمها لعملائنا. لا تقر Pepperstone أن المواد المقدمة هنا دقیقة أو حدیثة أو کاملة، وبالتالی لا ینبغی الاعتماد علیها على هذا النحو. المعلومات، سواء کانت من طرف ثالث أم لا، لا تعتبر بمثابة توصیة؛ أو عرض شراء أو بیع؛ أو التماس عرض لشراء أو بیع أی ورقة مالیة أو منتج مالی أو أداة؛ أو المشارکة فی أی استراتیجیة تداول معینة. ولا یأخذ فی الاعتبار الوضع المالی للقراء أو الأهداف الاستثماریة. ننصح أی قراء لهذا المحتوى بطلب المشورة الخاصة بهم. بدون موافقة Pepperstone، لا یُسمح بإعادة إنتاج أو إعادة توزیع هذه المعلومات.
Pepperstone
انفجار ارزش انویدیا به ۵ تریلیون دلار: جهش تاریخی و مسیر بعدی سهام غول هوش مصنوعی
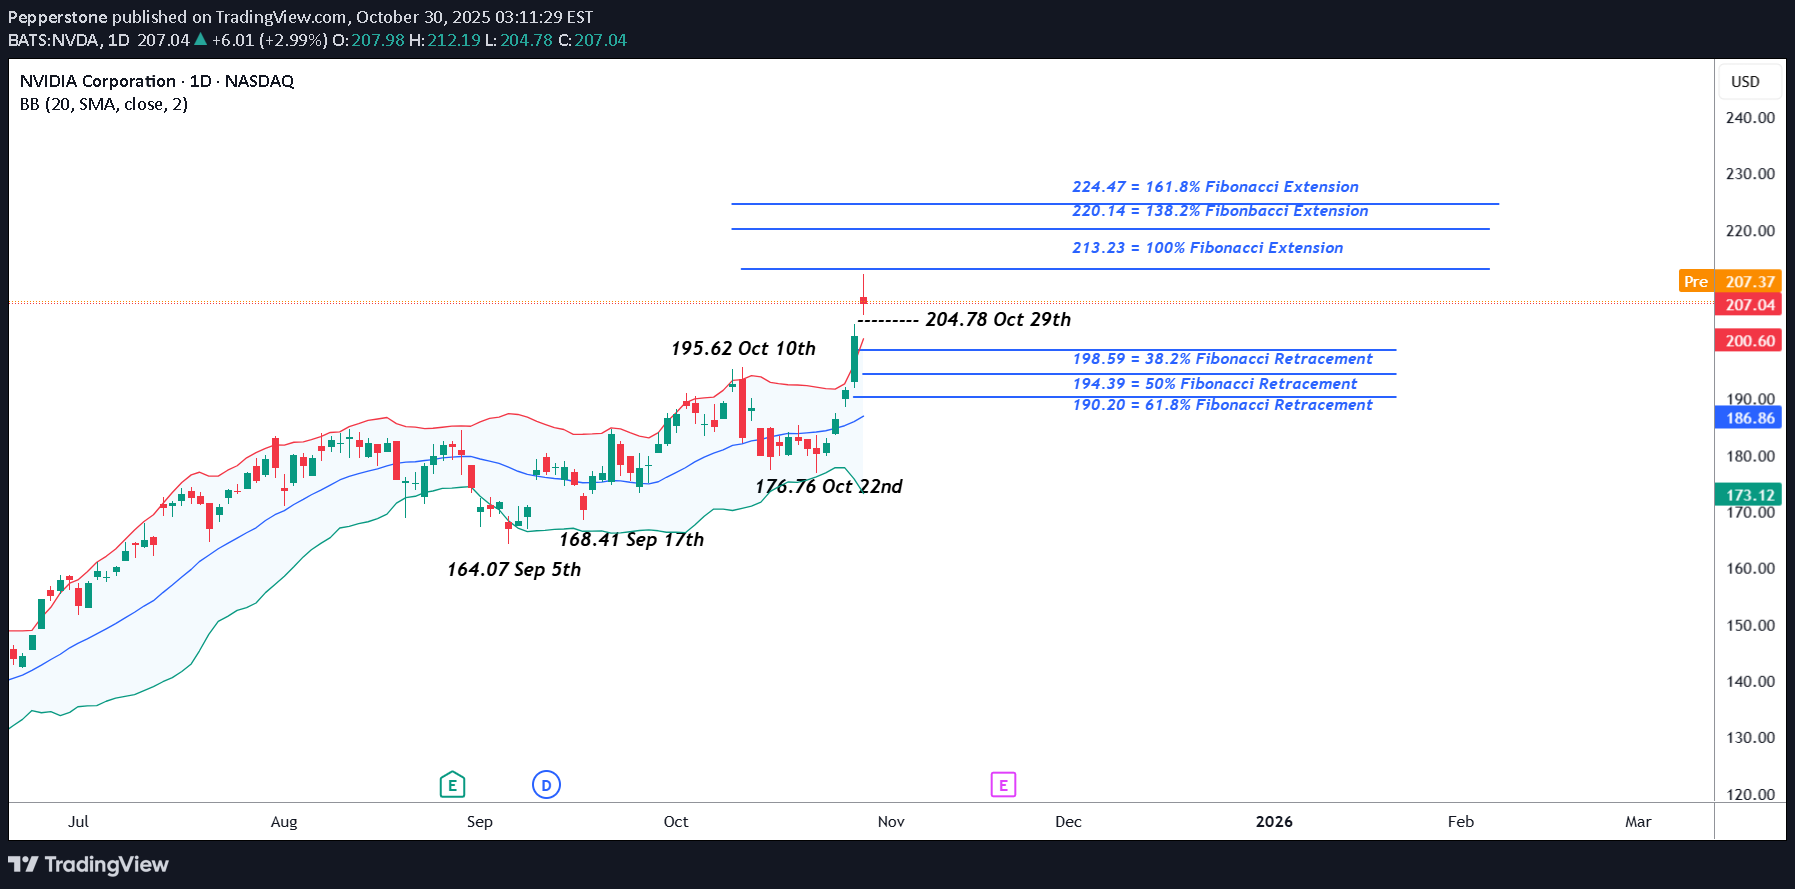
بعد 24 ساعة فقط من أن أصبحت شرکة Apple ثالث شرکة فی التاریخ تصل قیمتها السوقیة إلى 4 تریلیون دولار، وضعت NVIDIA معیارًا جدیدًا لتصبح أول شرکة على الإطلاق تسجل قیمة سوقیة تبلغ 5 تریلیون دولار. على الرغم من المخاوف بشأن التقییمات الممتدة، کانت الأخبار flow الخاصة بـ NVIDIA إیجابیة فی البدایة لبدء هذا الأسبوع الجدید حیث تحاول الشرکة ترسیخ مستقبلها فی مرکز الثورة AI المحتملة. کشف الرئیس التنفیذی جنسن هوانغ أن الشرکة تلقت طلبیات بقیمة 500 ملیار دولار من شرائح AI، بما فی ذلک عقود لبناء أجهزة کمبیوتر فائقة السرعة للحکومة الأمریکیة، وعلق الرئیس Trump یوم الأربعاء بأن أحدث شرائح بلاکویل من NVIDIA یمکن أن تکون نقطة نقاش عندما یجتمع مع الرئیس شی فی قمة یوم الخمیس فی کوریا الجنوبیة. ولتوضیح ذلک بالأرقام، بعد افتتاحه یوم الاثنین عند 189.25، ارتفع السهم بنسبة 12% خلال أول 3 أیام تداول لیصل إلى مستوى مرتفع عند 212.19 یوم الأربعاء. أدى ذلک move إلى ارتفاع نسبة الارتفاع منذ بدایة العام حتى الآن إلى 54%، وهو أمر مثیر للإعجاب حقًا! على الرغم من ذلک، یجب القول أن الأسعار تراجعت لتغلق الیوم عند 207.04. ومع ذلک، ربما تکون المعنویات الإیجابیة قد توقفت قلیلاً بین عشیة وضحاها، حیث قام بنک الاحتیاطی الفیدرالی بتخفیض أسعار الفائدة بمقدار 25 نقطة أساس کما کان متوقعًا، لکن الرئیس باول قدم توقعات أکثر حذرًا بشأن التخفیضات المستقبلیة مما کان متوقعًا. کما أن أرباح Alphabet وMicrosoft وMeta التی صدرت فی وقت متأخر من یوم الأربعاء کانت مختلطة، مع أرباح قویة یقابلها ارتفاع التکالیف. وبالتطلع إلى المستقبل، بدأت التحدیثات الأولیة من اجتماع الرئیس Trump والرئیس شی فی الوصول إلى وکالات الأنباء وسیحرص المتداولون على تقییم التفاصیل الفعلیة لما تمت مناقشته حول مبیعات شرائح NVIDIA بین البلدین. قد یکون أحد الجوانب الحاسمة هو ما إذا تمت مناقشة مبیعات أحدث شرائح Blackwell من NVIDIA، وإذا لم یکن الأمر کذلک، فما هی الأسباب. بعد ذلک، نترقب صدور أرباح أمازون وأبل بعد إغلاق اللیلة، مما قد یؤکد التحرکات الصعودیة الأخیرة أو یلقی کرة منحنى المعنویات التی قد تؤثر سلبًا على تحدید المراکز فی عطلة نهایة الأسبوع. التحدیث الفنی: التسارع العالی یحول الترکیز إلى مقاومة الامتداد فی ست جلسات تداول فقط، ارتفع سعر سهم NVIDIA بما یزید عن 20%، لیصل إلى أعلى مستویاته على الإطلاق. یمکن لمثل هذا التسارع السریع أن یشیر فی کثیر من الأحیان إلى زخم قوی ولکنه یزید أیضًا من خطر الإرهاق الصعودی على المدى القصیر، على الرغم من أنه من الصعب تحدید المکان الذی قد تتباطأ فیه مثل هذه التحرکات أو حتى رؤیة مخاطر الانعکاس المحتمل. فی هذه البیئة، قد یقوم المتداولون بمراقبة مستویات الدعم والمقاومة، حیث تشیر مناطق المقاومة إلى إمکانیة جنی الأرباح، فی حین أن الکسر تحت الدعم قد یؤدی إلى مزید من ضعف الأسعار. [ب مستویات المقاومة المحتملة: مع دخول حرکة السعر إلى منطقة مجهولة مع أعلى مستویاتها على الإطلاق، یصبح تحدید المقاومة تحدیًا. ومع ذلک، غالبًا ما یلجأ المتداولون إلى مستویات امتداد فیبوناتشی، المستمدة من التصحیح الأخیر، لتسلیط الضوء على المناطق المحتملة التی قد یتباطأ فیها الزخم الصعودی أو حتى ینعکس. کما یظهر الرسم البیانی أعلاه، بالنسبة لـ NVIDIA، تطور هذا التصحیح الأخیر بین 10 أکتوبر و 22 أکتوبر ویبدو أن القوة الأخیرة تتعثر على المدى القصیر قبل 213.23، وهو مستوى یساوی امتداد فیبوناتشی 100٪. لیس هناک ما یضمن نجاح مستویات التمدید هذه فی الحد من قوة السعر، کما أن اختراقات الإغلاق فوق مستوى المقاومة 213.23 قد تحول الترکیز إلى 220.14، وهو مستوى التمدید الأعلى بنسبة 138.2%. مستویات الدعم المحتملة: وللحفاظ على قوة سعر NVIDIA الحالیة، قد یرکز المتداولون الآن على أدنى مستوى لیوم الأربعاء عند 204.78 کدعم على المدى القریب؛ إذا اختبر ضعف السعر هذا المستوى، فسیتم مراقبة دفاعه، حیث أن کسر الإغلاق تحت 204.78 قد یؤدی إلى مزید من الضغط الهبوطی. الإغلاق تحت 204.78 قد یؤدی إلى اختبار 198.59، وهو تصحیح فیبوناتشی 38.2% للارتفاع الذی حدث فی الفترة من 22 إلى 29 أکتوبر، ولکن إذا انهار هذا الدعم، فقد تمتد المخاطر نحو 194.39، وهو مستوى تصحیح أعمق بنسبة 50%. لم یتم إعداد المواد المقدمة هنا وفقًا للمتطلبات القانونیة المصممة لتعزیز استقلالیة أبحاث الاستثمار وبالتالی تعتبر بمثابة اتصالات تسویقیة. على الرغم من أنها لا تخضع لأی حظر على التعامل قبل نشر أبحاث الاستثمار، إلا أننا لن نسعى للاستفادة من أی میزة قبل تقدیمها لعملائنا. لا تقر Pepperstone أن المواد المقدمة هنا دقیقة أو حدیثة أو کاملة، وبالتالی لا ینبغی الاعتماد علیها على هذا النحو. المعلومات، سواء کانت من طرف ثالث أم لا، لا تعتبر بمثابة توصیة؛ أو عرض شراء أو بیع؛ أو التماس عرض لشراء أو بیع أی ورقة مالیة أو منتج مالی أو أداة؛ أو المشارکة فی أی استراتیجیة تداول معینة. ولا یأخذ فی الاعتبار الوضع المالی للقراء أو الأهداف الاستثماریة. ننصح أی قراء لهذا المحتوى بطلب المشورة الخاصة بهم. بدون موافقة Pepperstone، لا یُسمح بإعادة إنتاج أو إعادة توزیع هذه المعلومات.
إخلاء المسؤولية
أي محتوى ومواد مدرجة في موقع Sahmeto وقنوات الاتصال الرسمية هي عبارة عن تجميع للآراء والتحليلات الشخصية وغير ملزمة. لا تشكل أي توصية للشراء أو البيع أو الدخول أو الخروج من سوق الأوراق المالية وسوق العملات المشفرة. كما أن جميع الأخبار والتحليلات المدرجة في الموقع والقنوات هي مجرد معلومات منشورة من مصادر رسمية وغير رسمية محلية وأجنبية، ومن الواضح أن مستخدمي المحتوى المذكور مسؤولون عن متابعة وضمان أصالة ودقة المواد. لذلك، مع إخلاء المسؤولية، يُعلن أن المسؤولية عن أي اتخاذ قرار وإجراء وأي ربح وخسارة محتملة في سوق رأس المال وسوق العملات المشفرة تقع على عاتق المتداول.