
GDuBFX
@t_GDuBFX

ما هو الشيء الذي ننصحك بشراءه من المواد الغذائية؟
سابق في الشراء
پیام های تریدر
مرشح
GDuBFX
Sorry Bitcoin Bears, but the downwards trend has finished
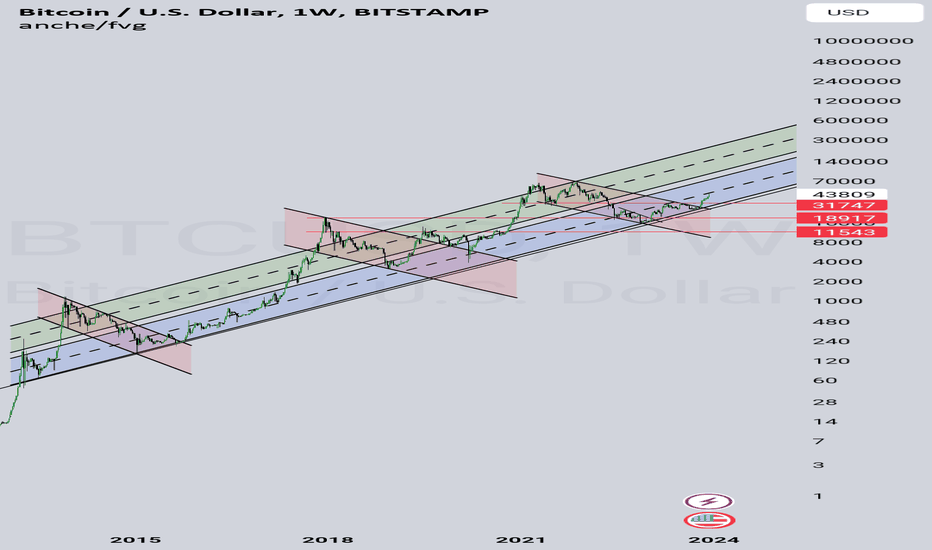
إذا نظرنا إلى الرسم البياني التاريخي طويل المدى، يمكنك أن ترى بوضوح أن لديه اتجاه صعودي طويل المدى مع فترات من التصحيحات في قناة هبوطية 3 مرات. لقد حددت على الرسم البياني الخاص بي النطاقين السفلي والعلوي للاتجاه الصعودي وكذلك التصحيحات الهبوطية. من الواضح مع مرور الوقت أن الاتجاه الصعودي طويل المدى مستمر، وقد اخترق التصحيح الهبوطي الأخير واخترق فوق المفتاح مستويات الدعم/المقاومة. إذا كنت لا توافق على هذا المخطط، فأنا أحب أن أسمع أفكارك. سأشارك أيضًا الإصدارات المكبرة من هذا المخطط في التعليقات. تعليق: تعليق: تعليق: أضف أنماط التراكم وإعادة التراكم Wyckoff التي يمكن رؤيتها على الرسم البياني اليومي:
GDuBFX
Sorry Bitcoin Bears, but the downwards trend has finished
إذا نظرنا إلى الرسم البياني التاريخي طويل المدى، يمكنك أن ترى بوضوح أن لديه اتجاه صعودي طويل المدى مع فترات من التصحيحات في قناة هبوطية 3 مرات. لقد حددت على الرسم البياني الخاص بي النطاقين السفلي والعلوي للاتجاه الصعودي وكذلك التصحيحات الهبوطية. من الواضح مع مرور الوقت أن الاتجاه الصعودي طويل المدى مستمر، وقد اخترق التصحيح الهبوطي الأخير واخترق فوق المفتاح مستويات الدعم/المقاومة. إذا كنت لا توافق على هذا المخطط، فأنا أحب أن أسمع أفكارك. سأشارك أيضًا الإصدارات المكبرة من هذا المخطط في التعليقات. تعليق: تعليق: تعليق: قم بإضافة نماذج ويكوف للتراكم وإعادة التراكم التي يمكن رؤيتها على الرسم البياني اليومي:تعليق: من أجل الشفافية وإظهار أنني كان لدي نفس الرأي لبعض الوقت ولإظهار نتائج التحليل السابق وليس مجرد وضعها على الرسم البياني بعد فوات الأوان، إليك بعض التحليلات التي نشرتها في 9 سبتمبر متوقعًا "الربيع" و"الربيع" مرحلة "القفز عبر الخور" من نمط إعادة التراكم.. قبل أن يحدث.تعليق: أضف إليوت Waves إلى المزيج:Comment:Comment:Comment: أتوقع أن تنتهي هذه الموجة الحالية حول مستوى 45 ألف دولار كما هو موضح في الرسم البياني أدناه.... وهو ما سيكمل تصحيح ABC الأرجواني والموجة الزرقاء 1 (كما هو موضح في الرسم البياني لموجة إليوت الأولى أعلاه). سيؤدي هذا بعد ذلك إلى موجة تصحيحية 2، والتي أتوقع أنها لن تأتي تحت المستوى 31 ألف المنطقة وذلك عندما تبدأ الكميات الحقيقية في الارتفاع وتبدأ مرحلة العلامات بالفعل... تتراوح توقعات الأسعار المبكرة لقمة السوق بين 205 و230 ألف دولار أمريكي.... كم من الوقت قد يستغرق ذلك وما هو العام/الشهر الذي قد يأتي ليس جزءًا من تحليلي... أنا فقط أركب الاتجاه مهما طال الوقت الذي قد يستغرقه ذلك. يعد هذا أيضًا تخمينًا تمامًا في الوقت الحالي وستكون هناك حاجة إلى مزيد من التحديثات مع تطور السوق.
GDuBFX
Re-accumaltion or distribution? Both have similar shape / Patter

فقط الوقت سیحدد ما إذا کان هذا هو التوزیع أو إعادة التراکم. أعتقد أنه الأخیر شخصیا
GDuBFX
Bitcoin Weekly RSI broken up from falling wedge

کما ترون على مخططی الأسبوعی ، انفصل مؤشر القوة النسبیة الأسبوعیة من نمط إسفین المتساقط الذی یعکس إسفین هو على حرکة السعر. هل هذه علامة على ما الذی سیحدث فی حرکة السعر؟ بالتأکید أعتقد ذلک! إذا کنت تتابع مشارکاتی السابقة ، فقد ظلت صعوبة منذ أوائل یونیو ، على الرغم من کل الأخبار / الأساسیات السلبیة مثل "الرکود سوف یعطل جمیع الأصول ، والجمیع ینقلون أموالهم إلى الدولار الأمریکی لأنها تحتفظ بالعملة العالمیة". القیمة "وفی مکان ما الذی سیستخدمه المستثمرون کملاذ safe فی أسواق الدب؟ لماذا لم یعود هذا إلى الظهور ولماذا غیرت الضوضاء الآن موقفهم؟ فقط للإضافة إلى هذا ، فإن الخط الأفقی red هو السعر الوثیق الأسبوعی من ارتفاع 2017/2018. بالإضافة إلى ذلک ، قامت RSI الأسبوعیة بإعادة اختبار خط الاتجاه الهبوطی للأضداد وأیضًا مؤشرات مؤتمر الإسلامی للوصول إلى المتوسط حیث وجد الدعم والتراجع. لقد وجد السعر دعمًا على السعر الوثیق الأسبوعی لأعلى 2017/2018. فی حالة أنک تتساءل عن خطوط الاتجاه الصعودیة ، فهی قناة فیبوناتشی رسمت على مخططی من أدنى مستوى فی أبریل 2013 وأدنى مستوى من أغسطس 2015. الاتجاه الثور طویل الأجل والبحث عن السراویل القصیرة هنا هو ما یسمونه "fomo". کما قال وارن بوفیت ذات مرة "من الحکمة أن یکون المستثمرون خائفین عندما یکون الآخرون جشعین ، والجشع عندما یخاف الآخرون". RSI مقابل إجراء السعر (کما هو موضح فی الخطوط الزرقاء على الرسم البیانی أدناه).
GDuBFX
BTC bottom, bull run starting

لقد مر بعض الوقت منذ آخر مرة ، لأن فکرة Wyckoff التی اقترحتها على المدة الأقصر قد تم إبطالها. لقد أغلقت ربحتی الطویلة ، حیث اندلعت مما یبدو أنه کان نمطًا قطریًا رائدًا (الذی کنت أراقبنی علیه). ونتیجة لذلک ، کنت أعید التحدید وأحاول أن أؤکد وجهة نظری على Elliot waves. الرسم البیانی: هناک اتجاه صعودی طویل الأمد على الرسم البیانی اللوغاریتمی ، الذی تم إنشاؤه منذ حوالی مارس/أبریل 2013. السعر فی أسفل "نمط الرایة الصعودی" على الرسم البیانی ، الذی کان سابقًا هو الشکل الذی کان ما تشکله أی تصحیحات سابقة والسعر الآن فی الجزء السفلی من الاتجاه الطویل. إنه یرتد الآن من خط الاتجاه مع "نمط الشموع الصباحی" الصعودی کما هو موضح فی المخططات أدناه: السعر أیضًا على المستوى السابق ATH من 2017/2018 وأیضًا مستوى تمدید Fibonacci 161.8 ٪ لنمط التصحیح. هذا یثبت أنه مجال دعم قوی ومنطقة التقاء بالإضافة إلى الاتجاه طویل الأجل. بالإضافة إلى ذلک ، فإن RSI الأسبوعی یتمتع بدوره فی العمل ، وهو الآن یرتفع من المتوسط المتحرک فی مؤتمر إدارة الأعمال ، مما یدل على أن هناک Momemtum الصعودیة. لقد کان هذا سابقًا المحفز فی سباق الثور التالی کلما کان مؤشر القوة النسبیة فی هذا الموقف فی التاریخ بأکمله bitcoin: حیث التالی لـ bitcoin؟ أعتقد أن السعر قد انخفض فی 18 یونیو بحوالی 17592 دولارًا ، حیث أن السعر قد شکل الآن النمط القطری الرئیسی الذی ذکرته سابقًا. بعد ذلک ، عادة ما یکون هناک انهیار للنمط ، والذی یتشکل من الموجة 1 و 2 من بدء الاتجاه الصعودی الجدید من بین خط الاتجاه القصیر الجدید على المدى القصیر الذی تم تعیینه من الاختراق الفاشل (الذی یتمیز به "الموجة 1" السوداء على الرسم البیانی الیومی). أعتقد أن هذه الموجة 3 ستستمر الآن حتى مستوى تمدید FIB 161.8 ٪ ، ستستمر الموجة الخامسة إلى حوالی 61.8 ٪ من مستوى Racked حوالی 29،000 دولار تقریبًا (تقرب ما یقرب من حوالی 29،000 دولار تقریبًا (تقرب ما یقرب من المبلغ تقریبًا من المبلغ العدد من حوالی 41 ألف 17،900 دولار). أعتقد أن هذا سیکمل بعد ذلک نهایة "الموجة 1" الأساسیة على المدى الطویل ، وأعتقد أن الأهداف طویلة الأجل لا تزال تصل إلى 100000 دولار - 160،000 دولار مستویات ذکرت فی الأفکار المنشورة سابقًا (وهو ما یتعلق ببدیلة فی هذا الأمر). سیناریو إلى الصعودیة. یبدو السعر حالیًا فی الطریق ، ولکن إذا تم إیقاف ذلک من قمة إسفین المتساقط ویجعل "الموجة 4" من 5 waves لأسفل ، فإنه یمکن بعد ذلک أن یرى هذا "الموجة" من تصحیح "ABC" ، الذی ینهار من الاتجاه الصادر على المدى الطویل ، ویمکننا أن نرى هذا التصحیح الذی یتجاوزنا حوالی 3،000 دولار - $ 6،500. تفضل دائمًا التداول مع الاتجاه وحتى یتم کسره ، فلن أبحث عن مواقف هبوطیة
GDuBFX
BTC 4H Wyckoff Accumulation update
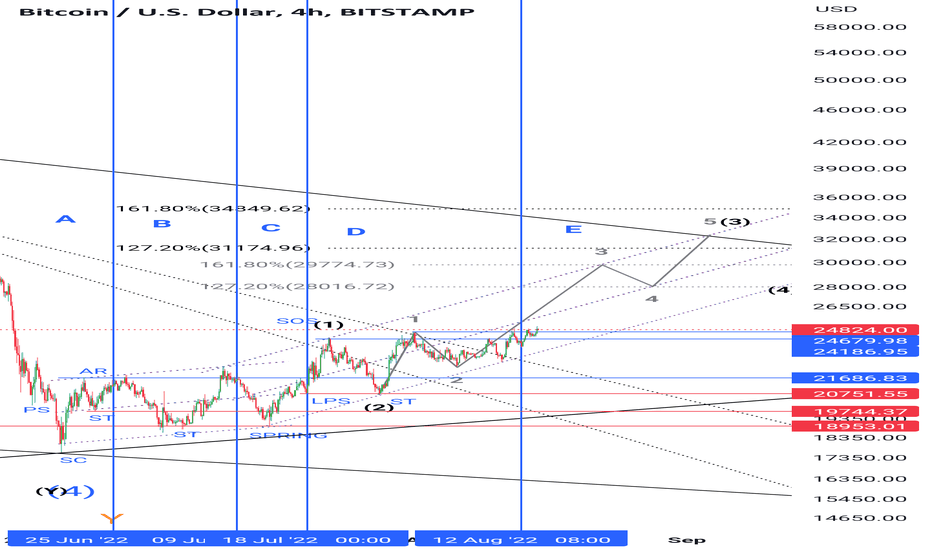
تجار صباح الخیر ، بعد تحلیلی السابق ، قمت بتحدیث الرسم البیانی الخاص بی لإظهار أفکاری حول ما یحدث. متابعة مرحلة "علامة القوة (SOS)" ، لقد رأینا إعادة اختبار "المرکز الأخیر من المرحلة (LPS) ، وقد رأیت الآن أن نمط / استمرار نموذجی تتوقعه متابعة" SOS "، حیث یتقارب السعر قبل أن یخرج. "LPS" ، لکننا بدأنا الآن فی الخروج من الجزء العلوی من النطاق وأتوقع أن یزداد وحدات التخزین المجلدات ، وربما غدًا عندما یعید السوق افتتاح المتداولین المؤسسیین الکبار. / خطوط الاتجاه الإسفین ، یخترق الخط من خلال العمل / الشمعدان. تداول! GDUBMY فشلت فکرة Wyckoff ، لکن مشاعری الصعودیة على المدى الطویل لا تزال نشطة ، کانت فکرة Wyckoff تسیر حتى أن النمط القطری الرائد (الذی کنت قد رصدته أیضًا ، لکن لم أکن قد استقلت الآن ، إلا أنه لم یکن الأمر کذلک. الأسباب 1 هی أنه أصبح الآن hit أعلى مستوى فی عام 2017/2018 مرة أخرى ، وأیضًا خط الاتجاه الصعودی على المدى الطویل وارتداده أیضًا.
GDuBFX
If you're bearish on Bitcoin, take a look at this!
یقترح الکثیر من الناس bitcoin إلى 13 ألفًا ، 10 کیلو ، إلخ ... ولکن عندما نکون فی اتجاه صعودی طویل الأجل ، فی نمط استمرار (سقوط إسفین) على مخطط السجل ، لم ینهار السعر بعد من خط الاتجاه الطویل على المدى الطویل ، إلى جانب القناة القویة بما فیه الکفایة؟
GDuBFX
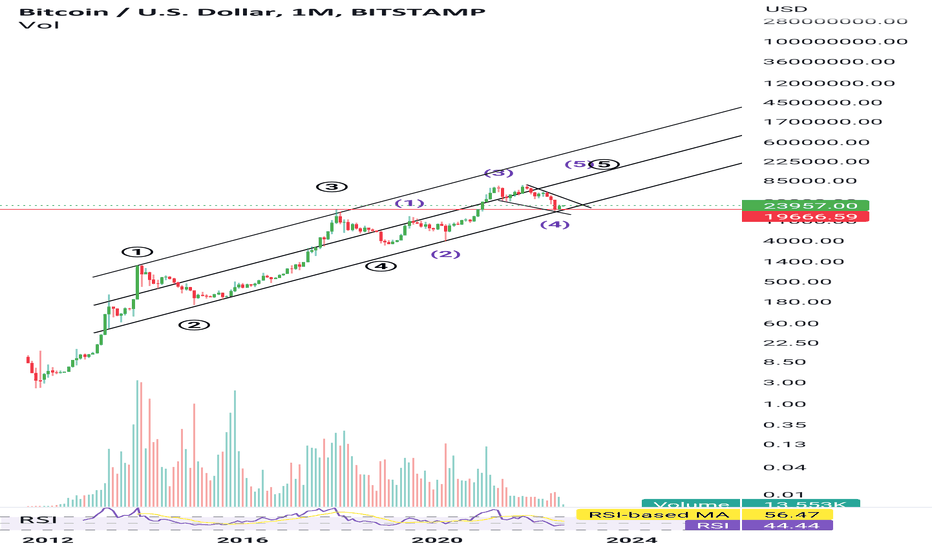
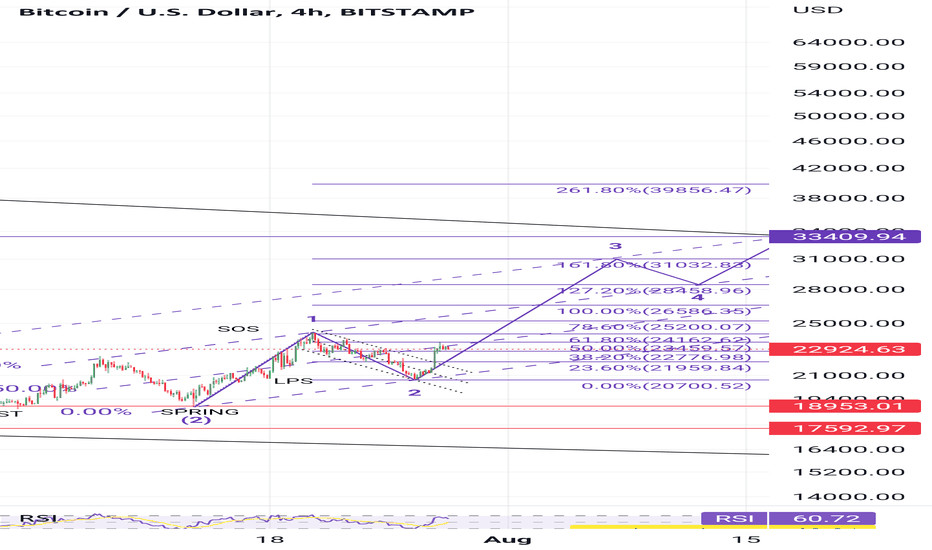
It's been a while since I provided an update on the Wyckoff idea
تجار صباح الخیر ، لقد کنت مشغولاً بعض الشیء مؤخرًا ، لذا لم تتح لی الفرصة لتقدیم تحدیث حول فکرة تراکم Wyckoff الخاصة بی. کما یمکنک أن ترى على مخططی ، نحن فی وضع جید وحقًا للاتجاه الصعودی الجدید الذی یتبع نمط تراکم Wyckoff ، ومن بین کل ما لدیّة. أهدافی لکل موجة محددة. أعتقد أن الموجة الأرجوانی الخامسة ستتکمل حوالی 31،775 دولارًا وهو مستوى دعم/مقاومة رئیسی. هذه waves لقد قمت بتمییزها هی بسیطة waves وبمجرد الانتهاء من دورة الموجة الخمسة ، أعتقد أن هذه الموجة الابتدائیة هی التی ستتبعها الموجة الابتدائیة 1 التی ستتبعها الموجة الابتدائیة التی ستتبعها. لتوفیر تحدیث لـ. please مثل وشارک فکرتی إلى جانب ترک تعلیقاتک إذا کنت لا توافق على ذلک.
GDuBFX
BTC new trend - Following on from my wyckoff accumulation idea
للمتابعة من منشورات تراکم Wyckoff التی شارکتها ، أعتقد الآن أن "المرحلة E" من مخطط Wyckoff على قدم وساق ، وقد بدأ الاتجاه الجدید. کما یمکنک أن ترى على الرسم البیانی الخاص بی ، هناک قناة جدیدة یتم تشکیلها من حیث تم تشکیلها من أعلى إلى حد ما. یمکن أن نرى أننا ندخل فی الموجة الفرعیة الثالثة التی ستتألف من 5 waves ، لذلک سیکون لدینا قریبا تصحیح لإعطاء فرصة لشراء. على أی أسئلة ، لا تتردد فی طرح التعلیقات أدناه.
GDuBFX
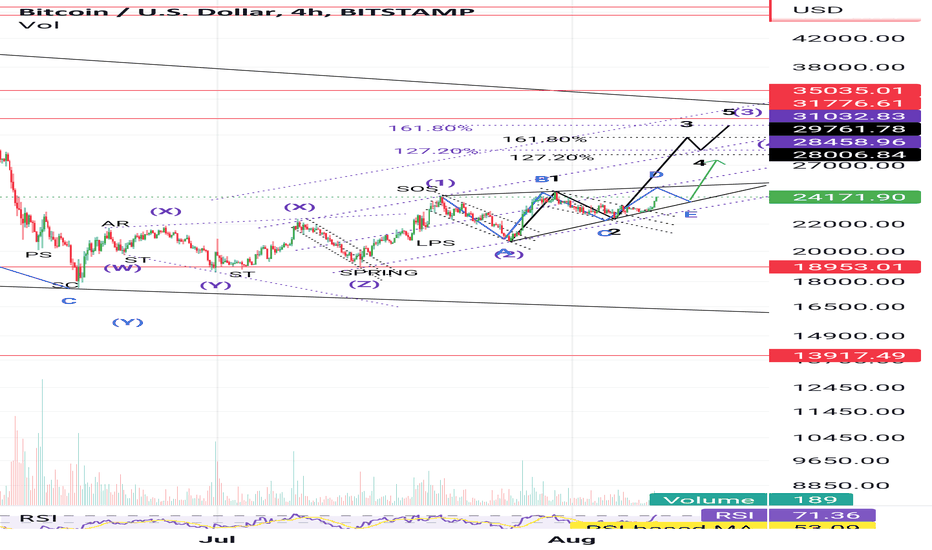
BTC 4H Wyckoff accumulation update
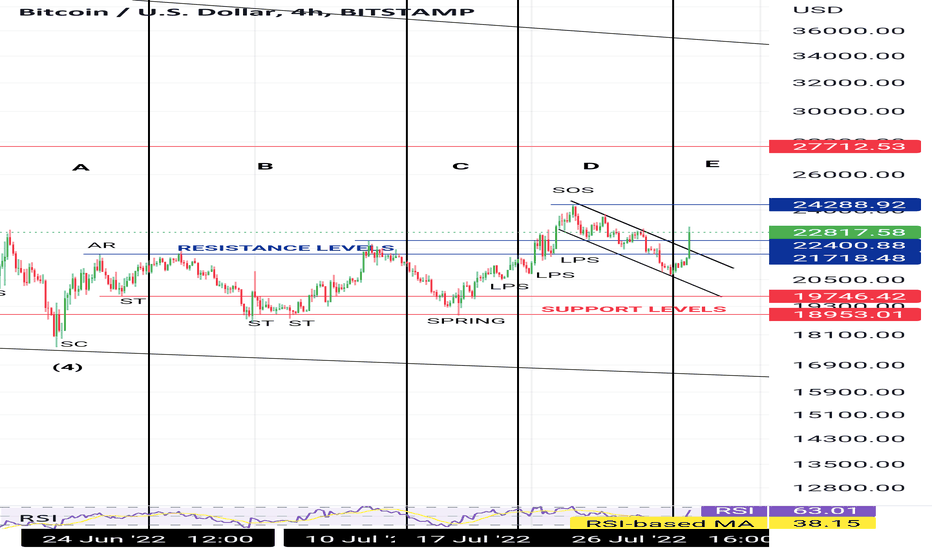
إذا کنت تتابع أفکاری ، فسترى أننی قد نشرت أن لدینا علامة "SOS" على مرحلة القوة ونحن ندخل المرحلة E للنمط. تبین أن هذا غیر صحیح وکما ترون على الرسم البیانی المحدث ، فقد قمت الآن بتمییز هذا مرة أخرى. لقد انخفض السعر فی علامة الثور بعد SOS التی اهتزت الآن وتوقف الخسائر فی مناصب طویلة ، وقد استوعب صانعو السوق هذه الموقف وأصبحوا الآن یرفعون السعر بقوة إلى أعلى ، مما أدى إلى اندلاع الجزء العلوی من العلم. تتمثل الخطوة التالیة فی کسر فوق مستوى المقاومة السابق الذی حددته SOS.
إخلاء المسؤولية
أي محتوى ومواد مدرجة في موقع Sahmeto وقنوات الاتصال الرسمية هي عبارة عن تجميع للآراء والتحليلات الشخصية وغير ملزمة. لا تشكل أي توصية للشراء أو البيع أو الدخول أو الخروج من سوق الأوراق المالية وسوق العملات المشفرة. كما أن جميع الأخبار والتحليلات المدرجة في الموقع والقنوات هي مجرد معلومات منشورة من مصادر رسمية وغير رسمية محلية وأجنبية، ومن الواضح أن مستخدمي المحتوى المذكور مسؤولون عن متابعة وضمان أصالة ودقة المواد. لذلك، مع إخلاء المسؤولية، يُعلن أن المسؤولية عن أي اتخاذ قرار وإجراء وأي ربح وخسارة محتملة في سوق رأس المال وسوق العملات المشفرة تقع على عاتق المتداول.