
Ed_Ale
@t_Ed_Ale

ما هو الشيء الذي ننصحك بشراءه من المواد الغذائية؟
سابق في الشراء
پیام های تریدر
مرشح
SPX / SPY
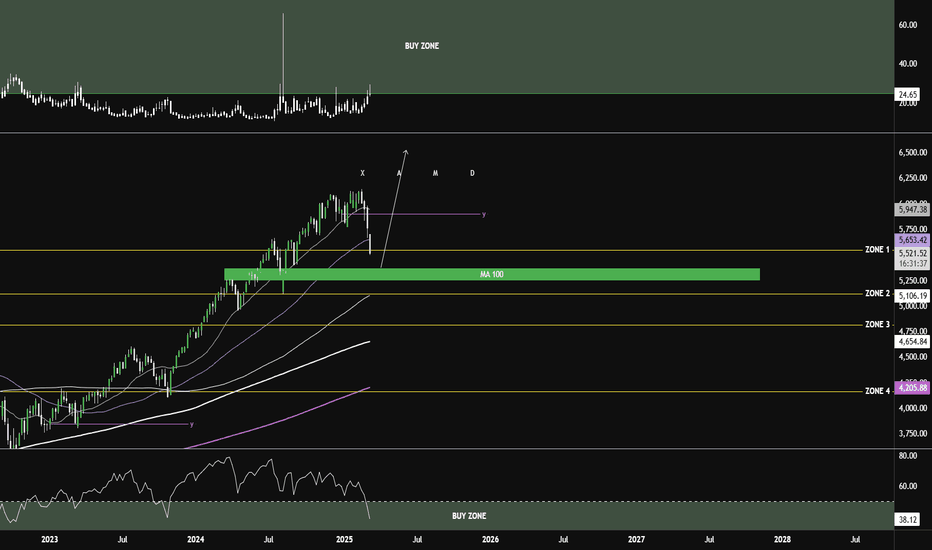
به نظر میرسد شاخص استاندارد اند پورز به انتهای روند نزولی خود نزدیک شده است. با توجه به تصمیم نرخ بهره در هفته آینده، آماده خرید هستیم. سایر نواحی، مناطق بازگشت احتمالی هستند، اما نزدیکترین منطقه، محدوده سبز رنگ است.
BTC FRIDAY BULLISH?

قیمت، پس از کاهش، به نظر میرسد در ابتدای هفته واکنش نشان میدهد، جایی که یک نوسان یهودا (Judas swing) انجام داده و به سمت بالا واکنش نشان میدهد. احتمالاً قیمت دوباره تا ۸۲,۹۳۲.۹۹ دلار افزایش یابد و سپس میتوان از گپ فیوچرز CME در قیمت ۸۷,۰۰۰.۰۰ دلار سود برداشت کرد. قیمت نباید به شدت از سطح ۷۹,۰۰۰ دلار عبور کند، زیرا در صورت وقوع این اتفاق، احتمالاً BTC تا ۷۴,۰۰۰ دلار سقوط کرد. تا سهشنبه-چهارشنبه هفته آینده احتیاط کنید، زیرا ممکن است نوسانات زیادی وجود داشته باشد. TP1
Scalping trade BTC

BTC قصیر مع XAMD
Bull Run Bitcoin

یمکننا أن نرى أن سعر bitcoin یتحرک بشکل جانبی على شکل علم هبوطی لمدة 5 أشهر لتصفیة إیقاف الخسارة. قد نکون على verge من انفجار صعودی فی سعر bitcoin فی الأسابیع المقبلة، حیث ارتد من المتوسط المتحرک الأسی 50 أسبوعیًا، کما أن مؤشر الزخم الأسبوعی والیومی وعلى مدى 4 ساعات باللون الأحمر مما یخبرنا بذلک ربما یکون بالفعل فی ذروته. آخر تحرکات هبوطیة فی السوق، ثم الارتفاع.
BTCUSD 😥

یبدو أن Bitcoin یتم تعزیزه لحرکة صعودیة محتملة، وهناک ما یقرب من 16 یومًا متبقیة حتى النصف ویبدو أنه یرید جعل people یشکک فی الاتجاه الصعودی بعد النصف، وکل ما تبقى هو الاستمرار فی الشراء ولکن إذا إذا کسرت 50 ألف دولار أمریکی، فسیکون الاتجاه الصعودی موضع شک بسبب شیء خارجی (الحرب العالمیة الثالثة أو الأزمة الاقتصادیة) ترادینجلاتینو:

ICT, Smart Money Concepts or Institutional Trading

https://www.tradingview.com/x/MLEwXrkv/ We will use for the PRICE part: 3 for PO3 6 for IPAD levels. And for the TIME part: 9 as seen in the lookback period. Combine these together, and you have your time and price. https://www.tradingview.com/x/JKOcExqt/ These concepts are based on the vast majority on the terminology of Michael J. Huddleston, known as The Inner Circle Trader or ICT. Hopiplaka's contribution 1. POWER OF THE THREE NUMBERS “THREE GREAT FORCES RULE THE WORLD: STUPIDITY, FEAR AND GREED." .- ALBERT EINSTEIN INTRODUCTION TO PO3 (Power of Three) The power of three was also prevalent in the mythology of many ancient cultures. In Greek mythology, the number three was associated with the goddess of wisdom, Athena, and the god of war, Ares. In Hindu mythology, the number three was considered sacred and represented the three worlds of creation, preservation, and destruction. But the power of three is not just limited to ancient history and mythology. In modern times, the concept of triplet numbers continues to be revered and studied by people all over the world. From mathematics and science to art and literature, the power of three can be found in many different fields. Our focus will be on finance, where we are talking about accumulation, manipulation, distribution. Now that we've learned a bit about the history and mythology surrounding the power of three, let's delve into how to calculate and understand these special numbers. In mathematics, a power of three is a number of the form 3n where n is an integer – that is, the result of exponentiation with number three as the base and integer n as the exponent. You can also calculate the result multiplying the number 3 x times. Example: 3 x 3 = 9 We can continue this process for any number we choose. For example, the powers of three for the integer 5 would be: 3 x 3 x 3 x 3 x 3 = 243 (2 + 4 + 3 = 9)For example, a fixed dealing range for foreign Exchange asset (fx) EURUSD might be 243 pips (3x3x3x3x3), while a Nasdaq futures symbol is expressed in points, for example 81 (3x3x3x3) points. Once you’re settled with a powers of three number you’re interested in, you can calculate the dealing range. A dealing range is a piece of price action where we expect swings to happen. It typically has a dealing range low and a dealing range high. Price tends to stay inside this dealing range, unless it breaks out this dealing range, and goes to the next partition. When we define a dealing range we’re interested in (in either pips or points), we Will use this number to define the partitions, starting from base 0.0. For example, when we identify that a stock moves around 27 points on average (we do this visually, it Will jump off from the chart), we define the partitions for it. Partition 1 Will run from 0 -> 27 Partition 2 will run from 27 -> 54 Partition 3 Will run from 54 -> 81 If we calculate the partitions (more on that in next part), and we see that Price is aggressively trading though our levels, we might consider doing a range expansión. We have a part devoted to range expansión or contraction, but basically, you take a larger PO3 number. In our example above, the next PO3 number after 27 Will be 81, and we’ll use 81 to define our PO3 partitions. When you’re only interested in the current PO3 partition, because this is where current Price action is taking place, go to the next part, where we discuss the calculation of the current PO3 partition. Above you see a chart of Microsoft with all visible PO3 partitions for PO3 27 on it. We start at base 0, this partition runs until 27, the next partition runs from 27 towards 54, next from 54 to 81, … Typically, as discussed, price tends to “stay in the range” for a while. It can briefly leave the range, and go back into it, or it can leave it, and move on to the next PO3 partition. Below you’ll find an overview of a typical range, and map it to the trader you are. (Scalper, day trader, long term trader, …)USING PO3 DEALING RANGES Remember from the previous part, we will use PO3 partitions starting from base 0, so start at the 0 level. This can be 0 for crypto, stocks, … or 0.0 for Forex. In order to calculate the dealing range partition we’re currently in for our asset – be it fx, índices, crypto, … – we need to have following variables: - current Price. - the power of three number we’re interested in. We’re going to draw a fixed range, using 2 lines, which will delineate our PO3 dealing range. For the current price, we’re just going to open a chart, and take the Price that’s currently printing. Now, we’re going to calculate the current PO3 dealing range low and high. For this, we take the current price, and remove the decimal point, if there is one. We are also only interested in the integer part for anything not Forex related. For Forex we use the first 5 numbers, and ignore the decimal point. Now that we have our base price to use, all we need is the power of three number we’re interested in. (be sure to check the table on the previous part to identify what type of trader you are). By having a look at the Power of Three Numbers we can choose the number for the trade style we’re interested in, such as a scalper (27), a day trader (81), … Use the following formula to calculate the low of the current fixed dealing range. dealing range low = floor(current Price / po3 number) * po3 number
GOLD Potential Sell 📉

یبدو أن الذهب یستعد لتصحیح السوق ویشکل احتمالیة (A B C) أو فی حالة التخلف عن السداد (1 2 3 4 5) کتأکید لدینا نمط قطری متناسق bat وزخم هبوطی قوی یمکن أن یمیز تغییر الاتجاه.
Bitcoin, rise to fall 📈📉👋 🎄

الأسبوع الماضی لنهایة العام ومع دخول الأزمة الاقتصادیة واقتراب الاحتفالات حول العالم مثل عید المیلاد ورأس السنة الجدیدة ویبدو أن المستثمرین لا یبدو أنهم مهتمون بالأصول عالیة المخاطر مثل الأسهم هذا الأخیر تکنولوجیا الشهر (NDQ) والعملات المشفرة. لذلک، قد یرتفع BTC قلیلاً فی الأسبوع الماضی لیواصل الانخفاض فی شهر ینایر. عید میلاد سعید وسنة جدیدة سعیدة 🎄🎅❄
Using the VIX to buy S&P, NASDAQ and Dow Jones 📈📉🐂
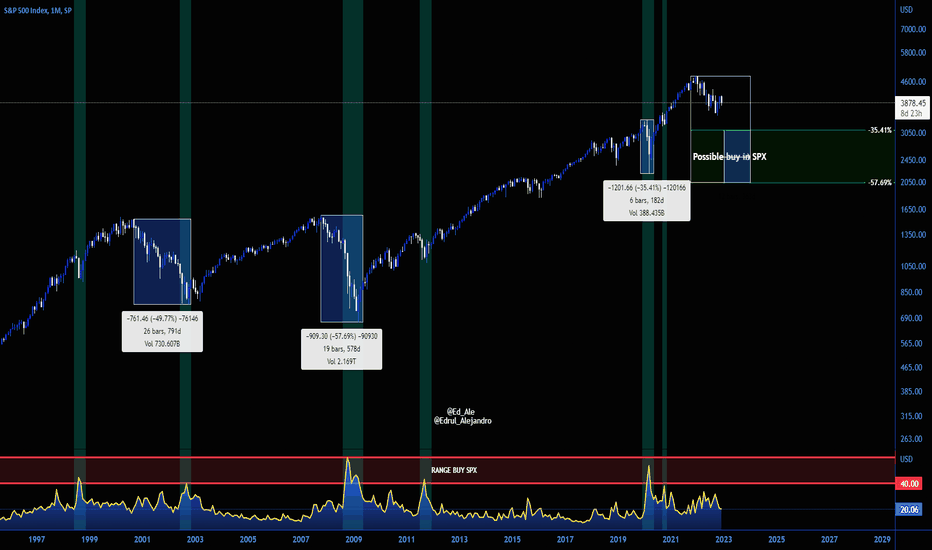
ما هو مؤشر التقلبات VIX؟ مؤشر التقلبات VIX هو مؤشر تقلبات فی الوقت الفعلی أنشأته بورصة شیکاغو للخیارات (CBOE). کان هذا المؤشر أول معیار لقیاس توقعات السوق فیما یتعلق بالتقلبات. ومع ذلک، فإن المؤشر یتطلع إلى المستقبل، مما یعنی أنه یُظهِر فقط التقلبات الضمنیة لمؤشر ستاندرد آند بورز 500 (SPX) على مدار الثلاثین یومًا القادمة. نظرًا لأن مؤشر التقلبات VIX یصل إلى أعلى مستویاته عندما تکون سوق الأسهم أقل استقرارًا، فإن وسائل الإعلام تمیل إلى الإشارة إلى مؤشر التقلبات VIX کمؤشر للخوف، وبالمعنى الذی یشیر إلیه مؤشر التقلبات VIX باعتباره مقیاسًا لإدراک السوق (خاصة القلق) فإن هذا الوصف صحیح. تزداد التقلبات الضمنیة عادةً عندما تشهد الأسواق اضطرابات أو تدهور الاقتصاد. وعلى العکس من ذلک، إذا کانت أسعار الأسهم ترتفع ولم تبدو التغییرات کبیرة على الأرجح، فإن مؤشر التقلبات VIX یمیل إلى الانخفاض أو البقاء مستقرًا فی أسفل مقیاسک. بعبارة أخرى، هناک ارتباط سلبی بین مؤشر التقلبات VIX وأداء الأسهم. على سبیل المثال، فی نوفمبر 2008، انخفض مؤشر التقلبات (VIX) مع ارتفاع أسعار الأسهم، لیصل إلى أعلى مستوى تاریخی عند 80.86. فی شتاء عام 2013، عندما ارتفعت قیمة الأسهم، استقر مؤشر التقلبات (VIX) عند حوالی 12 نقطة. ماذا یقیس مؤشر التقلبات (VIX)؟ یقیس مؤشر التقلبات (VIX) توقعات التقلب فی سوق رأس المال على أساس أسعار الخیارات. بدلاً من قیاس التقلبات "المحققة" أو التاریخیة، یتوقع مؤشر التقلبات التقلبات "الضمنیة" أو المتوقعة - على وجه التحدید من أیام الثلاثینیات المستقبلیة - من خلال قیاس التغیرات فی أسعار خیارات مؤشر ستاندرد آند بورز 500. تاریخیًا، عندما یصل مؤشر التقلبات إلى 40 نقطة أو أکثر، یکون مؤشر ستاندرد آند بورز فی نهایة اتجاهه الهبوطی لتکوین نطاق أو ارتفاع، عندما یصل مؤشر التقلبات إلى 40 نقطة، یمکن القول إننا بالفعل فی حالة رکود و"عندما یکون هناک دماء، فهذا لأن أسماک القرش هاجمت بالفعل" ربما نواجه رکودًا فی عام 2023 ولکنه قد ینتهی فی غضون بضعة أشهر وفی عام 2024 نشهد ارتفاعًا فی المؤشرات الأمریکیة کما یمکن رؤیته أعلاه. تذکر "التاریخ لا یکرر نفسه ولکنه یتناغم"SPXNDQDJIمن المحتمل أن ینتهی الرکود فی النصف الأول من عام 2023 عندما یخفض بنک الاحتیاطی الفیدرالی نقاط الفائدة إلى 0.25٪
إخلاء المسؤولية
أي محتوى ومواد مدرجة في موقع Sahmeto وقنوات الاتصال الرسمية هي عبارة عن تجميع للآراء والتحليلات الشخصية وغير ملزمة. لا تشكل أي توصية للشراء أو البيع أو الدخول أو الخروج من سوق الأوراق المالية وسوق العملات المشفرة. كما أن جميع الأخبار والتحليلات المدرجة في الموقع والقنوات هي مجرد معلومات منشورة من مصادر رسمية وغير رسمية محلية وأجنبية، ومن الواضح أن مستخدمي المحتوى المذكور مسؤولون عن متابعة وضمان أصالة ودقة المواد. لذلك، مع إخلاء المسؤولية، يُعلن أن المسؤولية عن أي اتخاذ قرار وإجراء وأي ربح وخسارة محتملة في سوق رأس المال وسوق العملات المشفرة تقع على عاتق المتداول.