
SUN
Sun (New)
| تریدر | نوع سیگنال | حد سود/ضرر | زمان انتشار | مشاهده پیام |
|---|---|---|---|---|
 DragonCaoBالرتبة: 2773 | خرید | حد سود: تعیین نشده حد ضرر: تعیین نشده | 14/12/2025 | |
 BullBearBTC1الرتبة: 31226 | خرید | حد سود: تعیین نشده حد ضرر: تعیین نشده | 15/12/2025 | |
 Alpha-GoldFXالرتبة: 32114 | خرید | حد سود: تعیین نشده حد ضرر: تعیین نشده | 13/12/2025 |
مخطط سعر Sun (New)
سود ثلاثة أشهر :
سیگنالهای Sun (New)
مرشح
فرز الرسالة بناءً على
نوع التاجر
الإطار الزمني
BullBearBTC1
تحلیل بلندمدت SUN/USDT: نقاط ورود دقیق و سطوح سود (1R و 2R)
سحب الدخول. غیر صالح إذا حقق مستوى مرتفعًا جدیدًا فکرة طویلة مع الإدخالات المذکورة على الرسم البیانی. التجارة 1R و 2R
DragonCaoB
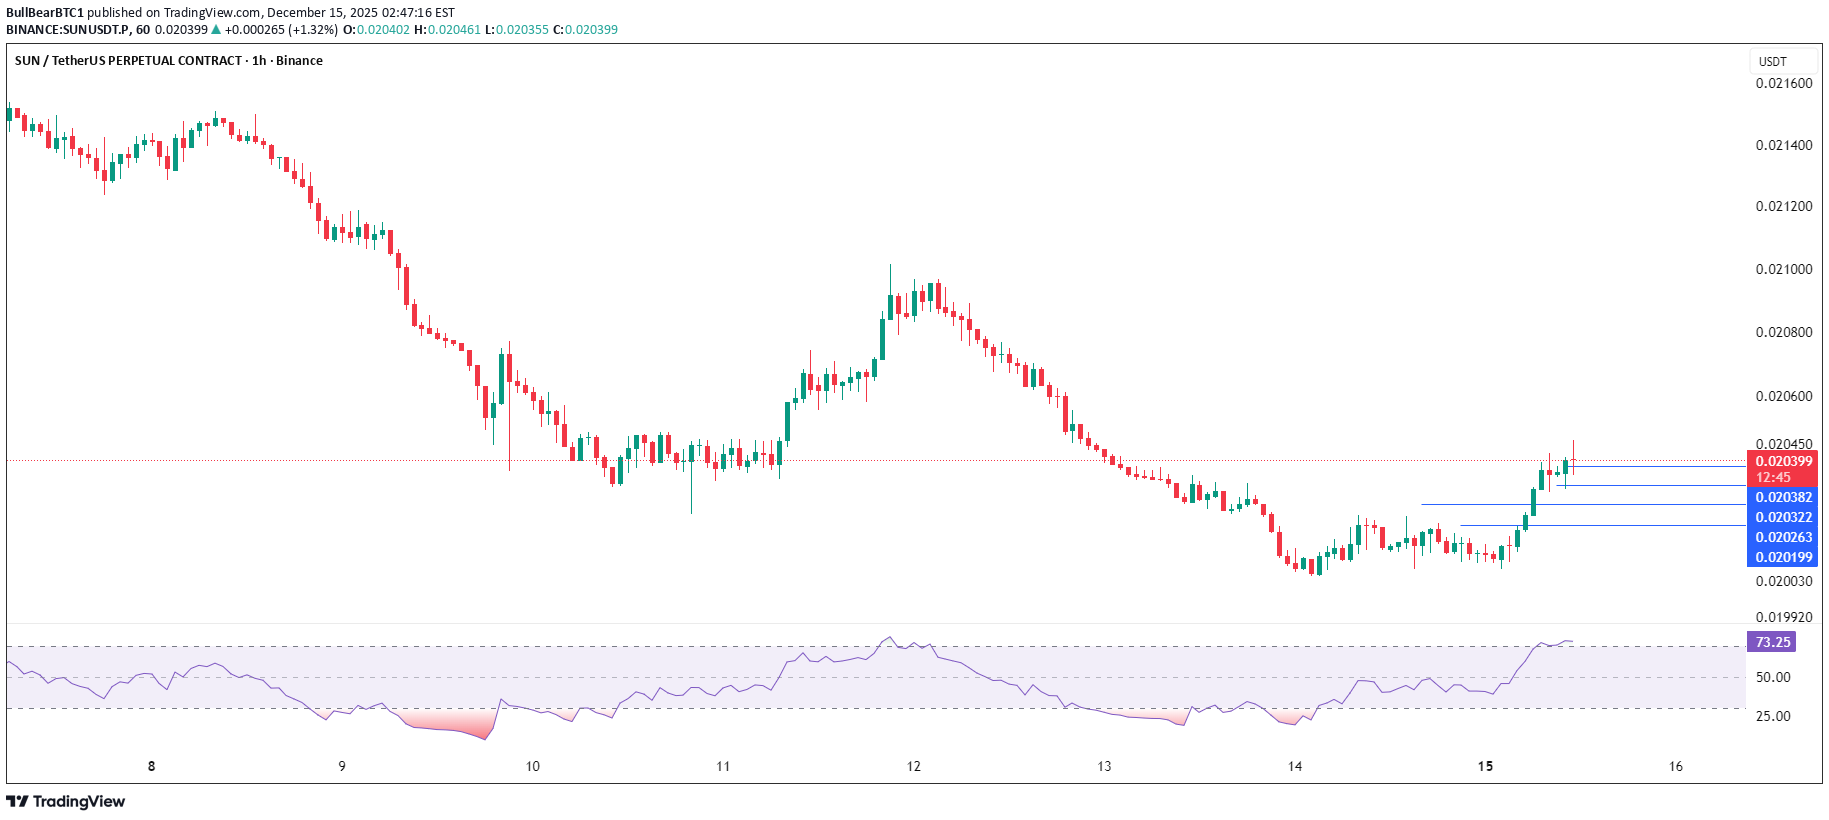
سیگنال خرید قوی: خورشید (SUN) در آستانه انفجار صعودی! (تحلیل تکنیکال)
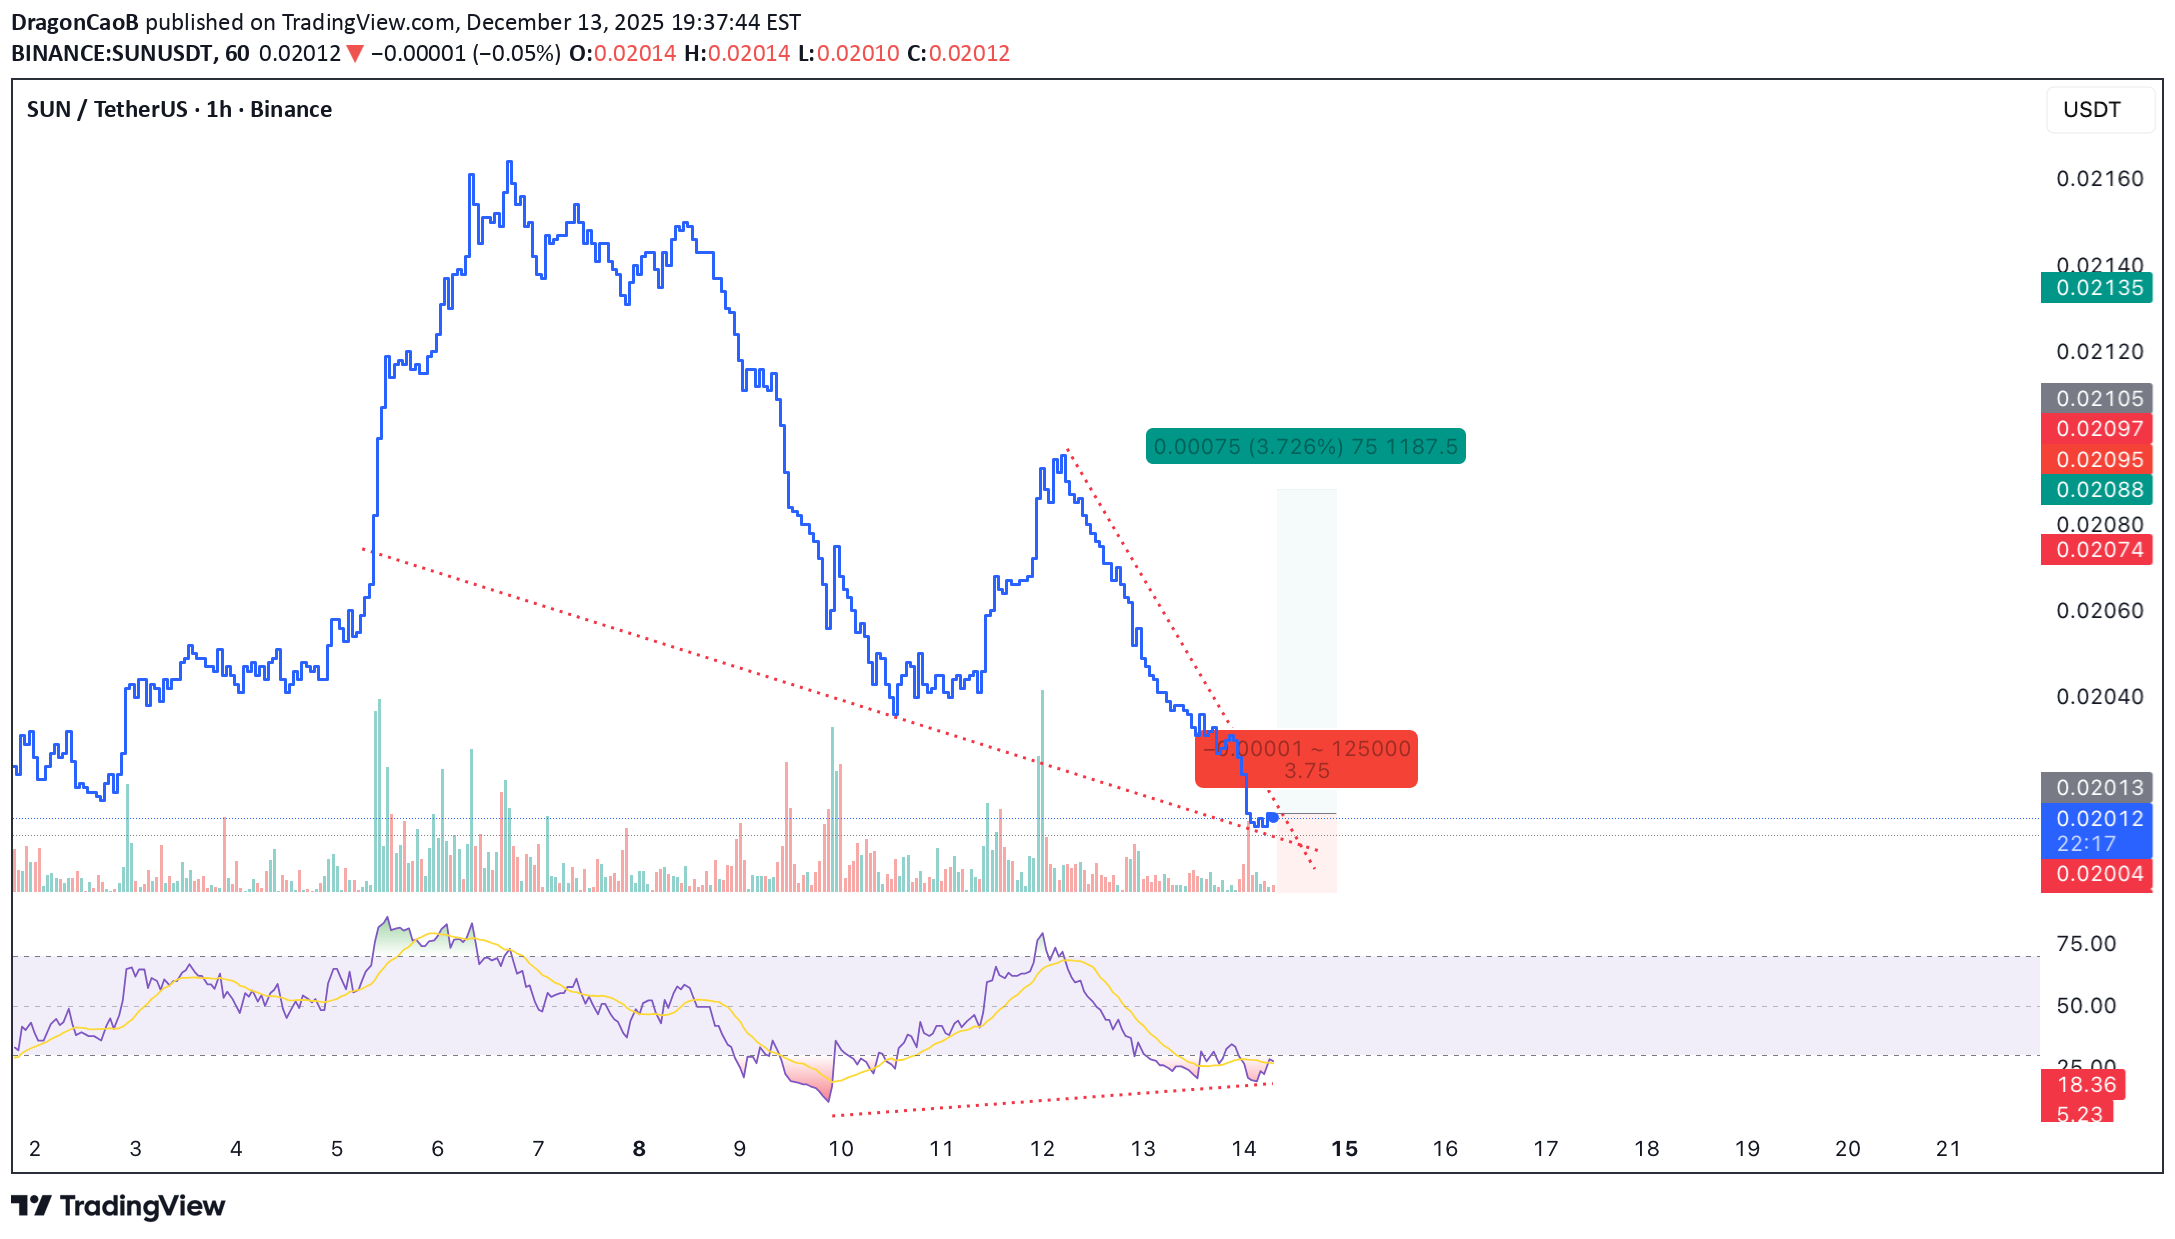
🐂 فروة الرأس طویلة – SUN یقع SUN فی منطقة ذروة البیع بشکل کبیر على الإطار الزمنی لمدة ساعة، مما یشیر إلى الإرهاق من جانب البیع. تضغط حرکة السعر وتقترب من هیکل الاختراق الکلاسیکی، مما یشیر إلى أن الزخم یتزاید لتوسع صعودی حاد. ومن المتوقع حدوث اختراق صعودی قوی. 🎯 TP: 0.02088 🛡️ سی: 0.01993 📊 رو: 1 : 3.75 إعداد طویل عالی الجودة: ظروف ذروة البیع لمدة ساعة + هیکل الاختراق ← إمکانیة الارتداد القوی مع المخاطرة مقابل المکافأة الجذابة.
Alpha-GoldFX
سیگنال صعودی بزرگ در SUNUSDT: منتظر جهش ۵۰ درصدی باشید!
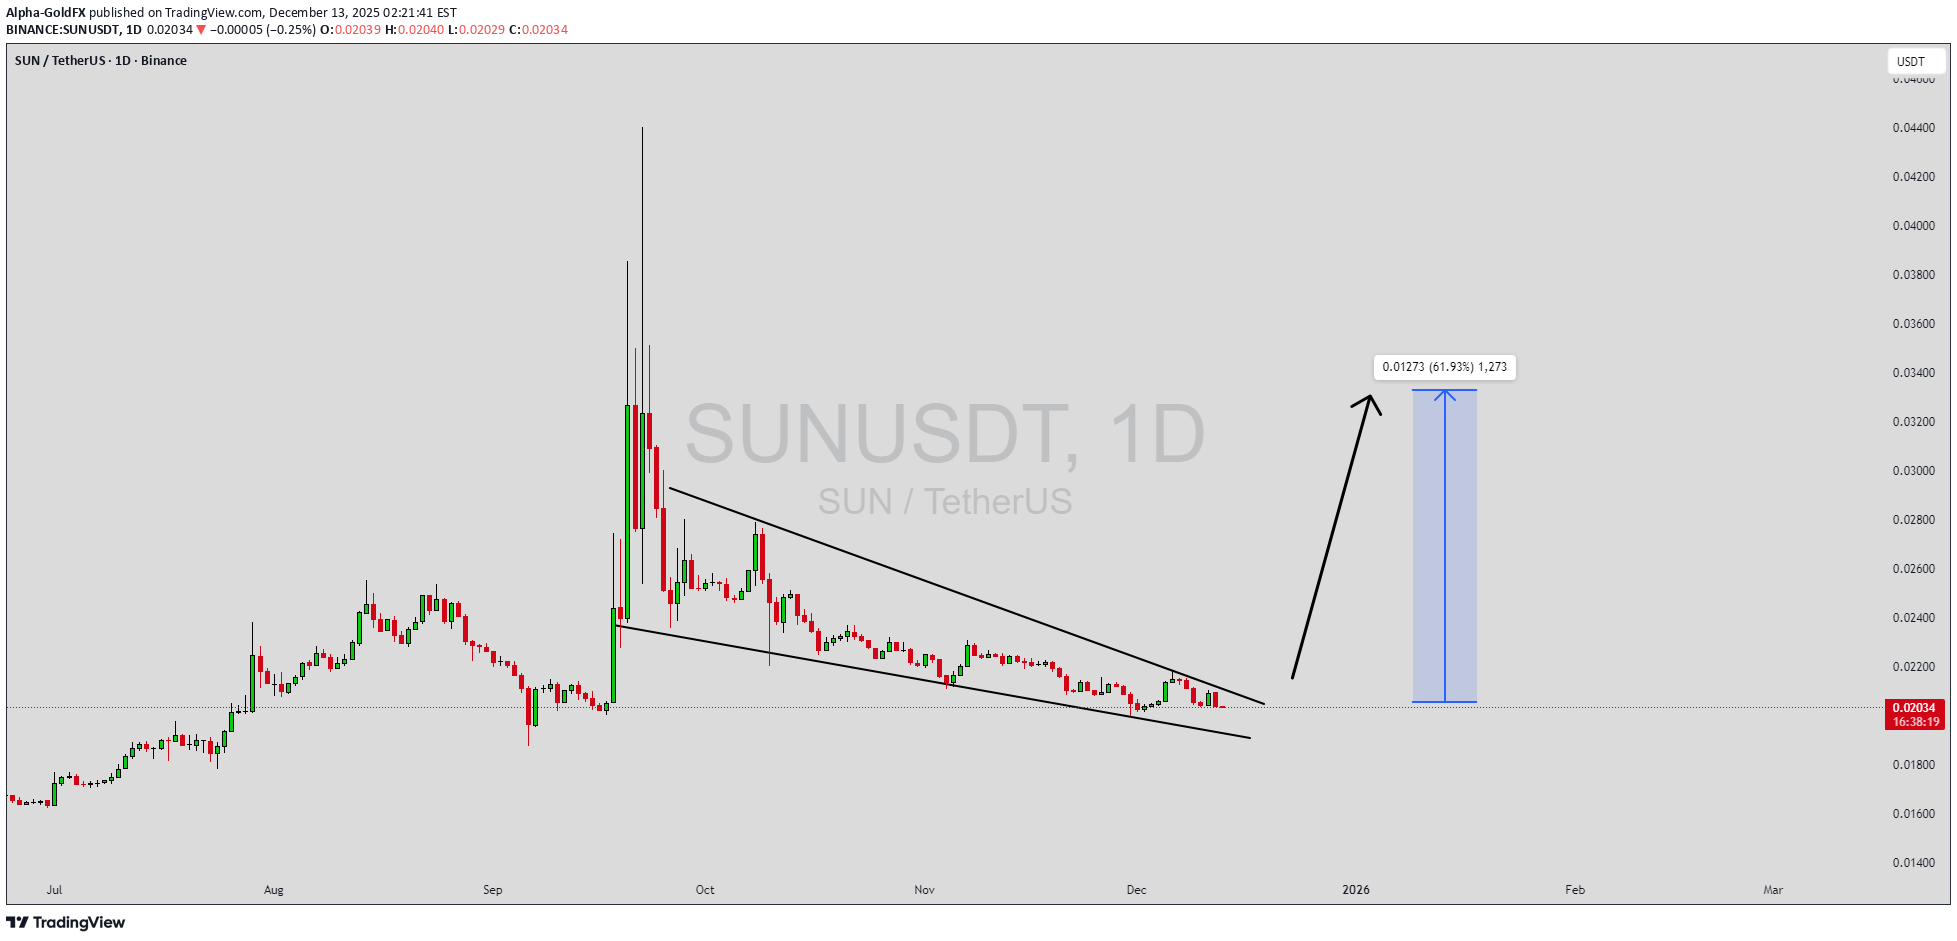
یقوم SUNUSDT بتشکیل نمط إسفین هابط واضح، وهو إشارة انعکاس صعودیة کلاسیکیة تشیر غالبًا إلى اختراق قادم. کان السعر یتماسک ضمن نطاق ضیق، مما یشیر إلى أن ضغط البیع یضعف بینما یبدأ المشترون فی استعادة السیطرة. ومع ثبات حجم التداول الذی یؤکد التراکم عند المستویات الأدنى، یشیر الإعداد إلى اختراق صعودی محتمل soon. یمکن أن یؤدی المستوى move المتوقع إلى مکاسب مذهلة تبلغ حوالی 50% إلى 60% بمجرد کسر السعر فوق مقاومة الوتد. عادة ما یتم رؤیة نمط الوتد الهابط هذا فی نهایة الاتجاهات الهبوطیة أو المراحل التصحیحیة، وهو یمثل تحولا محتملا فی معنویات السوق من الهبوطی إلى الصعودی. یلاحظ المتداولون الذین یراقبون SUNUSDT عن کثب الزخم القوی حیث یقترب من منطقة الاختراق. یضیف حجم التداول الجید الثقة إلى هذا النمط، مما یدل على أن المشارکین فی السوق یتخذون مراکزهم مبکرًا تحسبًا للانعکاس. یعکس اهتمام المستثمرین المتزاید بـ SUNUSDT الثقة المتزایدة فی أساسیات المشروع طویلة المدى والقوة التقنیة الحالیة. إذا تم تأکید الاختراق مع استمرار حجم التداول، فقد یشیر هذا إلى بدایة موجة صعودیة جدیدة. قد یجد المتداولون أن هذا إعداد قیم لتحقیق مکاسب على المدى المتوسط، خاصة مع اکتمال نمط الوتد وتسارع زخم الشراء. ✅ أظهر دعمک بالضغط على زر الإعجاب و ✅ ترک تعلیق أدناه! (ما رأیک فی هذه العملة؟) إن تعلیقاتک ومشارکتک تلهمنی لمشارکة المزید من تحلیلات السوق الثاقبة معک!

Bithereum_io
تحلیل تکنیکال SUNUSDT: شکست گُوِه نزولی و اهداف قیمتی هیجانانگیز!
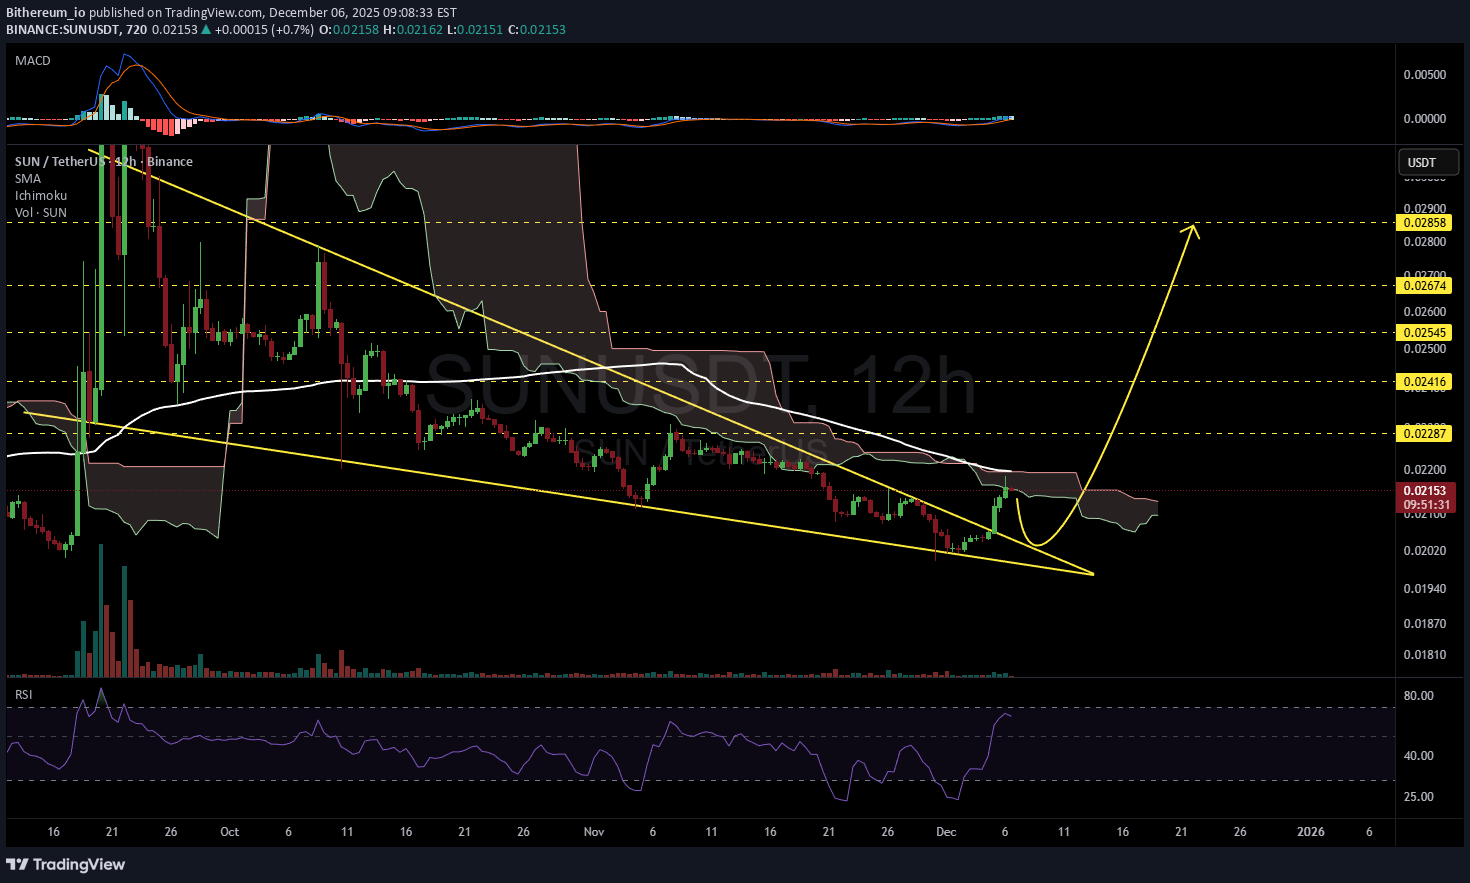
کسر #SUN فوق نمط الوتد الهابط على الرسم البیانی للإطار الزمنی 12 ساعة ویواجه حالیًا سحابة إیشیموکو والمتوسط المتحرک البسیط 12 ساعة، مما قد یتسبب فی حدوث تراجع لإعادة اختبار الوتد. فی حالة الاختراق فوق هذه المستویات، فإن الأهداف المحتملة هی: 🎯 0.02287 دولار 🎯 0.02416 دولار 🎯 0.02545 دولار 🎯 0.02674 دولار 🎯 0.02858 دولار ⚠️ تذکر دائمًا استخدام نقاط إیقاف الخسارة المشددة والحفاظ على الإدارة السلیمة للمخاطر.

نوسانات اقتصاد جهانی: عامل اصلی تغییرات و چالشهای پیش رو

1. Understanding Fluctuations in the Global Economy Fluctuations refer to periodic or unpredictable changes in economic indicators such as GDP growth, employment levels, inflation, or market prices. These shifts can be short-term (cyclical), medium-term (structural), or long-term (systemic). Types of Fluctuations: Business Cycle Fluctuations: These are natural phases of expansion, peak, contraction, and recovery in an economy. Every country experiences these cycles, though their duration and intensity vary. Financial Market Fluctuations: Driven by investor sentiment, interest rates, and corporate performance, these include stock market rallies and crashes that influence global wealth and investment. Currency and Exchange Rate Fluctuations: Changes in the value of one currency against another affect trade competitiveness, inflation, and cross-border investments. Commodity Price Fluctuations: Volatile prices of oil, gold, natural gas, and agricultural goods can create inflationary or deflationary pressures worldwide. Geopolitical and Policy Fluctuations: Political instability, trade wars, and monetary policy changes often disrupt global supply chains and financial flows. These fluctuations are not random; they emerge from a complex interaction of economic fundamentals, investor behavior, and policy interventions. 2. Causes Behind Global Economic Fluctuations Understanding why fluctuations occur is crucial to managing their impact. Several interrelated factors trigger these shifts: Monetary and Fiscal Policy Changes: Central banks influence liquidity through interest rates and quantitative easing. When interest rates are low, borrowing increases, spurring growth. However, tightening measures to control inflation can slow down the economy, causing cyclical fluctuations. Global Supply and Demand Imbalances: A mismatch between production and consumption—such as oversupply in commodities or chip shortages in technology—creates price volatility. Technological Innovations: Innovations can disrupt existing industries. For instance, the rise of renewable energy affects oil prices, while AI and automation reshape job markets. Investor Psychology and Speculation: Markets are heavily influenced by collective emotion—fear and greed. A surge in optimism can inflate asset bubbles, while panic can trigger sharp corrections. Geopolitical Tensions and Conflicts: Wars, sanctions, and trade barriers affect global trade routes and resource availability, leading to supply shocks and inflationary spikes. Natural Disasters and Pandemics: Events like COVID-19 illustrate how quickly global production, logistics, and consumption patterns can be disrupted, leading to large-scale fluctuations. 3. The Domino Effect: How Fluctuations Spread Globally In today’s globalized economy, no country operates in isolation. Fluctuations in one economy can cascade through several channels: Trade Linkages: When demand drops in one major economy, exporters in others suffer. For instance, a slowdown in China can hurt commodity exporters like Brazil or Australia. Financial Markets: Global investors move capital rapidly between countries. A crisis in one market can trigger sell-offs across others, as seen during the 2008 financial crisis. Currency Transmission: Exchange rate volatility affects import-export competitiveness. A weakening yen, for example, can pressure South Korea’s exports. Commodity Channels: Oil price swings influence transportation costs, inflation rates, and household spending worldwide. Sentiment and Confidence: Even without direct exposure, economies can feel the psychological effects of global uncertainty, reducing investment and spending. 4. Impact on Different Sectors of the Global Economy A. Trade and Manufacturing Trade volumes fluctuate with changing demand and currency valuations. A strong dollar may make U.S. exports expensive, while a weaker rupee might boost India’s export competitiveness. Manufacturing sectors dependent on global supply chains—such as electronics or automobiles—are especially sensitive to such shifts. B. Energy and Commodities Oil and natural gas prices are key determinants of inflation and transportation costs. A sudden oil price surge can trigger global inflation, while a drop can hurt energy-exporting nations like Saudi Arabia or Russia. C. Financial Markets Stock indices mirror investor confidence. Bull markets encourage investment and innovation, while bear markets reduce liquidity and consumer spending. Fluctuations here affect everything from pension funds to venture capital. D. Employment and Wages During downturns, companies cut costs, leading to layoffs and wage stagnation. Conversely, economic expansions raise demand for labor, increasing incomes but sometimes fueling inflation. E. Developing Economies Emerging markets often bear the brunt of global volatility. Their currencies weaken faster, capital outflows rise, and inflation accelerates due to dependence on imported goods. 5. The Psychological and Social Ripple Effects Economic fluctuations don’t just affect balance sheets—they shape social behavior and confidence. When stock markets fall, households feel poorer, spending less and saving more. Consumer pessimism can then deepen recessions. Similarly, rising prices or unemployment can lead to political instability, protests, and shifts in leadership. Governments facing such pressures often turn to populist or protectionist measures, altering global policy landscapes. The social cost of economic instability is immense—ranging from increased inequality to reduced access to education and healthcare in developing regions. 6. Case Studies: Major Global Fluctuations A. The 2008 Financial Crisis Triggered by the U.S. housing bubble, this crisis spread globally through financial markets. Banks collapsed, trade volumes shrank, and unemployment surged worldwide. It illustrated how interconnected the global economy had become and led to reforms in banking regulations and monetary policy coordination. B. The COVID-19 Pandemic (2020–2021) The sudden halt in production, transportation, and consumption caused one of the sharpest global recessions in history. Yet, it also accelerated digital transformation and remote work adoption—showing how fluctuations can drive structural change. C. The Russia-Ukraine Conflict (2022–Present) This geopolitical event caused major energy and food supply disruptions. The resulting surge in oil and grain prices led to inflationary pressures in both developed and developing nations. D. Global Inflation Wave (2023–2024) As economies recovered post-pandemic, demand outpaced supply. Central banks raised interest rates aggressively, leading to sharp corrections in equity and bond markets. This episode reminded policymakers of the delicate balance between growth and stability. 7. Policy and Institutional Responses Governments and central banks play critical roles in mitigating the impact of fluctuations. Their responses can stabilize markets or, if misjudged, worsen volatility. Monetary Policies: Central banks use interest rate adjustments, bond purchases, and liquidity injections to influence credit availability and inflation. Fiscal Policies: Governments can increase public spending or reduce taxes to stimulate demand during downturns, or tighten budgets to cool overheated economies. Regulatory Reforms: Post-crisis regulations like Basel III enhanced global banking stability by improving liquidity and capital requirements. International Cooperation: Institutions like the IMF and World Bank provide financial aid and policy coordination to manage crises across borders. Market Transparency and Digitalization: Technologies like blockchain and AI now enhance real-time monitoring of global economic trends, reducing reaction delays. 8. Long-Term Effects: Evolution Through Fluctuation Though painful in the short term, fluctuations often lead to long-term growth and innovation. Crises expose weaknesses in economic systems, prompting reforms and resilience-building. For instance: The 2008 crisis accelerated the move toward digital banking. COVID-19 expanded e-commerce and remote working ecosystems. Energy market disruptions are fueling investment in renewables. Thus, fluctuations, while disruptive, serve as catalysts for modernization and adaptation. 9. Strategies to Navigate Global Fluctuations For nations, corporations, and investors, adaptability is key. Some strategic measures include: Diversification: Spreading investments across sectors and regions reduces exposure to single-market shocks. Sustainable Development: Economies focusing on renewable energy, digital infrastructure, and innovation withstand shocks better. Prudent Monetary Management: Maintaining healthy foreign reserves and debt levels allows flexibility during crises. Data-Driven Decision-Making: Using predictive analytics helps governments and businesses anticipate market turns. Global Collaboration: Shared crisis management mechanisms—like coordinated rate cuts or trade agreements—strengthen collective resilience. Conclusion: Embracing the Waves of Change Economic fluctuations are neither entirely avoidable nor entirely harmful. They are intrinsic to the global economic system—signaling transitions, correcting excesses, and driving innovation. The key lies in how the world responds to them. Policymakers must balance growth with stability, corporations must plan for volatility, and investors must understand that uncertainty is the price of opportunity. The global economy, much like the ocean, will always have tides of expansion and contraction. Learning to navigate these waves—rather than resisting them—is the essence of sustainable progress. In essence, fluctuations are not the enemies of the global economy—they are its rhythm, its pulse, and its path toward evolution.

minno91
Quick Scalp or Just a Dump?
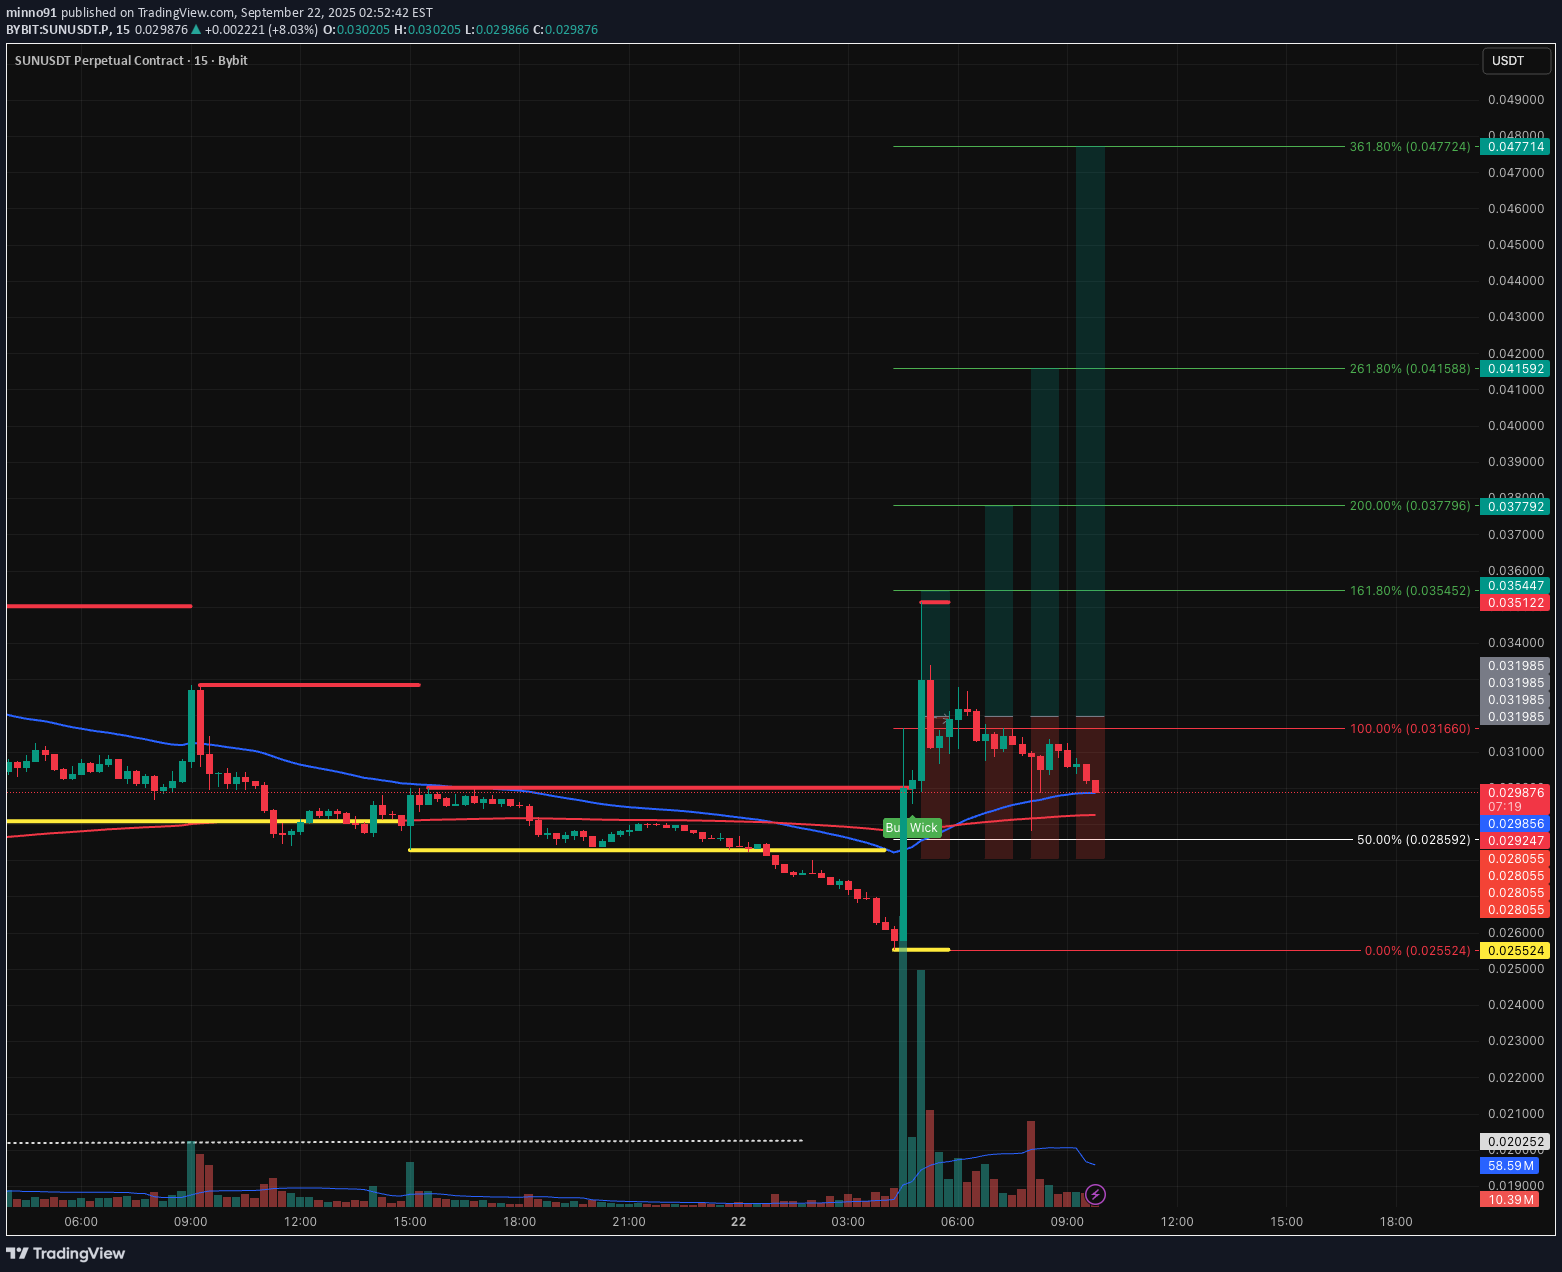
یظهر السوق بعض ضغط الإغراق فی الوقت الحالی ، ولکن هذا یفتح الباب أیضًا للتعافی السریع. هذا هو إعداد فروة الرأس النقی - یمکن أن یلعب فی دقائق فقط. عالیة المخاطر ، تجارة سریعة ، لا شیء طویل الأجل-ولکن فی بعض الأحیان هذه الأفکار السریعة تستحق اللقطة. دعونا نرى کیف یعمل! 👀🔥

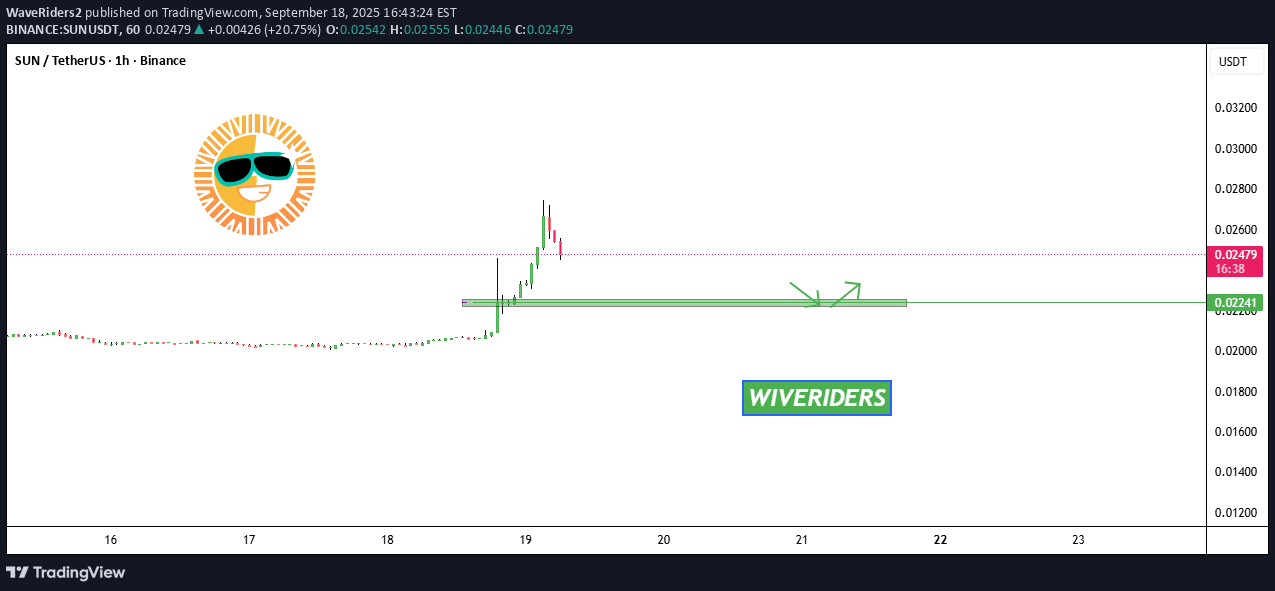
WaveRiders2

AltcoinPiooners
Explode Your Gains: Epic $SUN Trading Breakthrough Awaits!
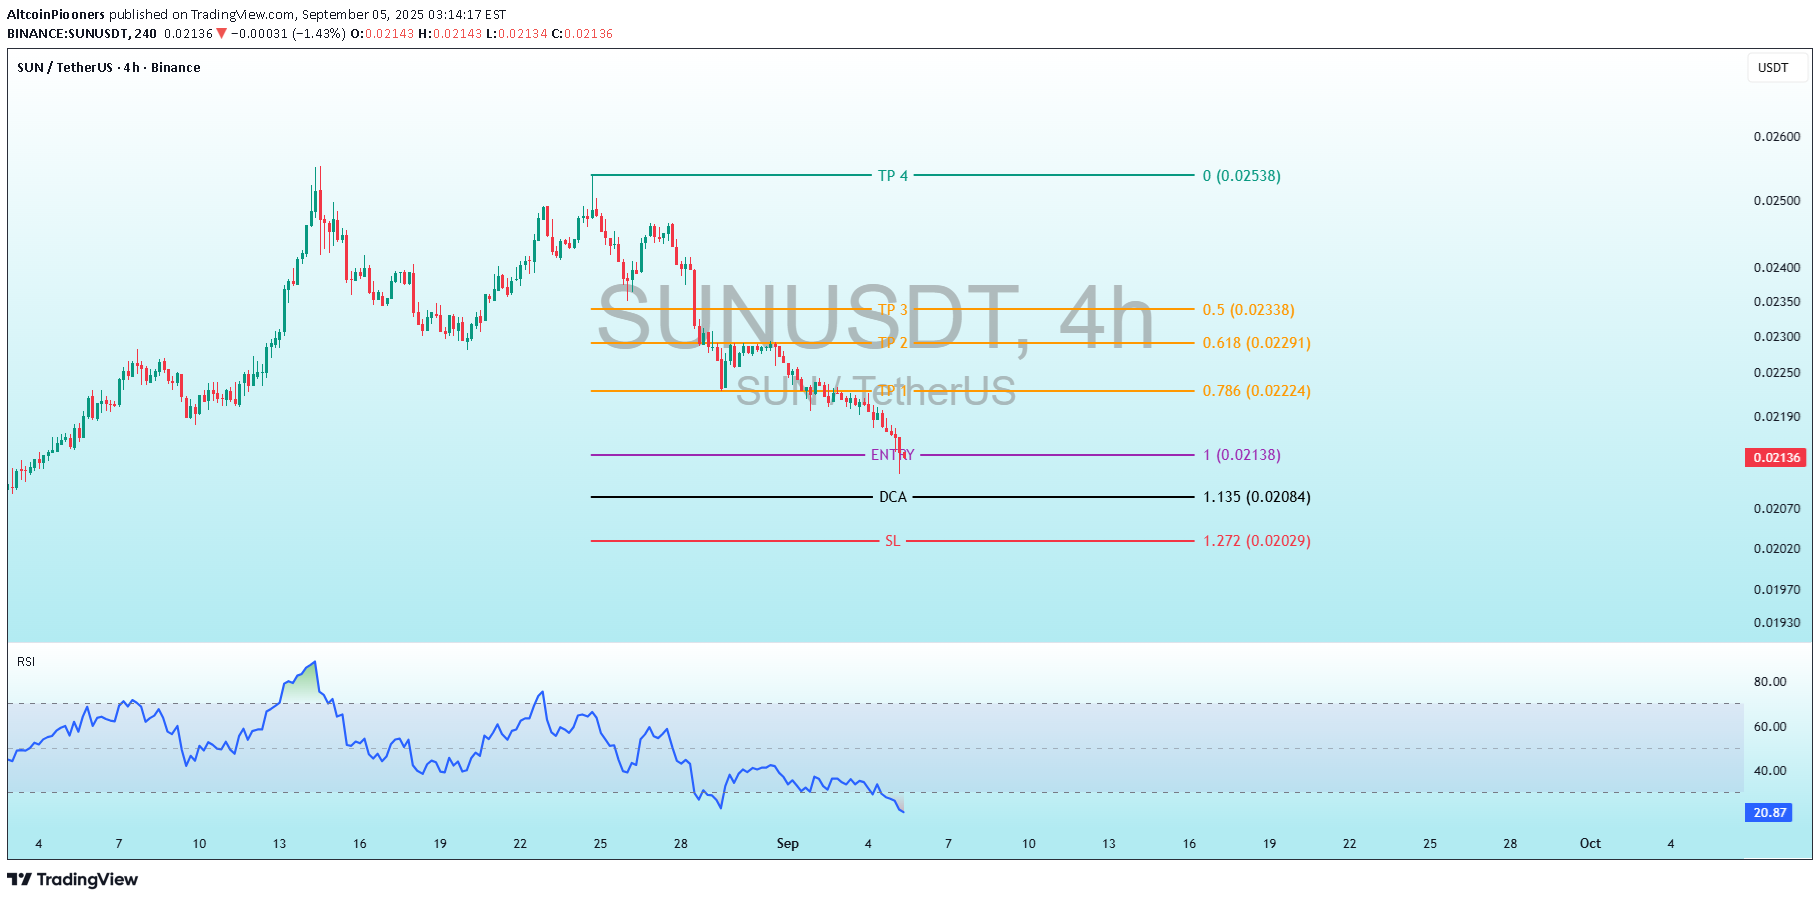
Sunusdt تنفجر مکاسبک: ملحمة SUN تداول اختراق ینتظر! الأنماط الرئیسیة: تشکل الاتجاه الصعودی ارتفاعًا مکافئًا واضحًا مع زیادة التقلبات (فتیل أطول على الشموع). یشبه الاتجاه الهبوطی مرحلة "تفریغ" ، مع انخفاض شبه مبدئی ، وربما مدفوعًا بتحولات الأرباح أو معنویات السوق. یتم توحید السعر الحالی بالقرب من منطقة الدعم المحتملة (0.0190-0.0.0200 USDT) ، مع وجود شموع صغیرة الجسدیة تشیر إلى التردد. لا یوجد نمط عکسی واضح (على سبیل المثال ، المطرقة أو القاع المزدوج) مرئی حتى الآن ، ولکن القرب من المستویات المحددة یشیر إلى إعداد واحد. التقلب والنطاق: یتراوح النطاق السعری خلال الفترة من 0.0170 USDT (أدنى مستویات) إلى 0.0600 USDT (الارتفاعات). الإجراءات الحدیثة منخفضة التنقل مقارنة بالذروة ، حیث یعانق السعر الطرف الأدنى. تحلیل المؤشر: RSI یتم رسم RSI (14-فتروود) فی الأسفل ، یتراوح من 0 إلى 100 ، مع عتبات مفرطة فی الذروة (> 70) وورم بیع (<30) تم تمییزها ضمنیًا (الخطوط الأفقیة فی 80 ، 60 ، 40 ، 20). السلوک: عکس RSI إجراء السعر عن کثب. لقد ارتفع إلى أکثر من 80 عامًا خلال الاتجاه الصعودی (ذروة الشراء ، مما یشیر إلى استنفاد محتمل) ، ثم انخفض بشکل حاد إلى حوالی 20-25 بحلول أوائل سبتمبر (Over -Progh ، مما یشیر إلى فرصة شراء محتملة). القراءة الحالیة: RSI فی حوالی 21 (مرئیة على الیمین) ، deep فی منطقة البیع. لقد کان یتجه نحو الأسفل ولکنه یتسطح قلیلاً فی الشموع الحدیثة ، مما قد یلمح إلى الاختلاف إذا استقر السعر - إشارة صعودیة إذا تم تأکیدها. التفسیر: غالبًا ما یسبق RSI RSI الانعکاسات فی الأسواق المتجهة ، وخاصة فی التشفیر. ومع ذلک ، فی الانخفاضات القویة ، یمکن أن یظل فی مرحلة البیع لفترات طویلة. لا یوجد اختلاف صعودی واضح (RSI LOWS LOWS بینما یجعل السعر أقل من أدنى مستویاته) واضحًا حتى الآن ، لکن راقب ذلک کتأکید للجانب الصعودی. مستویات ملحوظة واستراتیجیة التداول یتضمن الرسم البیانی خطوطًا أفقیة متعددة مع ملصقات وألوان ونسب فیبوناتشی (على سبیل المثال ، 0.786 ، 1.618) ، مما یشیر إلى خطة تداول قائمة على فیبوناتشی لوضع طویل. هذا أمر شائع فی تداول التشفیر من أجل عرض الأهداف وإدارة المخاطر. یبدو أن المستویات ترتکز من تأرجح مؤخرا إلى ارتفاع (من المحتمل أن یکون انخفاض أغسطس إلى ذروتها). إیقاف فقدان (SL): Red خط عند 1.272 USDT ، المسمى "SL" مع FIB 1.272 (0.02029) - تباین طفیف فی الملصق ، وربما ملاحظة حساب). هذا هو مستوى المخاطر حیث سیتم إبطال التجارة إذا انخفض السعر. متوسط تکلفة الدولار (DCA): الخط الأسود عند 1.135 (1.135 FIB ، 0.02004). هذا یشیر إلى إضافة إلى الموضع إذا انخفض السعر إلى أبعد من ذلک ، حیث یبلغ متوسط تکلفة الدخول. الدخول: الخط الأرجوانی فی 1 (1.0 FIB ، 0.02140-0.02135). هذا هو مستوى الشراء الأساسی ، حیث یدخل المتداول فی وضع طویل. السعر الحالی قریب جدًا أو أقل قلیلاً من هذا ، مما یجعله نشطًا أو وشیکًا. خذ مستویات الربح (TP): خطوط برتقالیة وسیرة متعددة ، مصممة بملحقات FIB (على سبیل المثال ، 0.786 ، 1.618 ، 3.0 ، 4.618 ، 5.0) والأسعار: TP1: ~ 0.02224 USDT (0.786 FIB ، 0.02224) TP2: ~ 0.02291 USDT (1.618 FIB ، 0.02291) TP3: ~ 0.02338 USDT (من المحتمل 3.0 أو 4.0 FIB ، 0.02338) TP4: Cyan at 0 (الهدف الموسع 0.02538 USDT ، ربما 5.0 FIB أو المرتفع السابقة).
Alpha-GoldFX
SUNUSDT Forming Descending Triangle
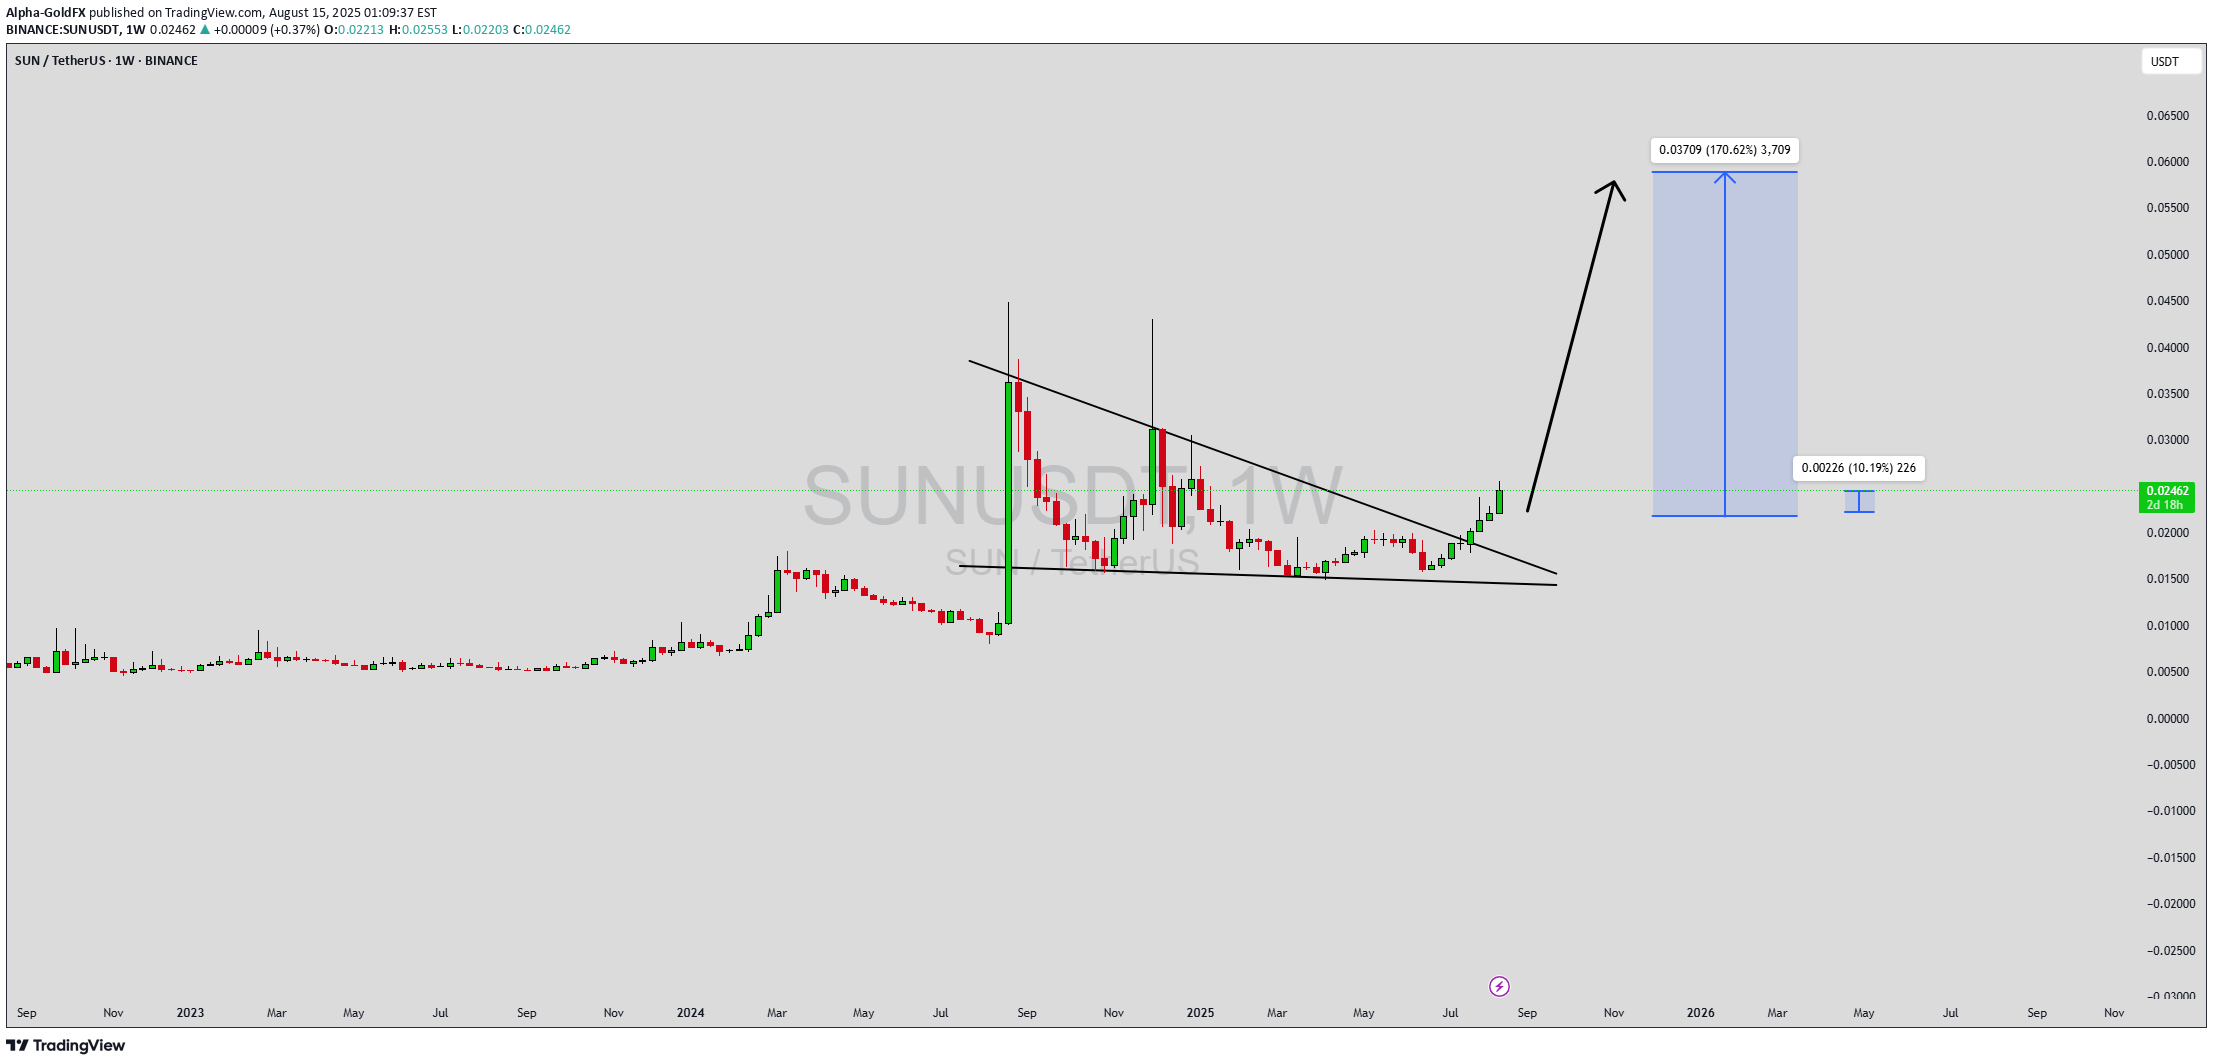
یُظهر Sunusdt a اندلاعًا صعودیًا قویًا من المثلث المتنازع علیه على المدى الطویل ، a تشکیل غالبًا ما یسبق إجراء السعر المتفجر. یکشف الرسم البیانی الأسبوعی a عن الانهیار المستمر فوق مقاومة خط الاتجاه متعدد أشهر ، مما یشیر إلى a تحول فی هیکل السوق والإشارة إلى أن الثیران یکتسبون السیطرة. مع بناء الحجم تدریجیا و a بنیة واضحة تؤکد التراکم ، یبدو أن Sunusdt جاهز لـ a مهم move. استنادًا إلى إعداد الرسم البیانی الحالی ، هناک إمکانیة لما یصل إلى ارتفاع کبیر بنسبة 140 ٪ إلى 150 ٪. تاریخیا ، أظهر SUN تجمعات رأسیة حادة تتبع فترات التوحید. یحاکی الاختراق الحالی السلوک الماضی ویمکن أن یؤدی إلى استمرار الاتجاه القوی فی منطقة 0.06000 a. یولی التجار والمستثمرین على حد سواء اهتمامًا وثیقًا بهذا المستوى ، لأن الموجة التالیة من المشاعر الصعودیة یمکن أن ترسل Sunusdt إلى اکتشاف الأسعار ، خاصة مع عرض سوق التشفیر optimism. معنویات السوق حول SUN تتحسن أیضًا بسبب زیادة الاهتمام من لاعبی البیع بالتجزئة والمؤسسات. یعکس الطنین الاجتماعی ، إلى جانب زیادة أحجام المعاملات ، الثقة المتزایدة فی خریطة طریق هذا المشروع والآفاق المستقبلیة. إذا استمر الزخم الحالی ، فقد یتفوق Sunusdt على الأسلحة الأخرى على المدى القصیر إلى المتوسط. ✅ إظهار دعمک عن طریق الضغط على زر مثل و ✅ ترک a تعلیق أدناه! (ما رأیک فی هذه العملة) ملاحظاتک ومشارکتک تبقینی مصدر إلهام لتبادل المزید من تحلیل السوق معک!
Alpha-GoldFX
SUNUSDT Forming Potential Breakout

یقوم Sunusdt حالیًا بتکوین نمط محتمل واعد یحمله المتداولون والمستثمرین عن کثب. أظهر إجراء السعر فترة من التوحید بالقرب من مناطق الدعم الرئیسیة ، وبناء قاعدة قویة لتحرک متفجر محتمل. مع زیادة حجم الحجم تدریجیاً والسیطرة على الثیران ، یبدو أن الزوج مستعد لکسر مستویات المقاومة السابقة ، مما یشیر إلى بدایة مرحلة الاتجاه الصعودی الجدید. یدعم الهیکل الفنی تحیزًا صعودیًا ، مع إمکانیة تحقیق ربح من 140 ٪ إلى 150 ٪+ إذا کان الاختراق یتحقق بالکامل. یشیر سلوک السعر التاریخی وتکوینات الشموع الحدیثة إلى أن Sunusdt یستعد من أجل تجمع ، خاصة وأنه یقترب من خط الاتجاه الحاسم. إذا تم تأکید ذلک ، فقد یؤدی هذا الاختراق إلى خطوة مکافئة ، مدفوعة بتجدید اهتمام السوق وضغط الشراء. Sun ، کونها جزءًا من النظام البیئی TRON ، یستفید من أساس متین وزیادة الاستخدام فی تطبیقات Defi. وقد شهد الرمز الممیز اهتمام المستثمر المتزاید ، مما یزداد إعجاب المعنویات الإیجابیة والإمکانات طویلة الأجل. تتماشى الأساسیات بشکل جید مع التوقعات التقنیة الحالیة ، مما یوفر ثقة إضافیة للتجار الصعودی الذین یتطلعون إلى إعدادات عالیة الکالحة. بالنظر إلى الزخم وتحسین دینامیات السوق ، أصبح Sunusdt مرشحًا لخط الساعات عالی الإمکانات لکل من المتداولین المتأرجحین والمستثمرین على المدى الطویل. یمکن أن یفتح الانقطاع المؤکد فوق النطاق الحالی الباب لتحقیق مکاسب صعودیة کبیرة. ✅ إظهار دعمک عن طریق الضغط على زر مثل و ✅ ترک تعلیق أدناه! (ما رأیک فی هذه العملة) ملاحظاتک ومشارکتک تبقینی مصدر إلهام لتبادل المزید من تحلیل السوق معک!
إخلاء المسؤولية
أي محتوى ومواد مدرجة في موقع Sahmeto وقنوات الاتصال الرسمية هي عبارة عن تجميع للآراء والتحليلات الشخصية وغير ملزمة. لا تشكل أي توصية للشراء أو البيع أو الدخول أو الخروج من سوق الأوراق المالية وسوق العملات المشفرة. كما أن جميع الأخبار والتحليلات المدرجة في الموقع والقنوات هي مجرد معلومات منشورة من مصادر رسمية وغير رسمية محلية وأجنبية، ومن الواضح أن مستخدمي المحتوى المذكور مسؤولون عن متابعة وضمان أصالة ودقة المواد. لذلك، مع إخلاء المسؤولية، يُعلن أن المسؤولية عن أي اتخاذ قرار وإجراء وأي ربح وخسارة محتملة في سوق رأس المال وسوق العملات المشفرة تقع على عاتق المتداول.