
CRV
Curve DAO Token
| تریدر | نوع سیگنال | حد سود/ضرر | زمان انتشار | مشاهده پیام |
|---|---|---|---|---|
خرید | حد سود: تعیین نشده حد ضرر: تعیین نشده | 26/12/2025 | ||
خرید | حد سود: تعیین نشده حد ضرر: تعیین نشده | 14/12/2025 | ||
خرید | حد سود: تعیین نشده حد ضرر: تعیین نشده | 6/12/2025 | ||
خرید | حد سود: تعیین نشده حد ضرر: تعیین نشده | 2/12/2025 | ||
خرید | حد سود: تعیین نشده حد ضرر: تعیین نشده | 30/11/2025 |


مخطط سعر Curve DAO Token
سود ثلاثة أشهر :
خلاصه سیگنالهای Curve DAO Token
سیگنالهای Curve DAO Token
مرشح
فرز الرسالة بناءً على
نوع التاجر
الإطار الزمني

Professional Analysis of CRV/USDT Price Movement
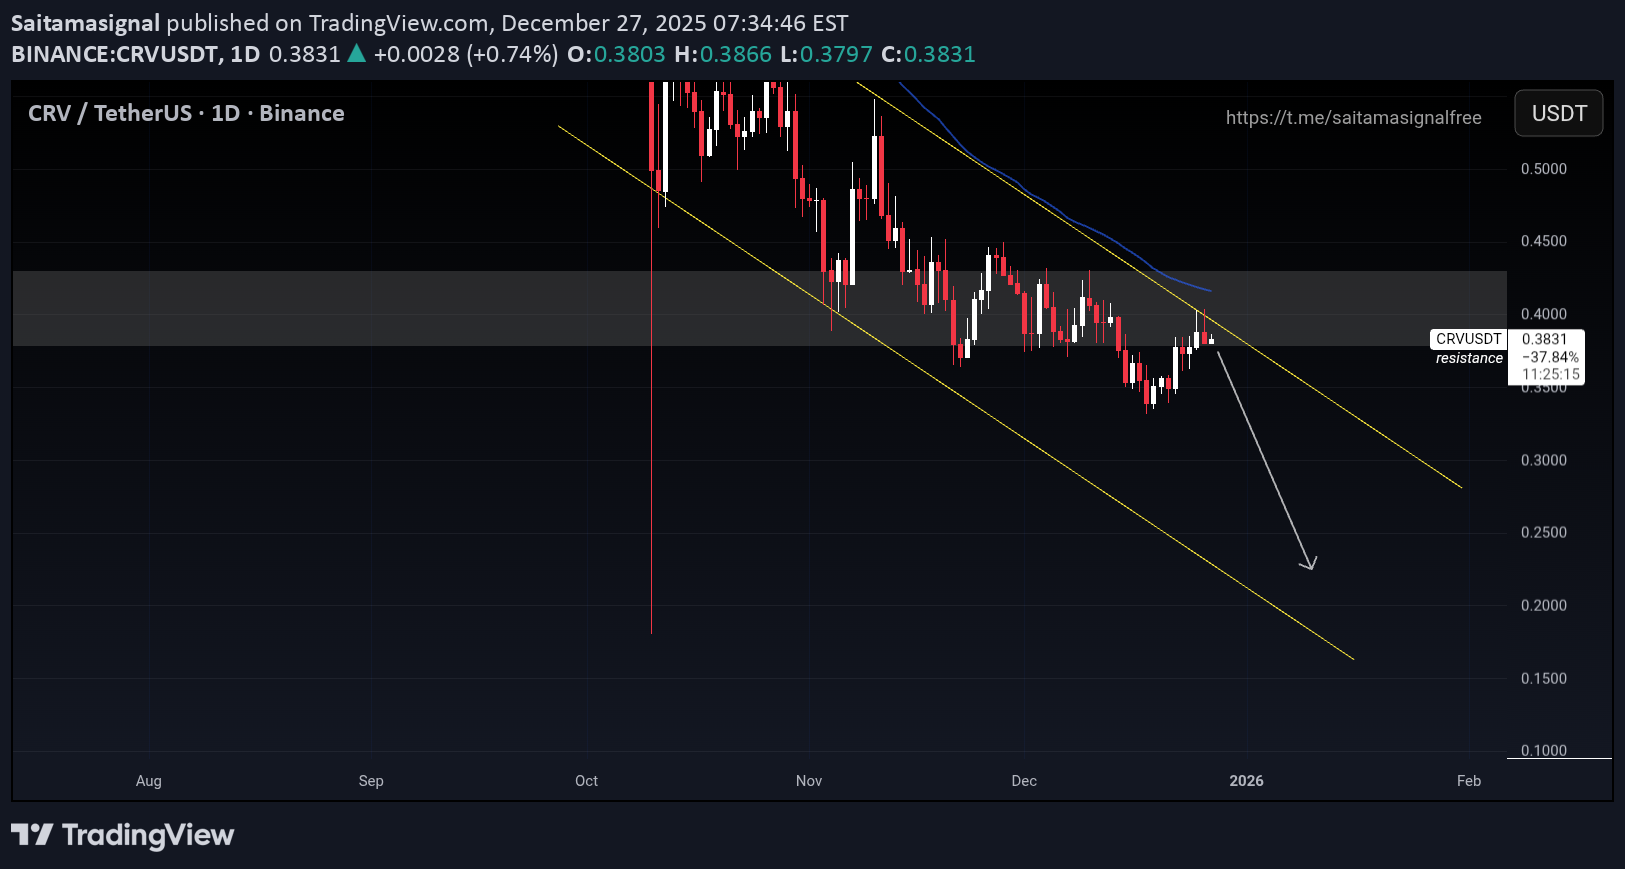
استنادًا إلى الرسم البیانی الیومی CRV/TetherUS على Binance، یبدو أن هذا الأصل یسیر فی اتجاه هبوطی واضح، ویتحرک داخل قناة هبوطیة منذ أکتوبر تقریبًا. التحلیل الفنی الرئیسی الاتجاه طویل المدى: یسیر زوج العملات المشفرة فی اتجاه هبوطی مستمر، ویتمیز بتکوین قمم منخفضة وأدنى مستویاته داخل قناة السعر المرئیة على الرسم البیانی. وتشیر المتوسطات المتحرکة طویلة المدى أیضًا إلى اتجاه ضعیف أو تنازلی. مستوى المقاومة الرئیسی: السعر الحالی یبلغ حوالی 0.3833 دولار ویقترب من خط اتجاه المقاومة العلوی للقناة. هذه المنطقة حاسمة. غالبًا ما تحدث زیادة العرض من البائعین عند مستویات المقاومة، مما یتسبب فی توقف السعر عن الارتفاع. فرصة الاختراق: إذا نجح CRV فی الاختراق والثبات فوق خط اتجاه المقاومة هذا، فستکون إشارة صعودیة أولیة تشیر إلى انعکاس محتمل للاتجاه على المدى القصیر أو على الأقل movement جانبیًا للتوطید. یمکن أن تکون الأهداف الصعودیة المحتملة التالیة فی مناطق سیولة أعلى، على سبیل المثال حول مستویات الأسعار السابقة أو المقاومة الهامة التالیة. أهمیة التأکید: سینتظر المتداولون المحترفون تأکیدًا واضحًا (مثل إغلاق شمعة یومیة فوق مستوى المقاومة أو إعادة اختبار ناجحة للدعم الجدید أثناء التراجع) قبل اتخاذ صفقات شراء کبیرة، حیث أن سوق العملات المشفرة معروف بتقلباته العالیة.

CRVUSDT BREAKOUT
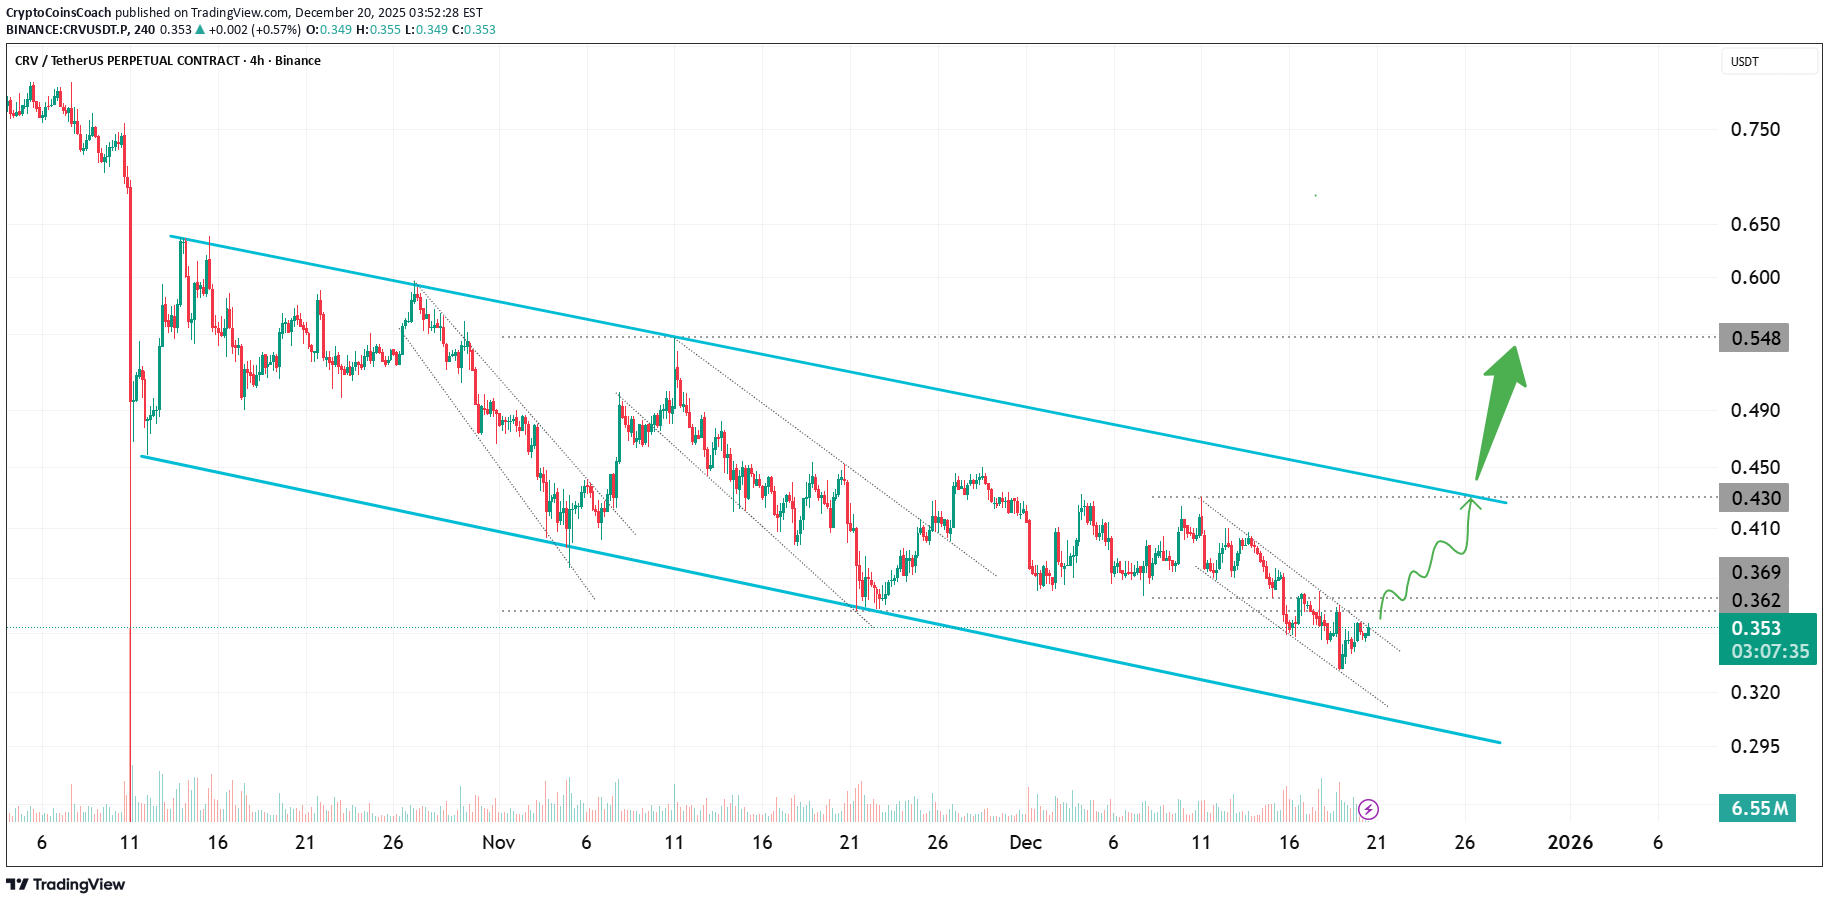
تم فتح مرکز شراء بعد اختراق خط الاتجاه الهابط. السعر ثابت فوق منطقة الاختراق. 🎯 الهدف: 0.430 🛡️ الإبطال: إغلاق شمعة الأربع ساعات أسفل خط الاتجاه / منطقة الدعم. یعتمد التداول على کسر خط الاتجاه + تأکید الدعم. إدارة المخاطر وفقا لذلک. #CRV #CRVUSDT #Long #CryptoTrade #Altcoins
تحلیل فوری CRV: فرصت خرید بعد از شکست خط روند!
فرقة بریده فی 15 دقیقة انهیار خط الاتجاه وإعادة الاختبار على مؤشر القوة النسبیة یمکن تجربتها
$CRV X= mrprofessoreXBT
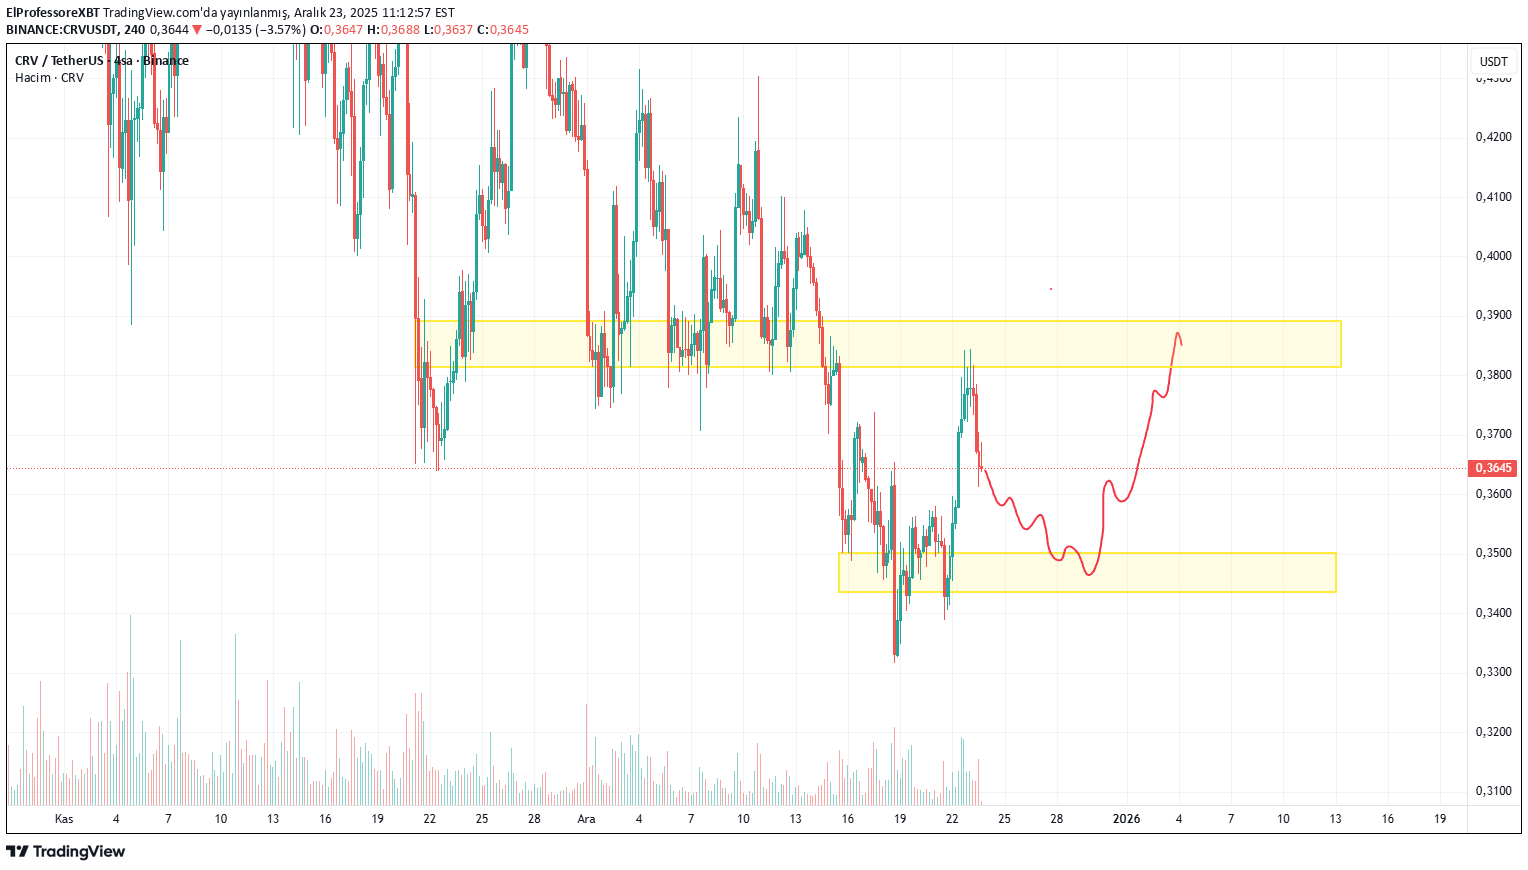
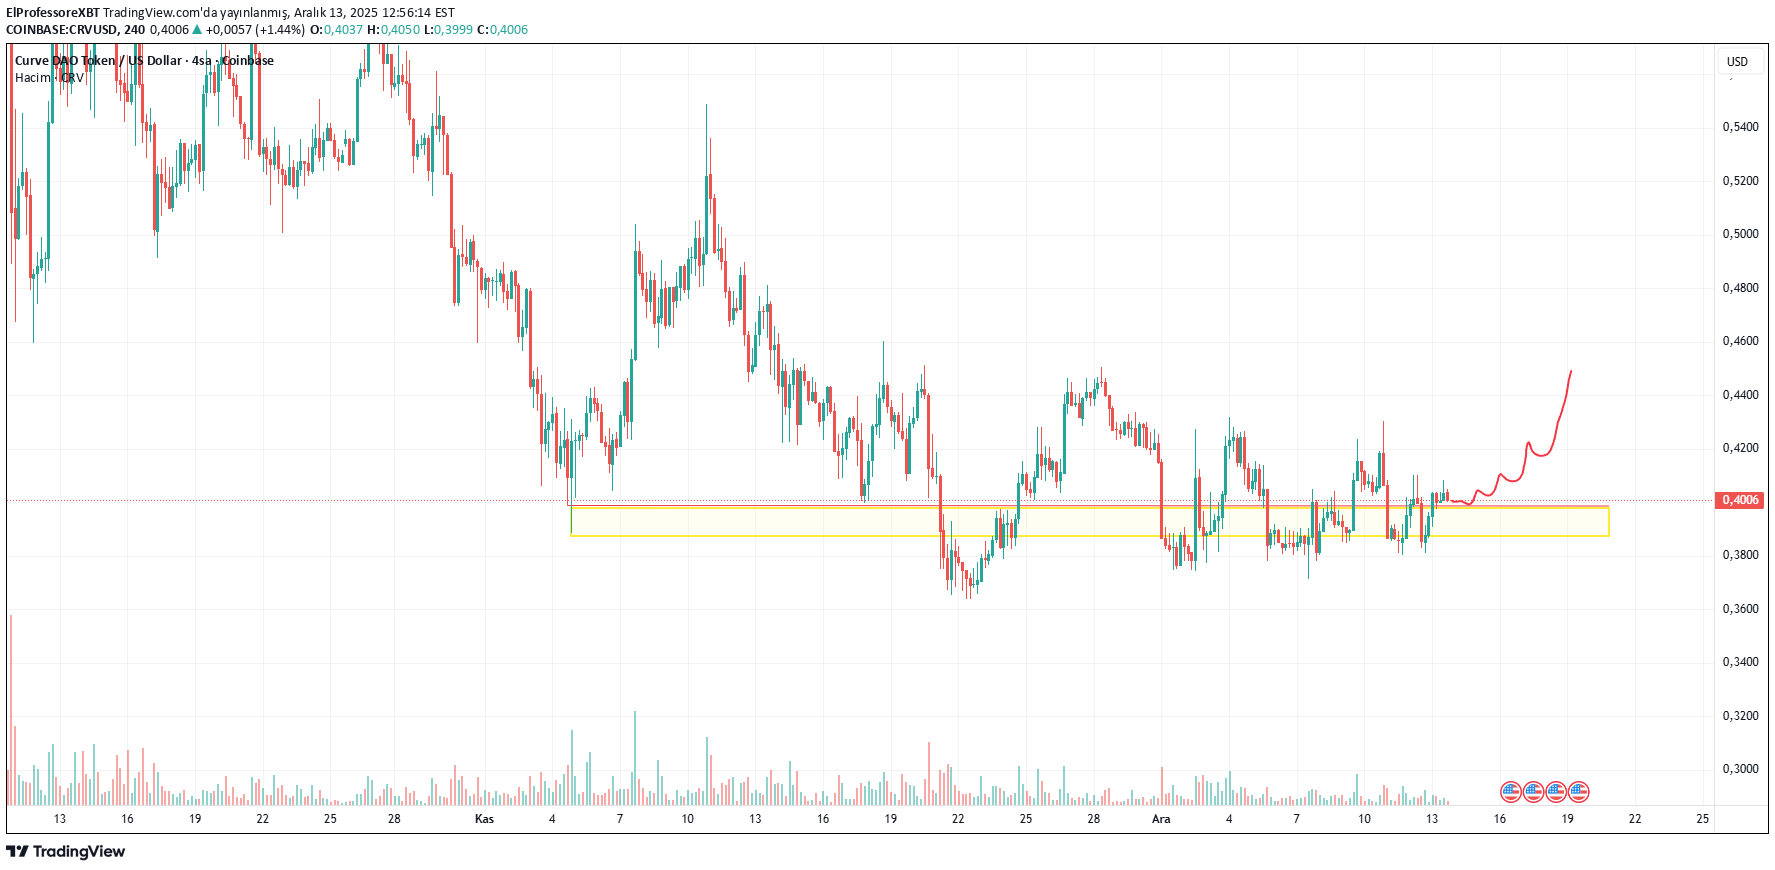
یتماسک السعر حالیًا داخل منطقة طلب محددة جیدًا، والتی أثبتت بالفعل أنها منطقة رد فعل قویة فی الماضی. بعد عملیات البیع الحادة، من الواضح أن الزخم الهبوطی یفقد قوته، ویقوم السوق الآن بتشکیل هیکل أساسی بدلاً من الاستمرار فی الانخفاض. وطالما أن منطقة الدعم السفلیة هذه صامدة، أتوقع تعزیز النطاق أولاً، یلیه اندفاع تدریجی نحو منطقة العرض العلیا. یشیر المستوى move المتوقع إلى موجة انتعاش محتملة، مع تشکل قیعان أعلى داخل النطاق - وهی علامة نموذجیة على التراکم. من المرجح أن یؤدی الاختراق النظیف والثبات فوق مستوى النطاق المتوسط إلى فتح الباب أمام مستوى move نحو منطقة المقاومة العلیا، حیث قد یتدخل البائعون مرة أخرى. وإلى أن یحدث ذلک، یظل هذا سیناریو صعودیًا قائمًا على الدعم، ولا یتم إبطاله إلا إذا فقد السعر منطقة الطلب ذات الحجم القوی. الصبر هو المفتاح هنا - یبدو الهیکل بناءًا طالما یتم احترام الدعم.
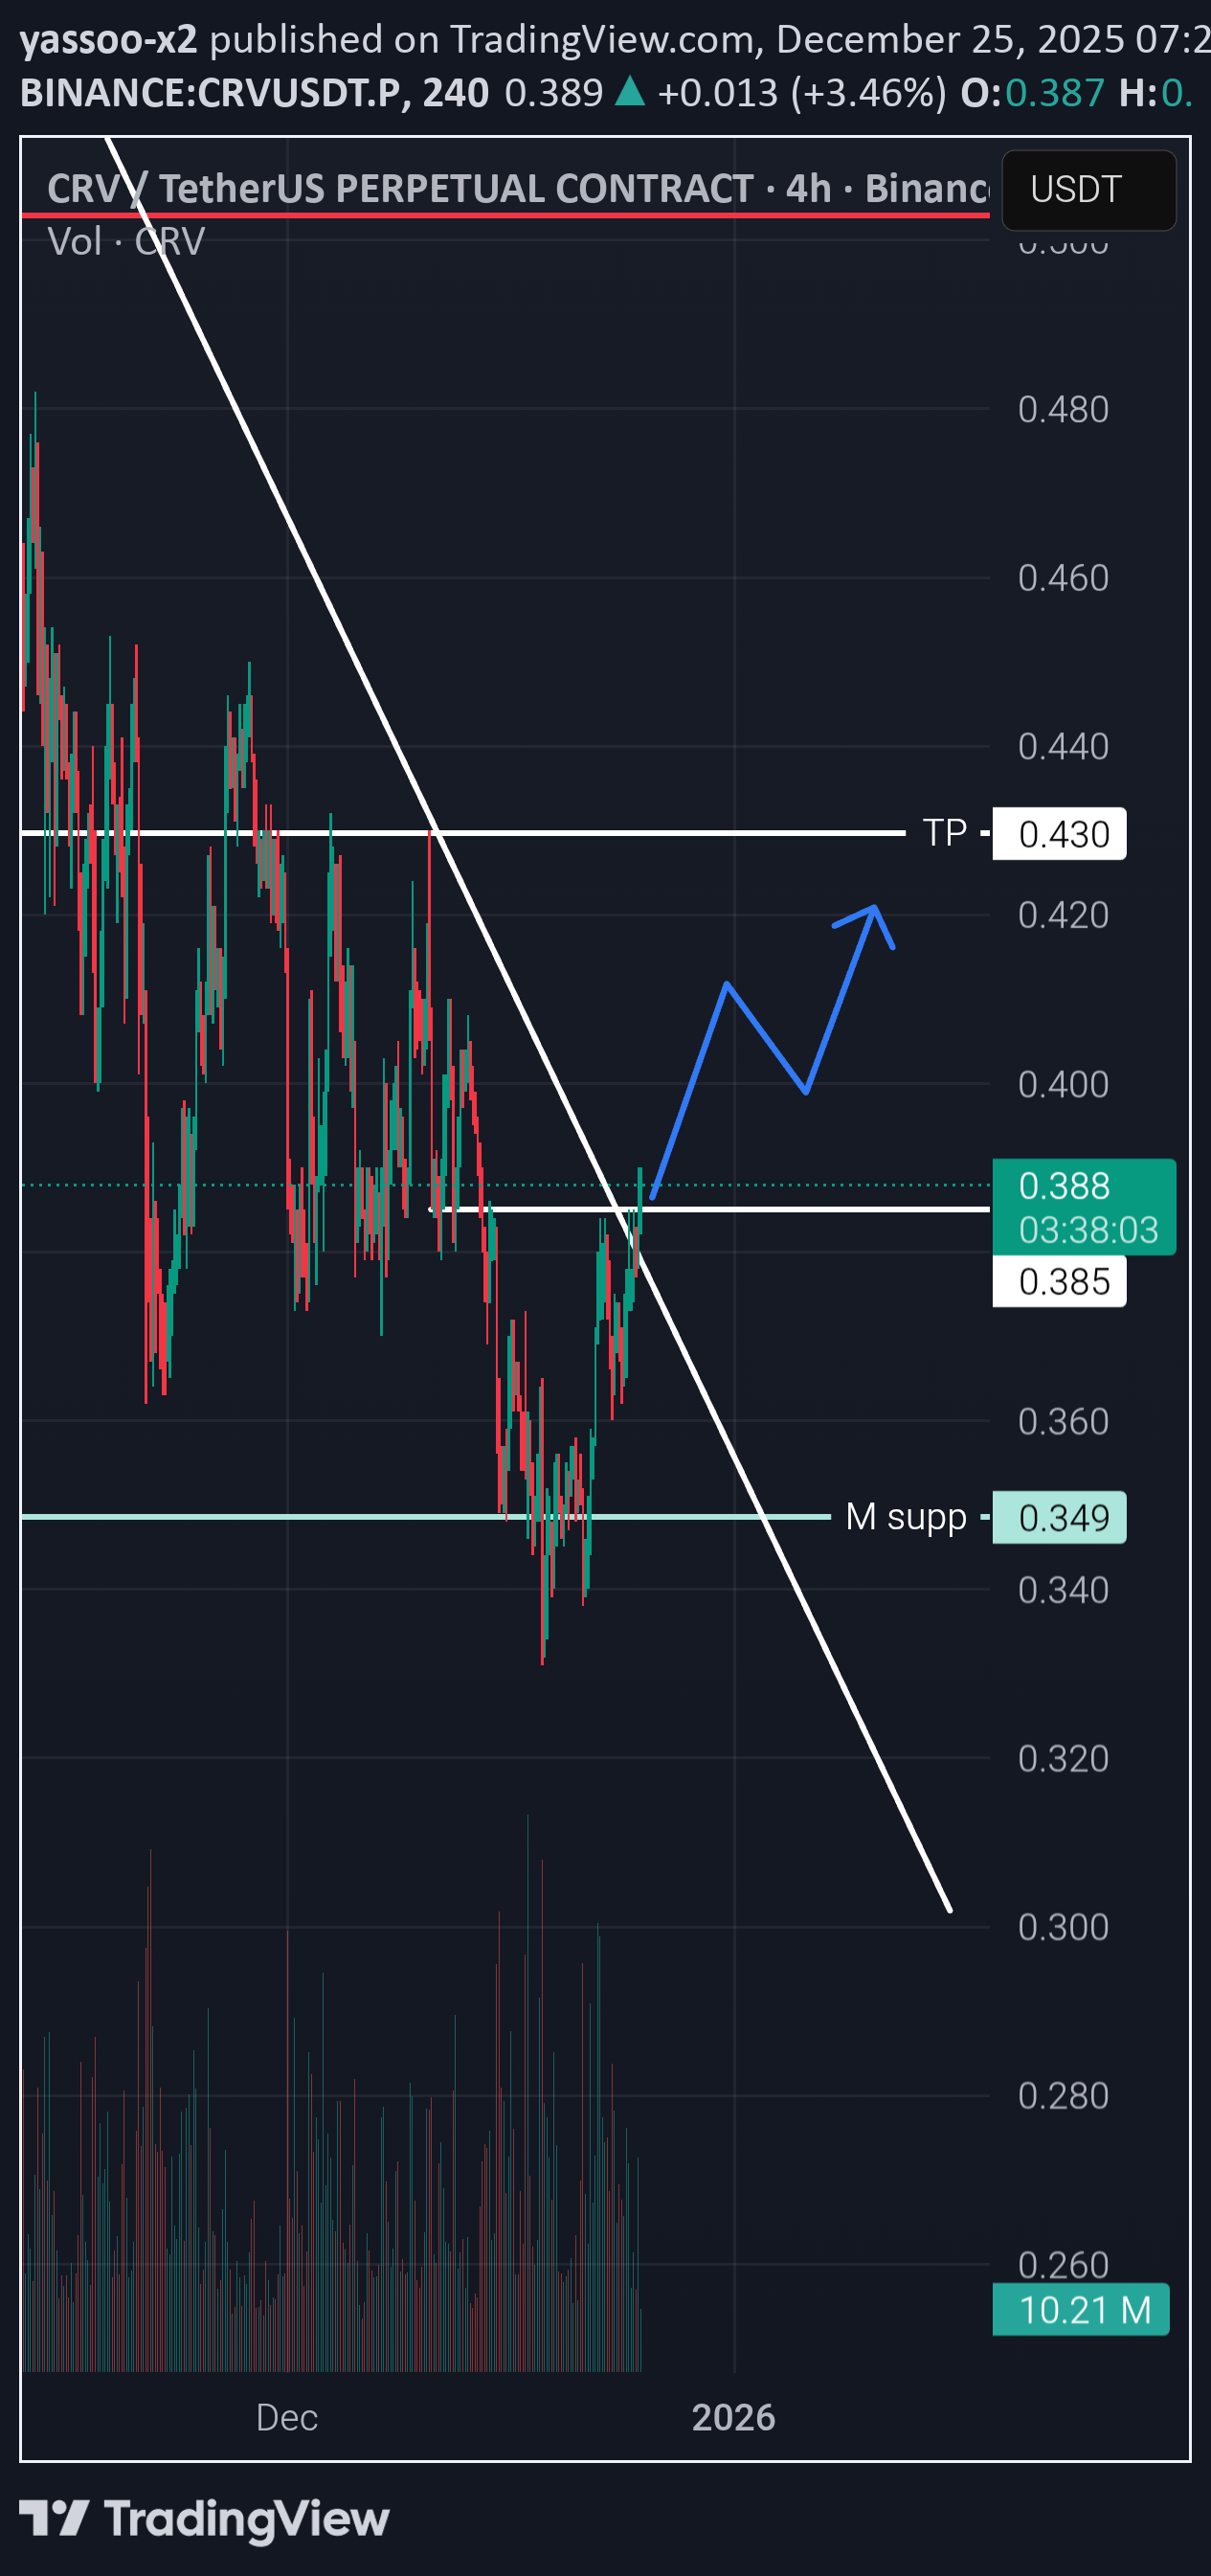
CRV Holding Descending Channel Support, Relief Move Possible
یتداول الزوج CRV داخل قناة هبوطیة محددة جیدًا لفترة طویلة، مما یعکس السیطرة الهبوطیة المستمرة. وصل السعر مؤخرًا إلى الحد السفلی لهذه القناة ویظهر الآن علامات الاستقرار، مما یشیر إلى أن ضغط البیع یتباطأ بالقرب من الدعم الرئیسی. یُظهر الهیکل الحالی أن السعر یحاول الوصول إلى أدنى مستویاته عند form بعد التفاعل من قاعدة القناة. إذا استمر CRV فی الثبات فوق هذا الحد الأدنى وعزز القبول، یصبح من الممکن حدوث راحة move نحو مقاومة القناة العلیا. تقع المنطقة الصعودیة الأولى major بالقرب من منطقة الرفض السابقة حول صفر نقطة four ثلاثة، تلیها مقاومة أعلى بالقرب من صفر نقطة خمسة وخمسة إذا تعزز الزخم. على الجانب الهبوطی، فإن الانهیار الواضح دون دعم القناة من شأنه أن یبطل سیناریو التخفیف ویفتح استمرار الاتجاه الهبوطی نحو مناطق الطلب المنخفض. یعتمد هذا الإعداد على دینامیکیات القناة التنازلیة، وسلوک رد الفعل الداعم، وتثبیت البنیة على المدى القصیر. یعد التأکید من خلال الثبات المستمر فوق الدعم أمرًا ضروریًا قبل توقع استمرار الاتجاه الصعودی.
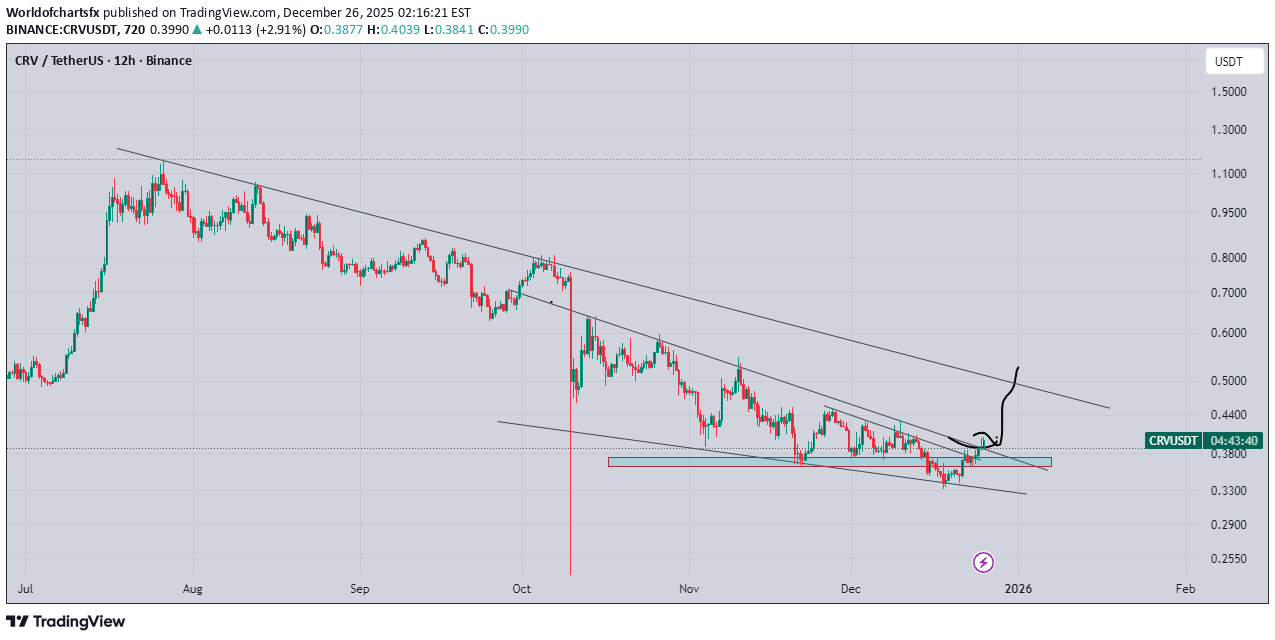
CRV/USDT: آیا این آلتکوین آماده انفجار است؟ تحلیل تخصصی حرکت نهنگها!
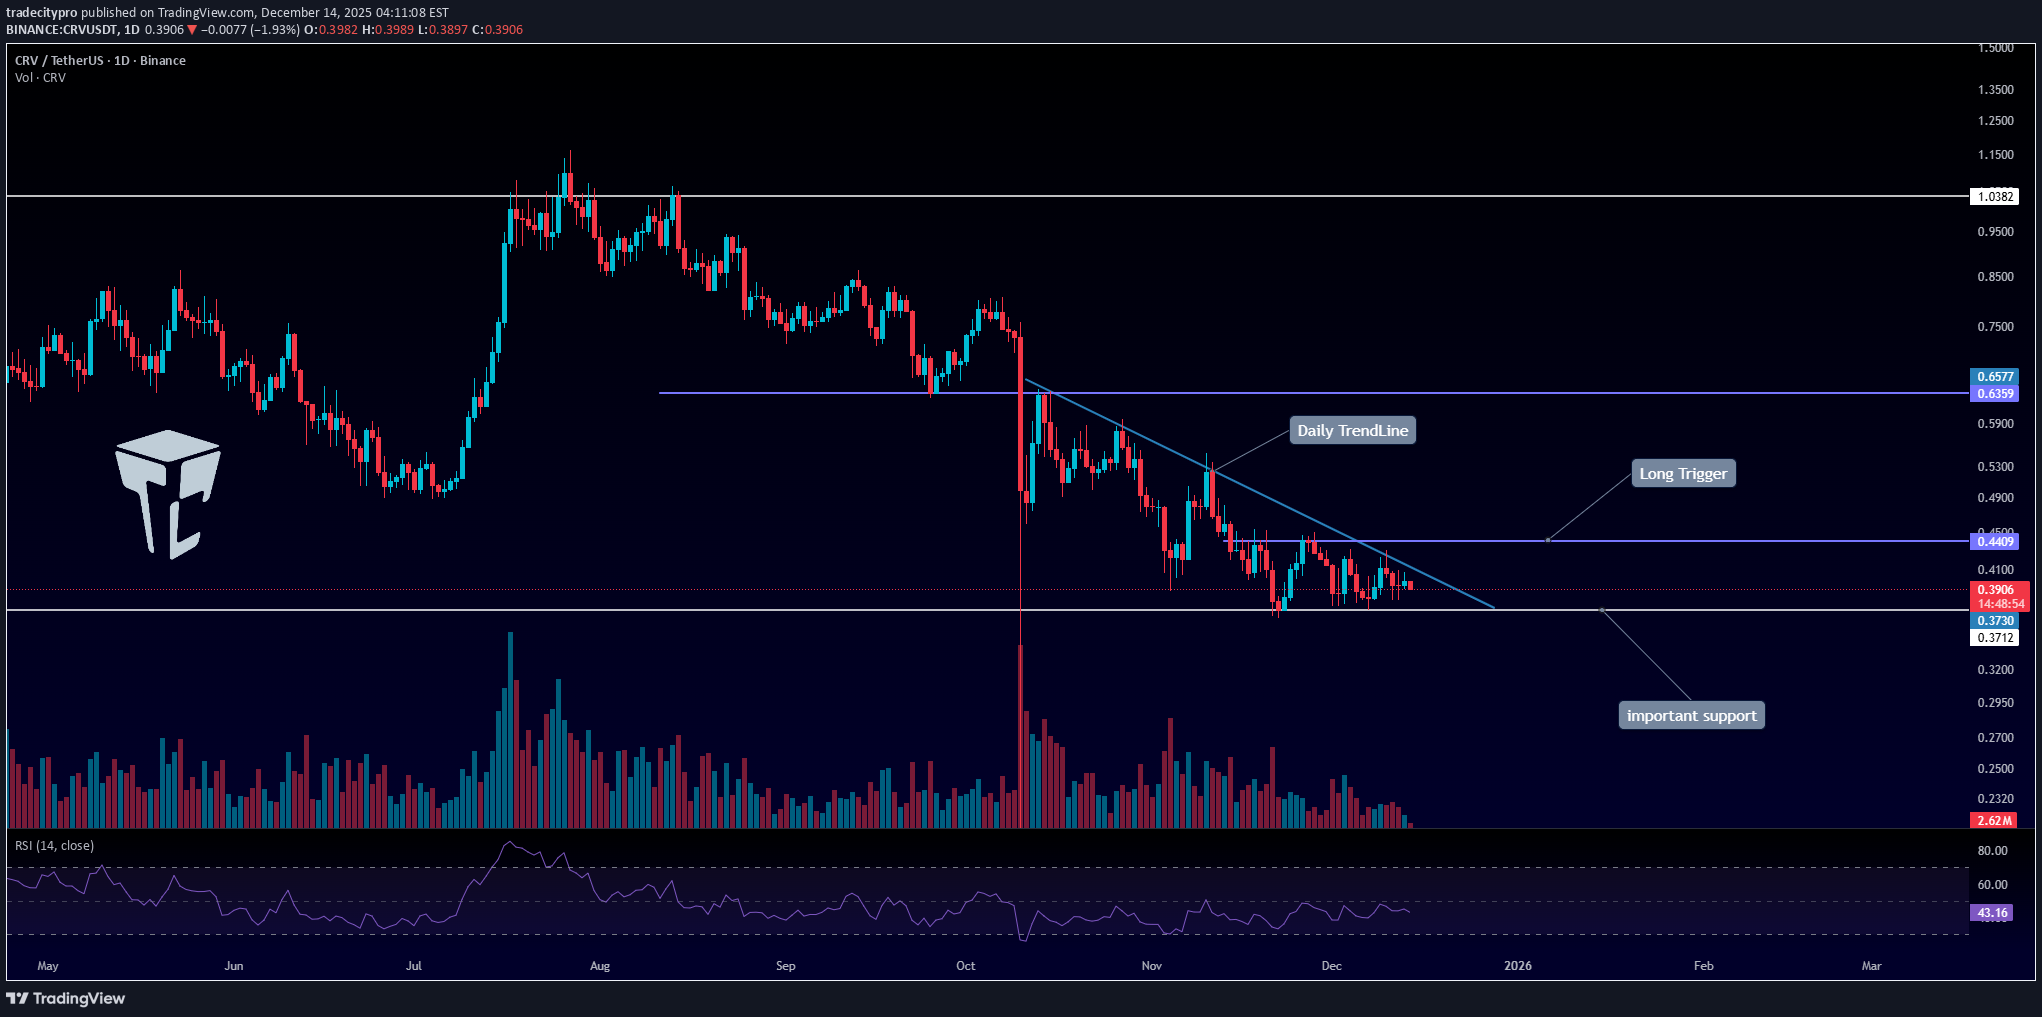
👋 مرحبًا بک فی TradeCityPro! دعونا move ننتقل إلى العملة المفضلة للحیتان الیوم، CRV، والتی تستخدم على نطاق واسع من قبل الحیتان Ethereum للتصویت على الحکم والمشارکة فی عملیات صنع القرار الرئیسیة. 🌐 Bitcoin نظرة عامة قبل أن نبدأ، اسمحوا لی أن أذکرک مرة أخرى أنه بناءً على طلبک، قمنا بنقل قسم التحلیل Bitcoin إلى تقریر یومی مخصص - مما یسمح لنا بتحلیل اتجاه Bitcoin وهیمنته ومعنویات السوق بشکل عام بعمق أکبر کل یوم. على الإطار الزمنی الیومی، بعد رفض السعر من 1.03 دولار، شهدنا تصحیحًا move واستقر السعر بهدوء عند مستوى الدعم 0.6359 دولار. بعد کسر هذا الدعم، انخفض السعر نحو مستوى الدعم 0.3712 دولار، ونقوم حالیًا بتشکیل قمم منخفضة، مما أدى إلى تشکیل خط اتجاه من النوع الانعکاسی. بالنسبة لصفقات الشراء، إذا تم کسر خط الاتجاه الیومی وتم تنشیط محفز 0.4409 دولار، فیمکننا أن نتطلع إلى فتح مرکز طویل عند اختراق هذا المستوى. بالنسبة لمراکز البیع، یتم تحدید محفزات الدخول لدینا بوضوح على الرسم البیانی. مع الاختراق إلى ما دون 0.3730 دولار، یمکننا فتح مرکز بیع، ویمکن أن یوفر الرفض من خط الاتجاه أیضًا محفزًا قصیرًا مبکرًا. 📝 الخواطر النهائیة حافظ على هدوئک، وتداول بحکمة، ودعنا نغتنم أفضل الفرص المتاحة فی السوق! یعکس هذا التحلیل آرائنا ولیس نصیحة مالیة. شارک أفکارک فی التعلیقات، ولا تنس مشارکة هذا التحلیل مع أصدقائک! ❤️

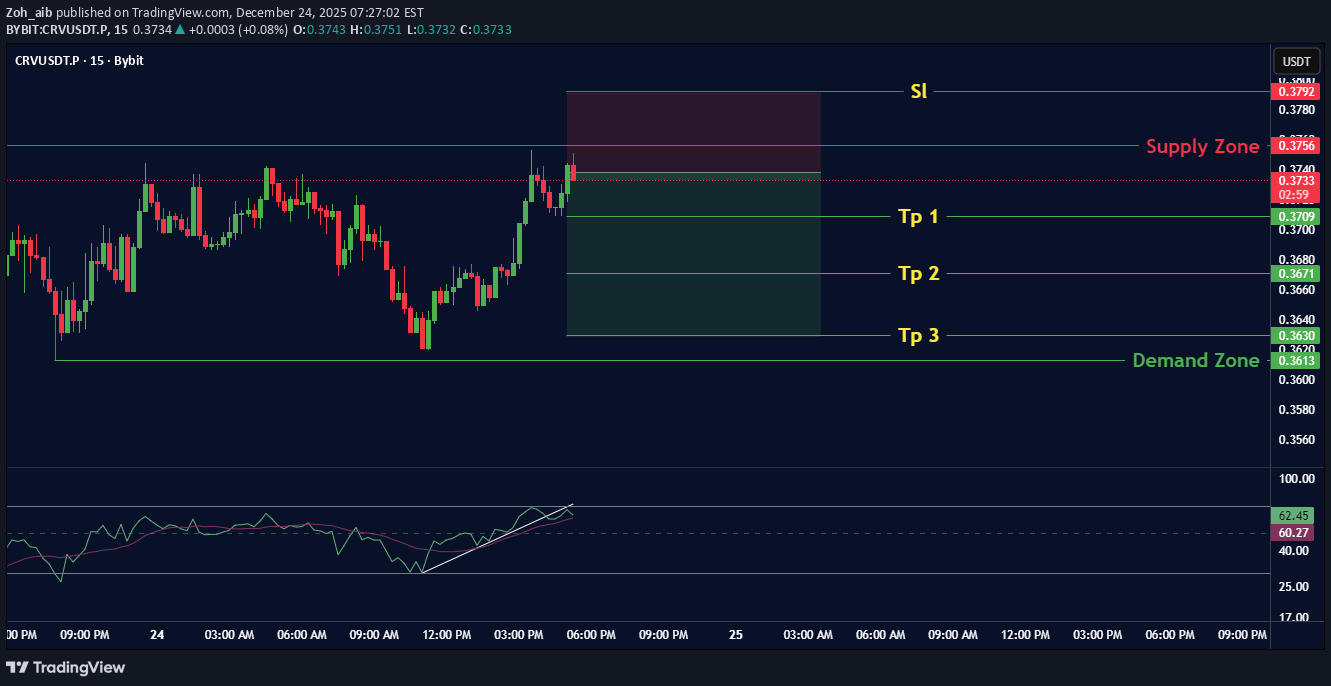
#CRV/USDT breakout alert!
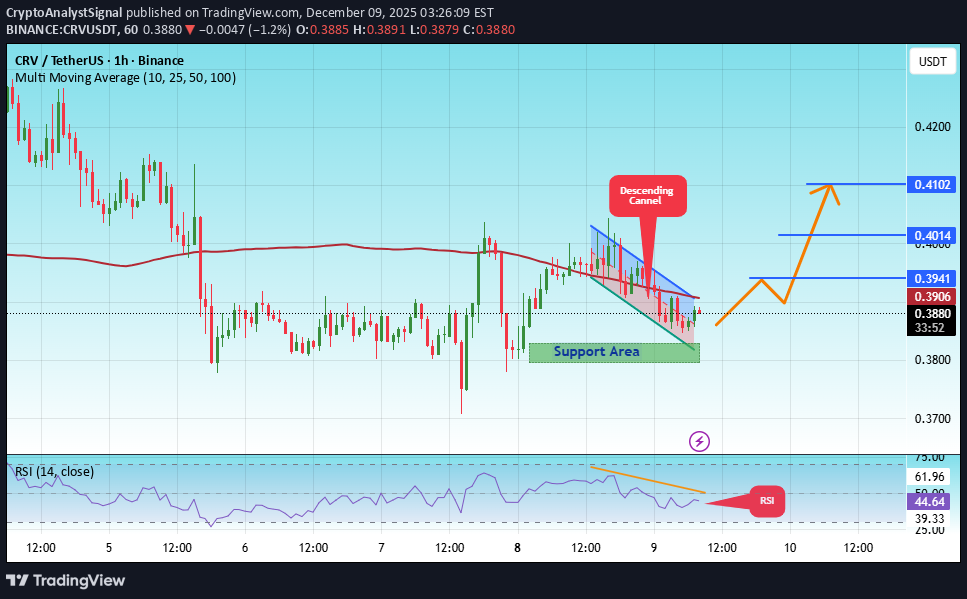
#CRV یتحرک السعر فی قناة هابطة على الإطار الزمنی لمدة ساعة واحدة. لقد وصل إلى الحد الأدنى ویتجه نحو الاختراق فوقه، مع توقع إعادة اختبار الحد العلوی. لدینا اتجاه هبوطی على مؤشر القوة النسبیة، والذی وصل بالقرب من الحد السفلی، ومن المتوقع حدوث ارتداد صعودی. توجد منطقة دعم رئیسیة باللون الأخضر عند 0.3800. وقد ارتد السعر من هذا المستوى عدة مرات ومن المتوقع أن یرتد مرة أخرى. لدینا اتجاه نحو الترسیخ فوق المتوسط المتحرک لـ 100 فترة، حیث نقترب منه، مما یدعم الاتجاه الصعودی movement. سعر الدخول: 0.3880 الهدف الأول: 0.3941 الهدف الثانی: 0.4014 الهدف الثالث: 0.4100 لا تنس مبدأ بسیطا: إدارة الأموال. ضع وقف الخسارة أسفل منطقة الدعم باللون الأخضر. لأیة أسئلة یرجى ترک تعلیق. شکرًا لک.
#CRV/USDT breakout alert!
#CRV یتحرک السعر فی قناة هابطة على الإطار الزمنی لمدة ساعة واحدة. لقد وصل إلى الحد الأدنى ویتجه نحو الاختراق فوقه، مع توقع إعادة اختبار الحد العلوی. لدینا اتجاه هبوطی على مؤشر القوة النسبیة، والذی وصل بالقرب من الحد السفلی، ومن المتوقع حدوث ارتداد صعودی. توجد منطقة دعم رئیسیة باللون الأخضر عند 0.3800. وقد ارتد السعر من هذا المستوى عدة مرات ومن المتوقع أن یرتد مرة أخرى. لدینا اتجاه نحو الترسیخ فوق المتوسط المتحرک لـ 100 فترة، حیث نقترب منه، مما یدعم الاتجاه الصعودی movement. سعر الدخول: 0.3880 الهدف الأول: 0.3941 الهدف الثانی: 0.4014 الهدف الثالث: 0.4100 لا تنس مبدأ بسیطا: إدارة الأموال. ضع وقف الخسارة أسفل منطقة الدعم باللون الأخضر. لأیة أسئلة یرجى ترک تعلیق. شکرًا لک.
إخلاء المسؤولية
أي محتوى ومواد مدرجة في موقع Sahmeto وقنوات الاتصال الرسمية هي عبارة عن تجميع للآراء والتحليلات الشخصية وغير ملزمة. لا تشكل أي توصية للشراء أو البيع أو الدخول أو الخروج من سوق الأوراق المالية وسوق العملات المشفرة. كما أن جميع الأخبار والتحليلات المدرجة في الموقع والقنوات هي مجرد معلومات منشورة من مصادر رسمية وغير رسمية محلية وأجنبية، ومن الواضح أن مستخدمي المحتوى المذكور مسؤولون عن متابعة وضمان أصالة ودقة المواد. لذلك، مع إخلاء المسؤولية، يُعلن أن المسؤولية عن أي اتخاذ قرار وإجراء وأي ربح وخسارة محتملة في سوق رأس المال وسوق العملات المشفرة تقع على عاتق المتداول.