
rylee2267
@t_rylee2267

Ne tavsiye etmek istersiniz?
önceki makale
پیام های تریدر
filtre
rylee2267
BTCUSDT

Bitcoin به نظر میرسد پس از تکمیل یک الگوی تکنیکالی کلاسیک، آماده یک تغییر قابل توجه است. قیمت اخیراً از یک سطح حیاتی عبور کرده و به نظر میرسد در حال آزمایش مجدد این آستانه است، حرکتی که اغلب نشاندهنده شتاب بیشتر است. اگر این الگو حفظ شود، ممکن است شاهد صعودی قوی به سمت اهداف بالاتر باشیم، احتمالاً فراتر از سطوح فعلی. مراقب نشانههای تأیید این روند باشید.
rylee2267
ANKRUSDT

بررسی نمودار روزانه ANKR/USDT: جفت ارز ANKR/USDT در بازه زمانی یک روزه، یک خط روند نزولی را نشان میدهد که از اوج خود در دسامبر 2024 امتداد مییابد. قیمت فعلی 0.020429 است که نشاندهنده افزایش 1.69 درصدی است. با در نظر گرفتن باندهای بولینگر و سیگنالهای خرید/فروش، نمودار حاکی از یک جهش کوتاه مدت احتمالی در نزدیکی سطوح حمایتی حیاتی است. برای اطلاعات بیشتر، نمودار را بررسی کنید!
rylee2267
VET/USDT

VeChain (VET) در نمودار هفتگی نشانههایی از حیات نشان میدهد. اخیراً با حجم قابل قبولی از یک مثلث نزولی بلندمدت عبور کرده است، که نشاندهنده احتمال تغییر روند است. قیمت در حال حاضر 0.02576 دلار است، کمی پایینتر از سطح شکست 0.02744 دلار. در حال بررسی یک تست مجدد از این سطح به عنوان حمایت هستیم - میتواند یک منطقه کلیدی برای دفاع گاوها (خریداران) باشد. اگر مومنتوم حفظ شود، مقاومت بعدی در حدود 0.034003 دلار است. اندیکاتورها سیگنالهای صعودی اولیه نشان میدهند، اما تأیید آنها کلیدی است. نظرتان چیست؟
rylee2267
ETH/USDT 1W - Reversal on the Horizon?
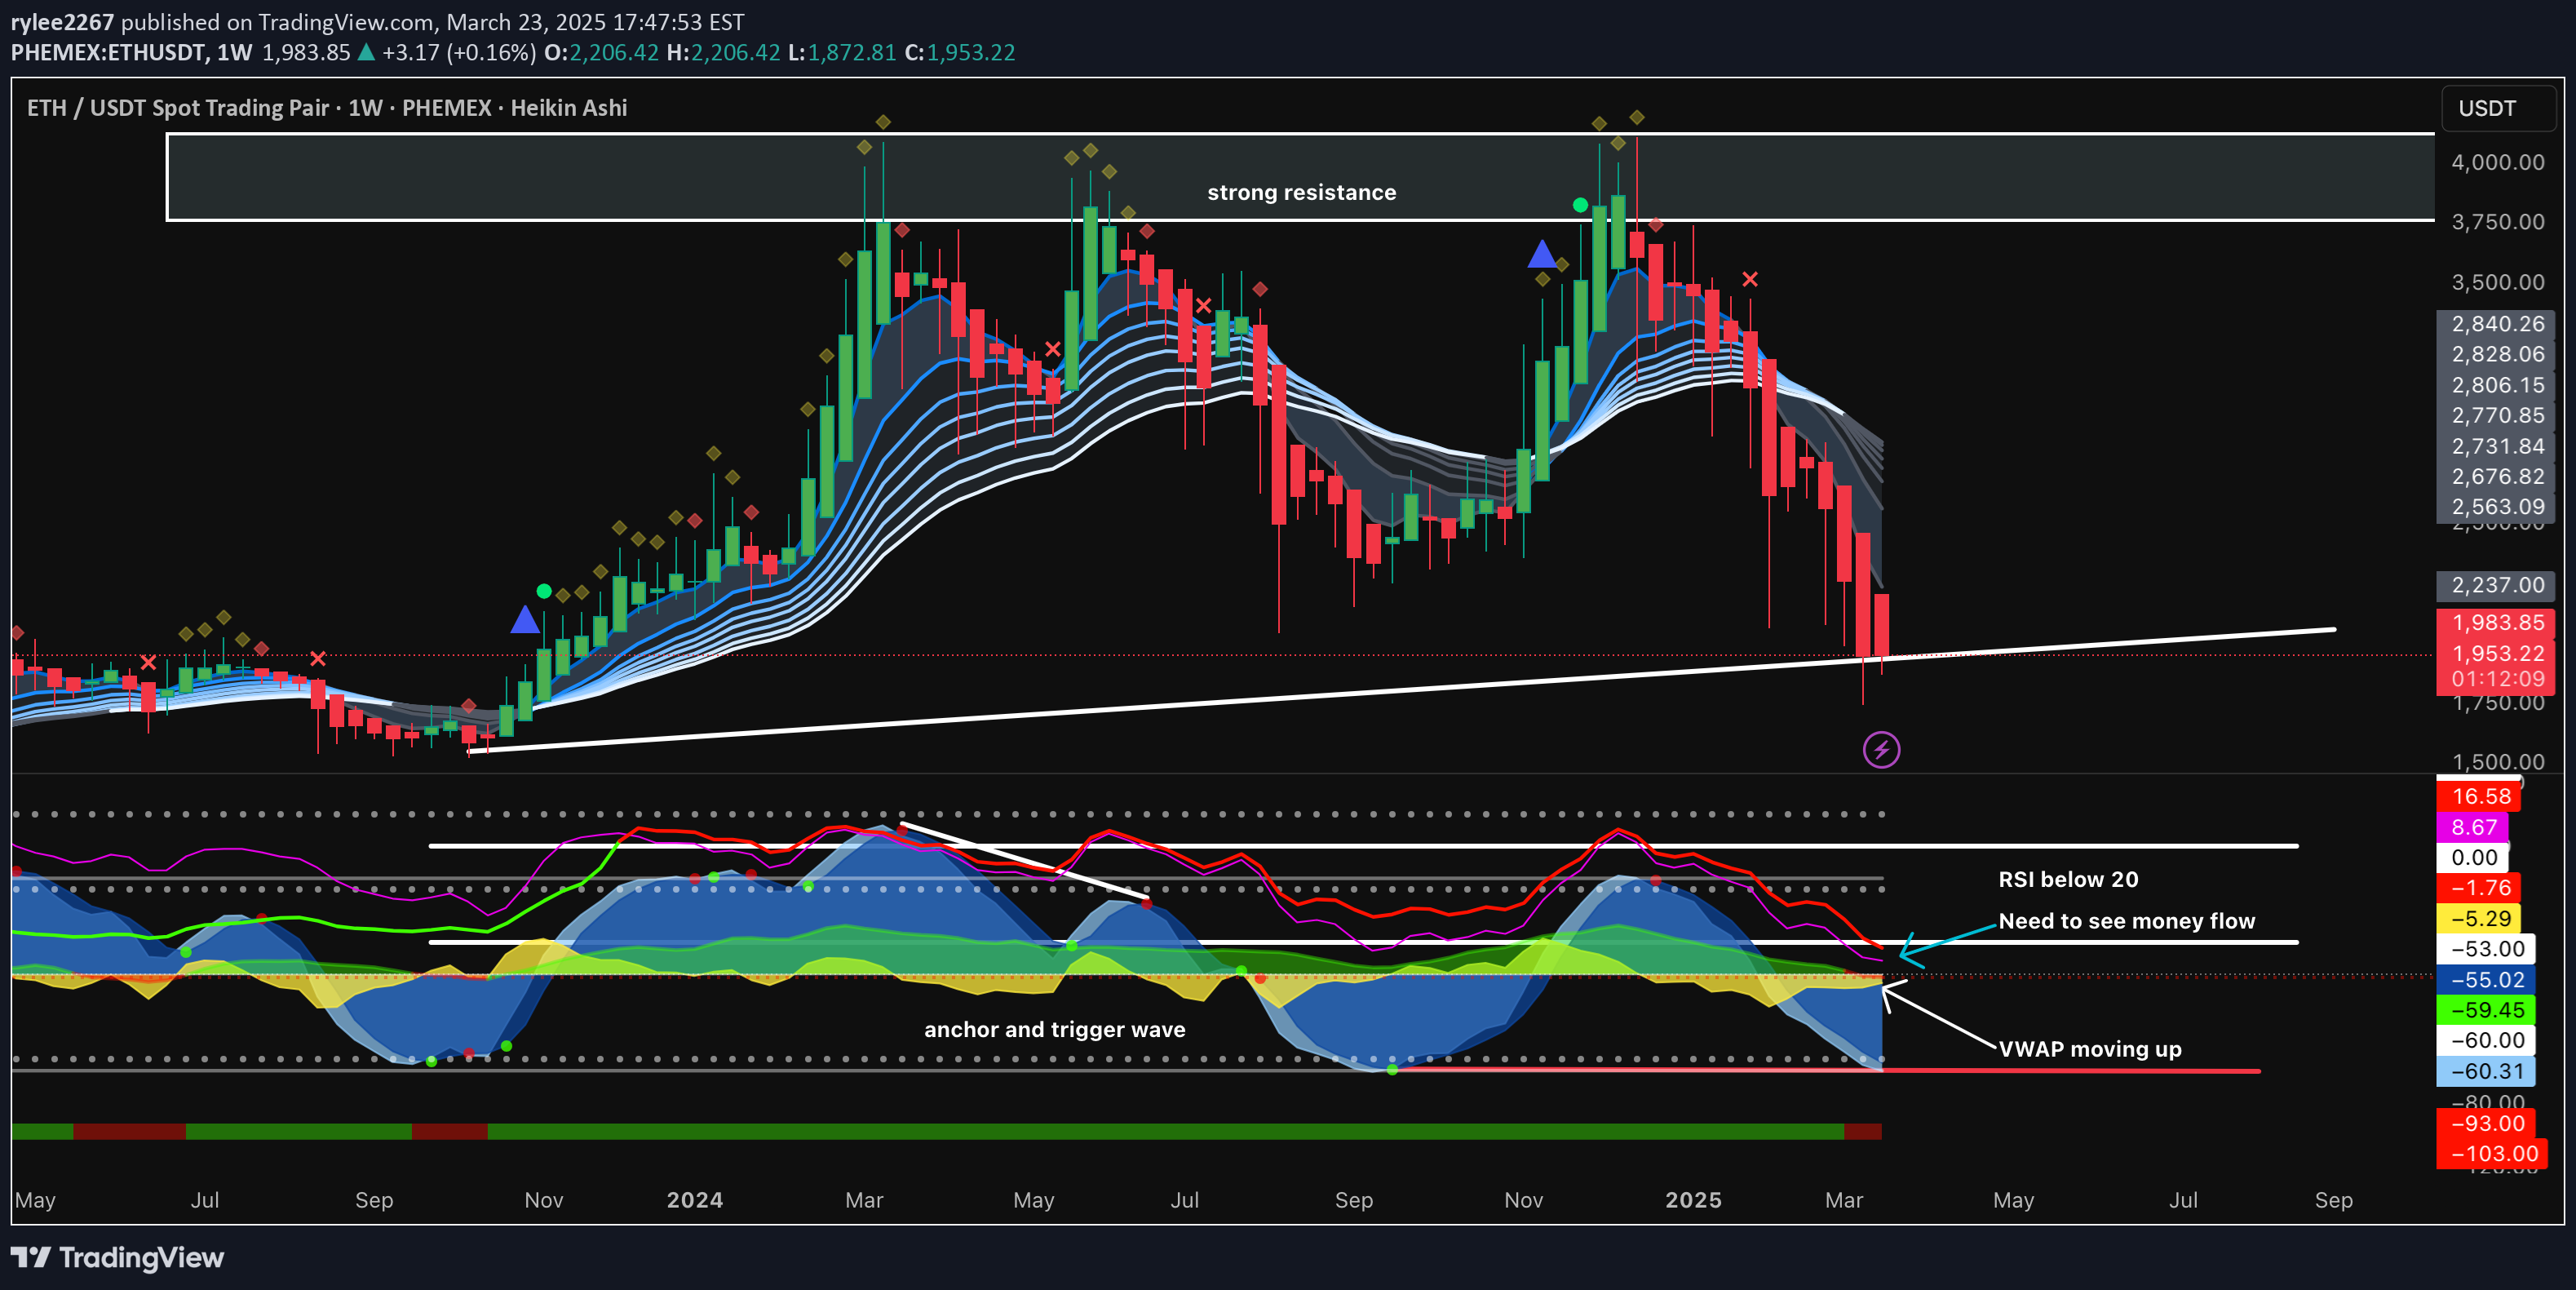
قیمت پس از یک کاهش شدید، به یک مقاومت قوی رسیده است. RSI زیر ۲۰ است که نشان دهنده شرایط فروش بیش از حد است. VWAP در حال افزایش است، اما flow باید وارد عمل شود. منتظر شکست یا رد شدن قیمت هستیم—نظر شما چیست؟
rylee2267
ETHUSD

قیمت فعلی: ETH در حال حاضر 1,955.56 دلار است که نسبت به هفته گذشته 4.66 درصد افزایش داشته است، اما نمودار نشان دهنده کاهش قابل توجهی از اوج خود در حدود 2,800 دلار در اواخر سال 2024 است. ابر ایچیموکو: قیمت به زیر ابر ایچیموکو شکسته است، که یک سیگنال نزولی است. خط تنکانسن (خط قرمز) و خط کیجونسن (خط آبی) به صورت نزولی همدیگر را قطع کردهاند و چیکو اسپن (خط تاخیری) زیر قیمت قرار دارد و روند نزولی را تأیید میکند. ابری که در پیش است در حال نازک شدن است، که میتواند نشاندهنده تغییر احتمالی روند باشد اگر قیمت دوباره آن را پس بگیرد، اما در حال حاضر، مومنتوم نزولی غالب است. خط روند: یک خط روند صعودی بلندمدت (خط سفید) وجود دارد که ETH از اواسط سال 2024 به آن احترام گذاشته است. قیمت در حال حاضر این خط روند را در محدوده 1,900 تا 2,000 دلار آزمایش میکند، که میتواند act به عنوان یک حمایت حیاتی عمل کند.
rylee2267
BTCUSDT

The chart is a weekly BTC/USD chart, and while the Ichimoku Cloud is present in the upper section, the lower panel appears to be a Market Cipher B indicator, which is an all-in-one oscillator combining multiple algorithms (WaveTrend, RSI, Money Flow, VWAP, etc.) to provide trading signals. Market Cipher B is known for its green and red dots, which signal potential buy and sell opportunities, and its money flow and VWAP components, which are explicitly mentioned in the chart's annotation.Key Observations:Price Action & Ichimoku Cloud The price has broken below the Ichimoku Cloud, a bearish signal. The Tenkan-sen (red line) and Kijun-sen (blue line) have crossed bearishly, and the Chikou Span (lagging line) is below the price, confirming the downtrend.The cloud ahead is thinning, which might indicate a potential shift in trend if the price can reclaim the cloud, but for now, the bearish momentum dominates.Market Cipher B Indicator (Lower Panel) The lower panel shows a Market Cipher B setup with money flow, VWAP, and momentum waves. The annotation "Positive Money Flow with VWAP moving up" suggests that despite the price decline, there’s underlying buying pressure or accumulation. However, this doesn’t align with the current price action, indicating a potential divergence.The chart shows red dots on the Market Cipher B panel, which typically signal bearish momentum or a potential downtrend continuation. These red dots often indicate that the price is moving lower, as confirmed by the recent red Heikin Ashi candles.The money flow indicator (likely the green and red waves in Market Cipher B) shows a positive trend, which could hint at a potential reversal if buying pressure increases. However, the price needs to confirm this with a break above key resistance levels.Heikin Ashi Candles The Heikin Ashi candles have turned red, indicating a strong bearish trend. The lack of significant wicks on these candles suggests that sellers are firmly in control.Support & Resistance Immediate support is around $82,000–$83,000, with a stronger support level at $75,000, which aligns with the lower edge of the Ichimoku Cloud projection.Resistance is at $87,000–$88,000, where the price previously struggled before the drop.Sentiment & Volume The sentiment bar on the right shows extreme fear (-93.00 to -103.00), which could indicate a capitulation point, often a precursor to a reversal. However, this also suggests that panic selling might push prices lower in the short term.Volume has been higher on red candles (down moves) compared to green candles (up moves), indicating stronger selling pressure.Updated TradingView PostBTC/USD (1W) - Market Cipher Signals Bearish Momentum, But Is a Reversal Brewing?Posted by [YourUsername] on Mar 23, 2025Hey traders, let’s dive into this weekly BTC/USD chart! We’ve got a mix of Ichimoku Cloud and Market Cipher B indicators giving us some interesting signals. OverviewBitcoin has dropped to $84,046.69, down 3.49% this week after peaking near $92,000 in early December 2024. The chart shows bearish momentum, but there are hints of underlying buying pressure that could signal a potential reversal. Let’s break it down.Key ObservationsIchimoku Cloud Breakdown BTC has broken below the Ichimoku Cloud, a strong bearish signal. The Tenkan-sen and Kijun-sen have crossed bearishly, and the Chikou Span is below the price, confirming the downtrend.The cloud ahead is thinning, which could mean a trend shift if the price reclaims it, but for now, bears are in control.Market Cipher B Insights The lower panel is showing Market Cipher B, with the note "Positive Money Flow with VWAP moving up." This suggests accumulation or buying pressure despite the price decline—a potential bullish divergence.However, we’re seeing red dots on the Market Cipher B indicator, which typically signal bearish momentum. This aligns with the recent price drop and red Heikin Ashi candles, indicating that sellers are still dominant.The money flow (likely the green/red waves in Market Cipher B) is trending positively, which could hint at a reversal if the price confirms with a break above resistance. Keep an eye on this divergence!Heikin Ashi Trend The Heikin Ashi candles are red with minimal wicks, showing strong bearish momentum. There’s little sign of buyer pushback at the moment.Support & Resistance Support is at $82,000–$83,000, with a stronger level at $75,000 (near the lower edge of the Ichimoku Cloud projection).Resistance sits at $87,000–$88,000, a key level to watch for any bullish reversal.Sentiment & Volume Sentiment is in extreme fear (-93.00 to -103.00), which could signal capitulation and a potential bottom. However, it also means panic selling might drive prices lower in the short term.Volume is higher on down moves (red candles), confirming selling pressure.My TakeThe bearish signals from the Ichimoku Cloud and Market Cipher B’s red dots suggest more downside in the short term, potentially testing $75,000 if $82,000 support breaks. However, the positive money flow and VWAP trend in Market Cipher B hint at underlying buying pressure, which could set the stage for a reversal if the price can break above $88,000 with strong volume. For now, I’m leaning bearish but watching for signs of a bottom.
Sorumluluk Reddi
Sahmeto'nun web sitesinde ve resmi iletişim kanallarında yer alan herhangi bir içerik ve materyal, kişisel görüşlerin ve analizlerin bir derlemesidir ve bağlayıcı değildir. Borsa ve kripto para piyasasına alım, satım, giriş veya çıkış için herhangi bir tavsiye oluşturmazlar. Ayrıca, web sitesinde ve kanallarda yer alan tüm haberler ve analizler, yalnızca resmi ve gayri resmi yerli ve yabancı kaynaklardan yeniden yayınlanan bilgilerdir ve söz konusu içeriğin kullanıcılarının materyallerin orijinalliğini ve doğruluğunu takip etmekten ve sağlamaktan sorumlu olduğu açıktır. Bu nedenle, sorumluluk reddedilirken, sermaye piyasası ve kripto para piyasasındaki herhangi bir karar verme, eylem ve olası kar ve zarar sorumluluğunun yatırımcıya ait olduğu beyan edilir.