
readCrypto
@t_readCrypto

Ne tavsiye etmek istersiniz?
önceki makale
پیام های تریدر
filtre
readCrypto
Trading Methods to Increase Your Coin (Token) Holdings

Merhaba tüccar arkadaşlar! En güncel bilgilere hızlı bir şekilde ulaşmak için bizi takip edin. İyi günler! ------------------------------------- Kârları temsil eden madeni paraları (jetonları) elinizde tutarak madeni para (token) varlıklarınızı artırmak, ondalık sayıların işlem gördüğü yatırım piyasalarında yararlı bir yöntemdir. Bu yöntemi kullanmak için günlük ticarete aşina olmak avantajlıdır. Vadeli işlem ticaretine aşina olmak aynı zamanda ilkelerin anlaşılmasını da kolaylaştıracaktır. - Ticaret prensibi basittir. 1. Satın alma fiyatına göre bir kâr elde edilirse, kâra karşılık gelen parayı (token) korumak için orijinal satın alma tutarını satın. 2. Satın alma fiyatına göre kar elde ediliyorsa, fiyat düşmeye başlamadan önce mevcut coini (token) satın ve ardından elinizdeki coin (token) sayısını artırmak için tutarı uygun fiyattan satın. - (ETHUSDT 1 boyutlu grafik) Temel ticaret yöntemi DOM(-60) ~ HA-Düşük aralığında satın almak ve HA-Yüksek ~ DOM(60) aralığında satmaktır. Bu temel ticaret yöntemini kullanarak kara karşılık gelen jeton (jeton) sayısını artırabilirsiniz. Ancak, 1 boyutlu grafik hareketlerine dayalı ticaret yapmak zor olduğundan, daha düşük bir zaman dilimi grafiğinde (örneğin, 15m, 30m) ticaret yapılması tavsiye edilir. - (15m tablosu) 15m grafiğindeki temel ticaret yöntemini kullanarak ticaret yapabilirsiniz. Ancak, HA-Yüksek ~ DOM(60) aralığı düştüğünde satış yapın ve coin (token) varlıklarınızı artırmak için DOM(-60) ve HA-Düşük göstergeleri buluştuğunda satın alın. Bu nedenle vadeli işlemlerde UZUN ve KISA pozisyonları anlamak önemlidir. İlk başta, madeni para (token) varlıklarınızı bir anda büyük ölçüde artırmaya çalışmamak en iyisidir. Bunun nedeni, henüz ticaret konusunda rahat değilseniz, istenmeyen ticaretler yapabilmenizdir. - Fiyat yükseldiğinde StochRSI, TC ve OBV göstergeleri de yükseliş eğilimi gösterecek. Şu anda StochRSI göstergesi aşırı alım bölgesine girmemelidir. TC göstergesi 0'ın üzerinde kalmalıdır. OBV göstergesi Yüksek Çizginin üzerinde kalmalıdır. Durum böyle değilse, yükseliş trendinin sürdürülmesinin zor olması muhtemeldir, bu nedenle işlem yaparken dikkatli olunması tavsiye edilir. - Tersine, fiyat düşerken StochRSI, TC ve OBV göstergeleri de düşüş eğilimi gösterecektir. Bu durumda TC göstergesi 0'ın altında kalmalıdır. OBV göstergesi Düşük Çizginin altında kalmalıdır. StochRSI göstergesi yalnızca trend yukarı yönlü değilse geçerlidir. - Bir işlemin zamanlamasını belirlerken, fiyat bölümünde görüntülenen göstergelerin destek seviyelerinin yanı sıra yardımcı göstergelerin yükseliş ve düşüş trendleri sırasındaki hareketlerini de kontrol edin. Yani alım satımda en önemli faktör fiyat bölümündeki göstergelerin yatay çizgiye yakın destek sağlayıp sağlamadığıdır. Kârın yalnızca 1 jeton (token) kadar artması önemli bir ticaret stratejisi değildir. Bununla birlikte, çok sayıda işlem yoluyla kârı temsil eden madeni paraların (jetonların) sayısının arttırılması, sonuçta sıfır satın alma ilkesiyle madeni paraların (jetonların) sayısını arttırır ve mevcut yatırım fonlarıyla işlem yapma yükünü azaltır. Yatırım tutarınız ne olursa olsun, karı temsil eden coin (token) sayısını artırmak, uzun vadede ciddi kazançlar sağlayabilecek bir yöntemdir. Nakit kar elde etmek için tüm karların alınıp satılması şeklindeki temel ticaret yöntemi daha iyi bir seçenek olabilir. Ancak yeni bir işleme başlarken kâr garantisi olmadığından yeni işlemlerin yükünün artması muhtemeldir. Ancak karı temsil eden coin (token) sayısının arttırılması bu yükü azaltır. Bunun nedeni, alım satımın yeni bir işlem başlatmak yerine mevcut varlıklar (coinler, tokenler) aracılığıyla gerçekleştirilmesidir. - Fiyatın düşmesini beklediğiniz için mevcut bir coini (token) sattığınız ve daha sonra onu makul bir fiyattan geri almaya çalıştığınızda fiyatın düşmediğini fark ettiğiniz durumlar olabilir. Bu riskleri azaltmak için 1B grafikteki StochRSI, TC ve OBV gibi yardımcı göstergelerin hareketlerini izlemelisiniz. Başka bir deyişle, fiyat yükseliş eğilimindeyken değil, düşüş eğilimindeyken satıp sonra satın almak daha iyidir. - Okuduğunuz için teşekkür ederiz. Başarılı ticaretler dilerim. --------------------------------------------------
readCrypto
Happy New Year!

Hello, traders! If you "Follow" us, you'll always get the latest information quickly. Have a great day. ------------------------------------- (BTCUSDT 12M Chart) The pattern of a 3-year uptrend and a 1-year downtrend appears to have undergone a slight change, with the 2025 bearish candlestick closing. The key areas to consider are the 69K-73K range and the 42K-44K range. Prices below the 42K-44K range are expected to be unseen again. Therefore, as the price approaches these levels, it's a good time to buy from a long-term perspective. If the price declines near the Fibonacci level of 1.618 (89050.0), it could touch the 69K-73K range. However, just as it failed to reach the expected target level of 2.618 (133889.92), the decline could also fall short of the 69K-73K range. Therefore, if the price declines from 1.618 (89050.0), we need to check for support near 1.414 (79902.66). Considering the previous pattern of three-year upswings and one-year downswings, 2026 is expected to be a challenging year, so caution is advised when trading. The Fibonacci ratios currently displayed on the chart are based on the second wave. Therefore, the Fibonacci level 3.618 (178729.84), which appears to be the end of the second wave, is expected to be the target area for the next bullish trend. - (1M chart) Since the HA-High indicator on the 1M chart formed at 110105.69, a decline is likely until it meets the DOM (-60) or HA-Low indicators. Currently, the price is positioned near the StochRSI 50 indicator and the M-Signal indicator on the 1M chart, and the StochRSI 20 indicator is showing signs of forming a new line. Therefore, support near the Fibonacci level 1.618 (89050.0) is crucial. If the price declines, the DOM (-60) indicator and the HA-Low indicator are expected to form a low soon. Therefore, we need to check for support near the previously mentioned levels: 1st: Fibonacci 1.414 (79902.66), 2nd: 69K ~ 73499.86. For the price to rise at a key point or range and continue the uptrend, the StochRSI, TC, and OBV indicators must show upward trends. Currently, the StochRSI indicator is showing signs of entering an oversold zone, the TC indicator is showing a downward trend below 0, and the OBV indicator is showing a downward trend between the Low Line and High Line. - (1W Chart) Since this is currently a volatile week, we need to monitor the movements below this week. The next volatile week is expected to occur around the week of January 26th. Therefore, the key is whether the price can rise along the uptrend line and remain above the M-Signal indicator on the 1M chart. If it fails to do so and falls, a downward trend is expected, as mentioned earlier. My basic trading strategy is to buy in the DOM(-60) ~ HA-Low range and sell in the HA-High ~ DOM(60) range. Therefore, a decline in the HA-High ~ DOM(60) range can be considered a normal decline, and it is difficult to determine a buy point at this time. Therefore, I recommend waiting until the DOM(-60) or HA-Low indicators are met. - (1D Chart) The HA-Low indicator on the 1D chart is forming at 87944.84, so the key question is whether it can find support near this level and rise. However, since the M-Signal indicator on the 1M chart is passing, it's crucial to see if the price can rise above it and maintain its upward momentum. Including these factors, a rise in the 84739.74 ~ 93.5K range is highly likely to trigger an uptrend. The next period of volatility is expected to be around January 10th, so we should monitor whether the price rises along the rising trendline (1) after this period. We should also monitor whether the price can break above the rising trendline (2). The TC indicator is above zero, and the OBV indicator is rising above the High Line to see if it can be sustained. The StochRSI indicator is falling in the overbought zone. Therefore, I believe that for the uptrend to continue, the StochRSI, TC, and OBV indicators must show upward trends. If the price finds support in the 84739.74 to 87944.84 range (DOM(-60) to HA-Low range on the 1D chart) and rises, and the StochRSI, TC, and OBV indicators show upward trends, the uptrend is expected to continue. As mentioned in the 12M chart explanation, this year is expected to be a difficult year. Therefore, when trading spot, it's important to increase the number of coins (tokens) corresponding to profits. When trading futures, it's important to minimize losses by trading short positions. This will prevent you from missing opportunities due to insufficient funds when the trend turns upward. It's best to increase the number of coins (tokens) representing profit during a stepwise downtrend. This is because a stepwise downtrend usually ends in an uptrend. A stepwise downtrend occurs when the price falls between DOM (-60) and HA-Low. However, because it's difficult to predict the end of a downtrend, you must carefully distribute your purchase amounts. Furthermore, when profit is generated by each purchase price, you should sell the amount equal to the purchase price, leaving the coins (tokens) representing profit. This will quickly convert to profit when the price rises. - Thank you for reading to the end. We wish you successful trading. --------------------------------------------------#BTCUSDT The key is whether the price can rise above the M-Signal indicator on the 1M chart and maintain its upward momentum. To sustain the uptrend by breaking above a key point or range, the StochRSI, TC, and OBV indicators must show upward trends. We need to see if the price can rise along the uptrend line and rise above the M-Signal indicator on the 1W chart. The key is whether the price can find support near 89294.25 and rise above the left Fibonacci level of 3 (92026.52) to 3.14 (93570.28). Currently, the StochRSI indicator is in an overbought zone, so upside is likely to be limited. Since the TC indicator has reached its all-time high, there's a high possibility of a decline soon. Therefore, I believe the support level around 89294.25 will be crucial. If buying pressure continues to flow in and the OBV indicator remains above the High Line, the upward trend will likely be broken.
readCrypto
How to interpret charts and trade...

Hello, fellow traders! If you "Follow" me, you'll always get the latest information quickly. Have a great day. ------------------------------------- The Trend Check (TC) indicator is a comprehensive evaluation of the PVT, OBV, and StochRSI indicators. Therefore, a breakout above the zero level indicates strong buying pressure and a high probability of a price increase. The StochRSI indicator is a coincident indicator that can be used as a trading signal by quickly detecting overbought and oversold levels in a stock price. The OBV indicator is a volume indicator that measures buying and selling pressure by adding the trading volume on days when the price is rising and subtracting the trading volume on days when the price is falling. It was developed based on the assumption that trading volume precedes the price. The PVT indicator is a technical analysis tool that analyzes buying and selling pressure and trends in the market by reflecting both stock price movements and trading volume. It combines accumulated trading volume with price volatility to sensitively reflect market supply and demand and trends. By comprehensively evaluating these indicators, it can be used to determine trading timing. However, since the trend may fluctuate depending on whether the StochRSI indicator is in the overbought or oversold zone, the StochRSI indicator has been displayed accordingly. If the StochRSI indicator enters the overbought zone, upside is likely to be constrained, and if it enters the oversold zone, downside is likely to be constrained. Therefore, it is recommended to check the StochRSI indicator's fluctuations along with the TC indicator. If the On-Bottom Volume (OBV) indicator is between the Low Line and High Line, the price is likely to move sideways. Furthermore, if it rises above the High Line, it is likely to be bullish, and if it falls below the Low Line, it is likely to be bearish. To confirm this, the On-Bottom Volume (OBV) indicator has been added separately. In summary, if the TC indicator shows an upward trend or remains above 0, the price is likely to rise. However, the movements of the StochRSI and OBV indicators are checked to determine whether the upward trend can be maintained or whether a downtrend will occur. Therefore, for the price to continue its upward trend, 1. the TC indicator must show an upward trend above 0, 2. the StochRSI indicator must show an upward trend without entering an overbought zone, and 3. the OBV indicator must remain above its High Line or show an upward trend. For the price to continue its downward trend, this is the opposite of the above conditions for a sustained upward trend. If the StochRSI or OBV indicators show a different trend than the TC indicator, the price is likely to move sideways, so be mindful of this when trading. - Since most indicators are based on 1D charts, it's important to first check the movements of the 1D chart. Next, it's best to trade by reflecting the movements of the 1D chart with the movements of the timeframe chart you're trading. In other words, if the 1D chart shows an upward trend, you should trade based on the expectation that the price will rise on the timeframe chart you're trading. Therefore, when prices are falling, it's best to trade with a smaller investment amount and a shorter investment period to react quickly (with a short stop-loss point). When prices are rising, it's best to trade with a larger investment amount and a longer investment period (with a more generous stop-loss point). - Auxiliary indicators should be considered as supplementary indicators, as their name suggests, in interpreting charts. The key is to identify support and resistance points or ranges for the price and the movements of the M-Signal indicator on the 1M, 1W, and 1D charts. To determine the overall chart movement, check the movements of the M-Signal indicator on the 1M, 1W, and 1D charts. For the price to continue its upward trend, it must remain above the M-Signal indicator on the 1M chart. If it fails to do so, a downward trend is highly likely, so you should consider a strategy to counter a bearish market. If the price is below the M-Signal indicator on the 1M chart, it is recommended to shorten the investment period. Consequently, it is also recommended to set a shorter stop-loss point. For this purpose, the HA-MS indicator includes indicators designed to indicate support and resistance points. The most representative indicators are the HA-Low and HA-High indicators. The HA-Low and HA-High indicators are designed for trading using the Heikin-Ashi chart. The HA-Low indicator indicates the low range, so if it encounters support, it's a buy signal. The HA-High indicator indicates the high range, so if it encounters resistance, it's a sell signal. To make this more clear, the DOM(60) and DOM(-60) indicators have been added. The DOM(-60) indicator, like the HA-Low indicator, indicates the low range. The DOM(60) indicator, like the HA-High indicator, indicates the high range. Therefore, if support is found within the established DOM(-60) ~ HA-Low or HA-Low ~ DOM(-60) range, it's a buy signal. If resistance is found within the established HA-High ~ DOM(60) or DOM(60) ~ HA-High range, it's a sell signal. - When assessing support at these points or intervals, adding the interpretation of the auxiliary indicators mentioned above will be a significant aid in determining support. In other words, if price movements indicate support, but the auxiliary indicators do not support it, the price is likely to decline. - If you trade based on indicator movements, you may suddenly find yourself trading against them. This happens because you prejudge the indicators' movements based on your own thinking and then trade accordingly. To prevent this problem, it's important to ensure that all auxiliary indicators are moving in the same direction. Also, while you can buy to some extent in spot trading, you should never initiate a trade based on price movements when trading short positions in futures. This is because price volatility is higher when prices are falling. Therefore, when starting a short position, it's best to initiate the trade at support and resistance levels. - We begin trading based on indicator movements or chart analysis, but we lose something. That's our trading strategy. When actually trading, we must first determine: 1. How long will the trading period be? 2. How much capital will we invest? 3. How will we conduct the trade? If we simply analyze the indicator movements and charts without deciding on these factors, we are likely to trade in a state of constant anxiety. This is because maintaining a stable mental state is more important than profit when trading. A stable mental state during a trade increases the likelihood of a successful trade. This is because it allows us to respond more effectively. Therefore, establishing a basic trading strategy that suits your investment style is paramount. By considering the investment period for the stock or coin you're considering, you can determine your investment amount accordingly and choose a detailed trading method. Therefore, 1. Investment Period 2. Investment Size 3. Trading Method When conducting a trade, consider the three factors above. When investing for a medium- to long-term or longer, it's important to carefully manage your purchases to lower your purchase price. If your average purchase price is high, it can be psychologically burdensome to trade with a medium- to long-term investment horizon. Therefore, in this case, you should trade for shorter periods of time, generating cash profits while lowering your average purchase price. Lowering your average purchase price isn't easy in the stock market. This is because trading is done on a weekly basis. However, the coin market allows for decimal trading, so you can lower your average purchase price by increasing the number of coins corresponding to your profit. For coins corresponding to profit, you trade by purchase price. When profits are generated for each purchase price, you sell the amount equivalent to the purchase price (including transaction fees) for each purchase price, thereby retaining the remaining coins. Since the purchase price of these remaining coins is 0, as the number of these coins increases, the average purchase price will decrease. - Investment size is crucial, as it determines how you allocate your total investment capital to conduct your trading. If your investment is misallocated, even with high returns, actual profits may be small, and even with low loss rates, actual losses may be large. Furthermore, the most important aspect of investment size is always maintaining a reserve fund. The amount of reserve fund you should keep will vary depending on your individual investment style. I recommend approximately 20% of your total investment capital. This reserve fund is used for emergencies. If you start trading with this reserve fund, you must sell it quickly to secure the reserve fund. Failure to do so can lead to extreme anxiety and the inadvertent execution of unintended trades. Depending on your investment size, you should consider how many stocks (coins) you will trade at a time. Investing in too many stocks (coins) can lead to a small purchase amount or simultaneous trading, which can hinder your ability to execute your trades effectively. Therefore, you should always consider the number of stocks (coins) you can manage simultaneously. Typically, the number of stocks (coins) you can manage simultaneously is 1-3. Long-term investments, even if managed concurrently, often require time to respond, so they don't need to be included in the number of concurrent investments. However, it's recommended to include mid-term and shorter investments in your concurrent management count. - Once you've chosen a stock (coin) based on your investment horizon and investment size, you can then proceed to detailed trading based on chart analysis and indicator movements. Therefore, it's best to keep chart analysis as short as possible. This is because prolonged chart analysis increases the likelihood of your subjective opinions incorporating them into your analysis, which can result in inaccurate chart analysis. Furthermore, prior to chart analysis, if you first review non-chart-related issues (such as company news, politics, or the economy) and then analyze the chart based on those, you may end up basing your analysis on your own subjective opinions. Therefore, it's important to be mindful of this. It's important to remember that over-information can actually be detrimental to your trading. - When developing a detailed trading strategy, I outlined the basic trading strategy of buying in the DOM(-60) ~ HA-Low range and selling in the HA-High ~ DOM(60) range. By adhering to this principle, even if you don't achieve significant returns, I believe you'll be able to ensure consistent profits. Looking at the basic trading strategy broadly, it follows a trading pattern within a box range. However, the length of that box range is unknown. To achieve significant profits, it is necessary to break beyond the box range. Therefore, if the price rises within the HA-High ~ DOM(60) range, a stepwise upward trend is likely, transitioning into a trend trade. Conversely, if the price falls within the DOM(-60) ~ HA-Low range, a stepwise downward trend is likely, transitioning into a trend trade. However, it's important to note that a stepwise upward trend ends in a decline, while a stepwise downward trend ends in a rise. In other words, while a stepwise upward trend is likely to lead to a significant upward trend, it also means a significant downward trend. Therefore, when entering a trade during a stepwise upward trend, it's important to respond quickly to minimize losses. Failure to do so could result in a significant decline, resulting in losses that are difficult to recover from. Conversely, a continuous step-down trend is more likely to lead to a significant decline, but it also carries the potential for a significant rise. Therefore, we must consider how to implement tranche purchases during a step-down trend to lower the average purchase price or secure more stocks (coins). Therefore, we should execute more trades during a step-down trend. However, in the stock market, tranche purchases during an actual downtrend can lead to a loss of purchases, so caution is advised. In the coin market, transactions are processed in decimals, reducing the burden of trading. This means that trades can be organized by purchase price and executed at each purchase price. Therefore, in a step-down trend, it's important to execute trades at each purchase price to retain a profit-making number of coins (tokens). This can lower the average purchase price or increase the number of coins (tokens). There are two ways to retain a profit-making number of coins (tokens): buying and then selling, or selling and then selling. Any method is fine, but if possible, it's best to trade using a buy-then-sell method. This is because a cascading downtrend ends in an uptrend. Therefore, in a cascading downtrend, you should trade less aggressively and execute more trades. Downtrends are more likely to exhibit volatility than uptrends, so buying and then selling may actually feel easier. However, you should avoid being greedy. The root cause of all losses stems from greed. - If you can consistently generate profits, regardless of the trading method, then that's the best trading method. We invest a lot of time and money in finding this, and remain in the investment market. Charts ultimately represent the movement of money. Therefore, charts should always be the top priority. The main problem with the stock market is that issues outside of the charts dominate the market. This problem prevents investors from seeing the movement of money, and they are constantly being misled by things outside of the charts. As the coin market is being incorporated into the stock market, I believe that many people are dragging the main problems of the stock market into the coin market, leading to a rise in new losses. The biggest difference between the stock and coin markets is that coins are relatively unusable in real life. Therefore, I don't think analyzing them like the stock market is appropriate. In the stock market, too, capital movements are often reflected in charts, so it's best not to check news outside of the charts first. Such news can be toxic to individual investors who lack the ability to gather and analyze information. - Thank you for reading. I wish you successful trading. --------------------------------------------------
readCrypto
Next Volatility Period: Around January 10, 2026

Merhaba tüccar arkadaşlar! En son güncellemeleri hızlı bir şekilde almak için bizi takip edin. İyi günler! ------------------------------------- #BTCUSDT Bu dalgalanma dönemi 29 Aralık'ta sona erecek. Kilit soru, fiyatın 87944,84 yakınındaki desteği koruyup koruyamayacağı ve 1M grafiğindeki M-Signal göstergesinin üzerine çıkıp çıkamayacağıdır. Bu nedenle fiyatın üzerine çıkıp 90588,23 civarında destek bulup bulamayacağını incelememiz gerekiyor. Fiyat yükselen trend çizgisinin (1) altına düşmezse yükseliş bekleniyor. Bunu belirlemek için fiyatın bir sonraki volatilite dönemi olan 10 Ocak civarından sonra nasıl hareket ettiğini incelememiz gerekiyor. - Mevcut fiyat pozisyonuna göre yükselen trend çizgisi (1) önemli bir trend çizgisidir. Fiyat yükselen trend çizgisi (1) boyunca hareket ederse 20 Ocak civarında 87944,84 seviyesinin üzerine çıkacak. Bu nedenle odak noktamız fiyatın 90588,23 yakınında destek bulup bulamayacağı. 1W grafiğindeki M-Signal göstergesinin yukarı kırılması durumunda keskin bir yükselişin muhtemel olduğunu düşünüyoruz. - Fiyat yükseliş trendi çizgisinin (1) altına düşerse 79K-81K civarındaki desteği kontrol etmeli. Destek bulamazsa kritik 69.000-73.499,86 seviyesine düşebilir. 69.000-73.499,86'nın altına düşerse yükselişin uzun zaman alması muhtemel. Yavaş yavaş 42K-43K seviyesine yaklaşabilir; bu seviye muhtemelen bir daha asla ulaşamayacak. Ancak 56.204,13 civarında yukarı yönlü bir dönüş olasılığı mevcut. - 56K-65K aralığı, keskin bir yükseliş eğilimi başlatan ilk dalganın zirvesine karşılık geliyor. Dolayısıyla bu sefer düşse bile 56K-65K bandına çıkması muhtemel. Büyük resmin açıklaması için lütfen aşağıdaki bölüme bakın. Ancak fiyat dalgalanmaları nedeniyle 2026 yılının ilk çeyreğinde major ayı piyasasının başlayacağını düşünüyorum. Bu yılki mum çubuklarının yükseliş mumları olarak kapanıp üç yıllık bir boğa piyasası ve bir yıllık ayı piyasası modeli oluşturup oluşturamayacağını görmek ilginç olurdu. - Sonuna kadar okuduğunuz için teşekkür ederiz. Başarılı ticaretler dilerim. -------------------------------------------------- - Bu büyük resmin açıklamasıdır. (3 yıllık boğa piyasası, 1 yıllık ayı piyasası modeli) Ayı piyasası başladığında daha detaylı anlatacağım. -------------------------------------------------------
readCrypto
Next Volatility Period: Around December 28th
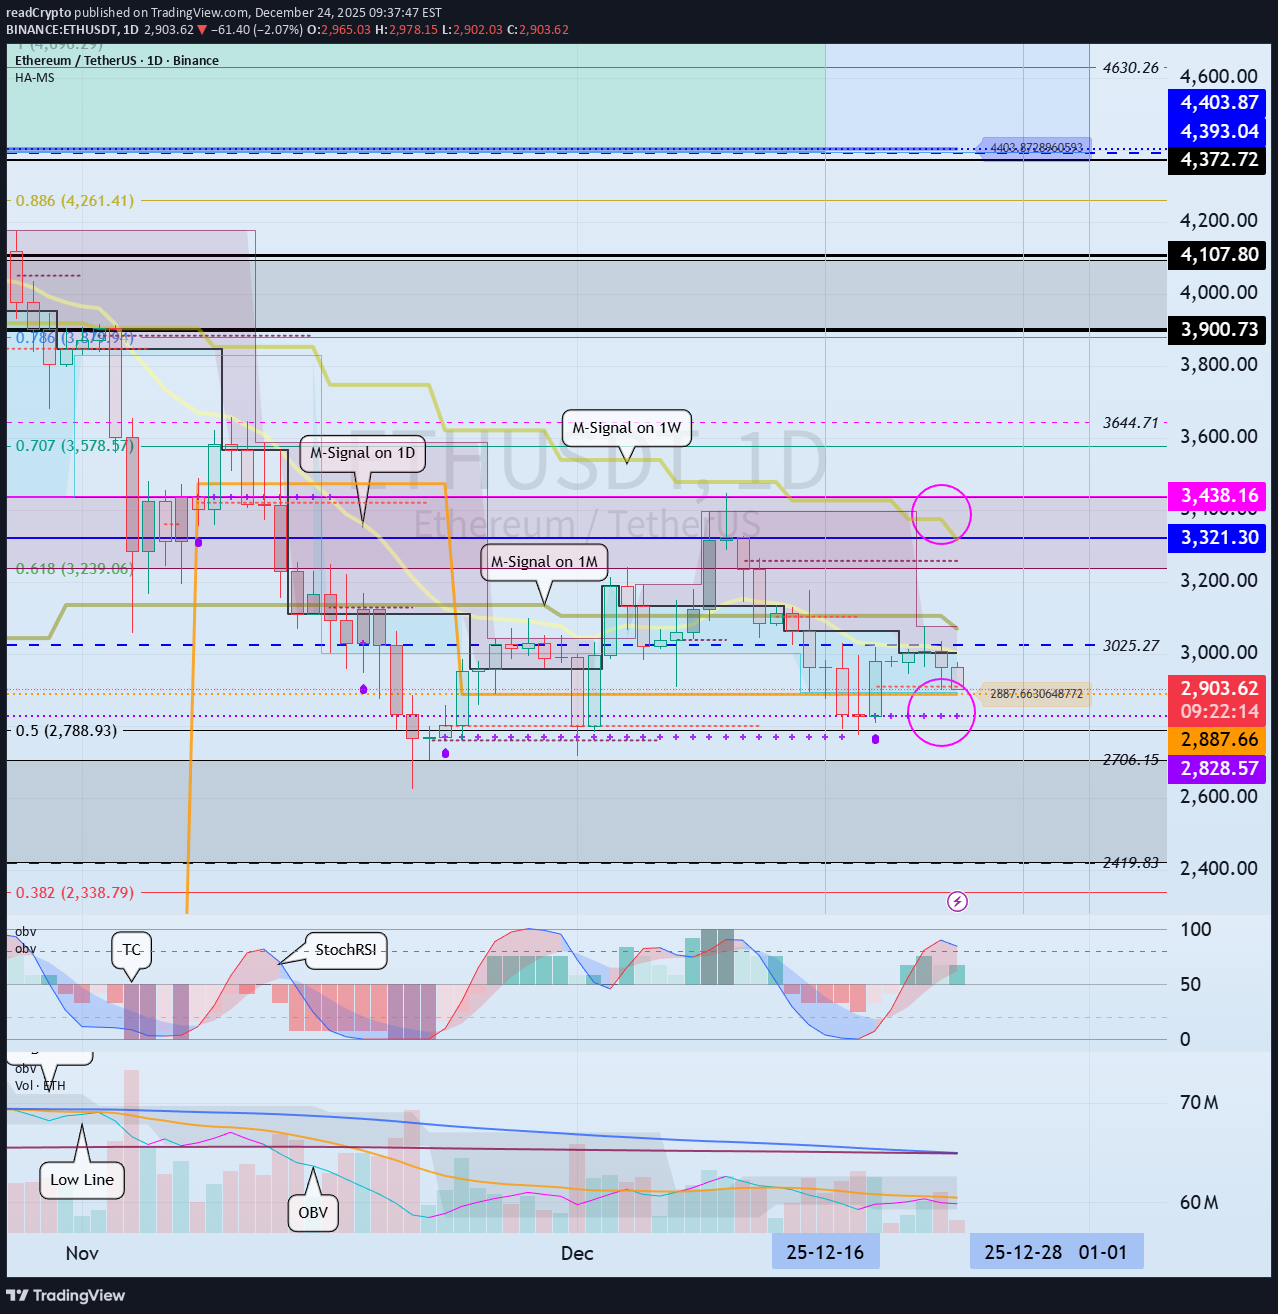
Merhaba tüccarlar! En güncel bilgilere hızlı bir şekilde ulaşmak için bizi takip edin. İyi günler. ------------------------------------- #ETHUSDT Yeni trend çizgisinin oluşmasıyla birlikte bir sonraki volatilite döneminin 28 Aralık - 1 Ocak tarihleri arasında gerçekleşmesi bekleniyor. Şu anda önemli olan, fiyatın 2828,57-2887,66 dip seviyeleri yakınında destek bulup bulamayacağı ve 1 aylık grafikte M-Signal göstergesinin üzerine çıkıp çıkamayacağı olacak. Ancak en önemli destek ve direnç alanı 2419,83-2706,15 aralığı olduğundan fiyatı bu seviyenin üzerinde tutmak çok önemli. Yükseliş trendine dönüşmesi ve yükseliş trendinin oluşması için 3321.30-3438.16 seviyesinin üzerine çıkması gerekiyor. Bu nedenle, orta ve uzun vadeli ticaret stratejinizi önümüzdeki volatilite döneminin hareketlerine göre geliştirmeli veya ayarlamalısınız. 2419.83-2706.15 seviyesinin altına düşerse ayı piyasasının başlaması muhtemeldir, bu nedenle bir yanıt planı düşünmelisiniz. Destek bulur ve yükselirse, bunu son yükseliş trendi olarak düşünün ve kar elde etmek için zaman bulmaya odaklanın. Çünkü BTC büyük resminin açıklamasında da belirtildiği gibi 2026 yılının major ayı piyasası olması bekleniyor. - Sonuna kadar okuduğunuz için teşekkür ederiz. Başarılı ticaretler dilerim. --------------------------------------------------
readCrypto
Next Volatility Period: Around December 28th
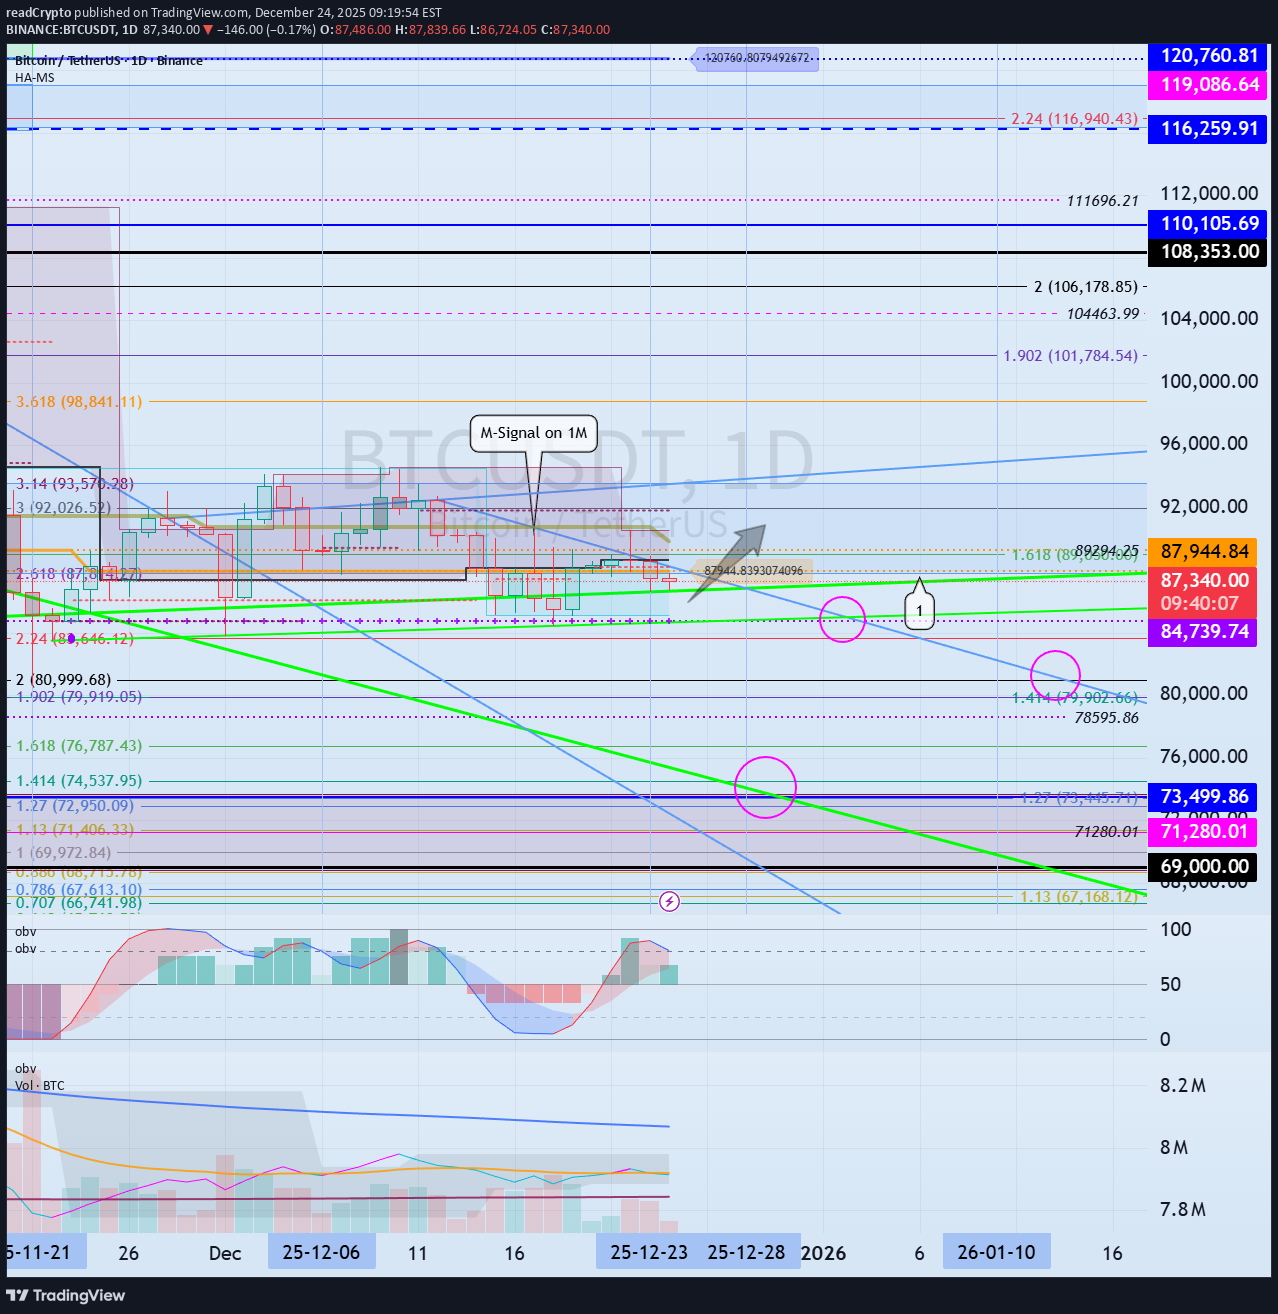
Merhaba tüccarlar! En güncel bilgilere hızlı bir şekilde ulaşmak için bizi takip edin. İyi günler. ------------------------------------- #BTCUSDT Bu dalgalanma dönemi 24 Aralık'ta sona erecek ve bir sonraki dönem 10 Ocak 2026 civarında olacak. Ancak yeni oluşan trend çizgisi 28 Aralık civarında geçtikten sonra movement'ı gözlemlemek önemlidir. Yükselen trend çizgisi (1) 1 haftalık grafikte çizilir. Önemli olan bu trend çizgisi boyunca yükselip yükselemeyeceği ve kısa vadeli düşüş trend çizgisinden çıkıp çıkamayacağıdır. Düşük nokta 84739,74-87944,84'tür, dolayısıyla fiyat bu seviyeye yakın destek bulursa ve 1 aylık grafikte M-Signal göstergesinin üzerine çıkarsa yükseliş eğiliminin oluşması muhtemeldir. Bu kilit noktanın veya seviyenin üzerine çıkıp yükseliş trendini sürdürmek için StochRSI, TC ve OBV göstergelerinin yükseliş trendi göstermesi gerekiyor. Mümkünse, 1. StochRSI göstergesi aşırı alım bölgesine girmemiş olmalıdır. 2. TC göstergesi sıfırın üzerinde kalmalıdır. 3. OBV göstergesi Yüksek Çizginin üzerinde kalmalıdır. Bu nedenle, düşük noktaya (84739.74-87944.84) yakın destek bulurken yukarıdaki koşulların karşılanıp karşılanamayacağını belirlememiz gerekiyor. En önemli destek ve direnç seviyesi 69000-73499,86. Dolayısıyla fiyat bu seviyeye yaklaştıkça volatilite ortaya çıkabilir. Eğer bu seviyede destek bulunursa kesinlikle alım için iyi bir zaman olduğuna inanıyorum. Bir daha göremeyeceğimiz fiyat seviyesinin 42 binin altında olduğuna inanıyorum. - Sonuna kadar okuduğunuz için teşekkür ederiz. Başarılı ticaretler dilerim. -------------------------------------------------- - Bu büyük resmin bir açıklamasıdır. (3 yıllık boğa piyasası, 1 yıllık ayı piyasası modeli) Ayı piyasası başladığında daha detaylı anlatacağım. -------------------------------------------------------
readCrypto
Selection and Focus
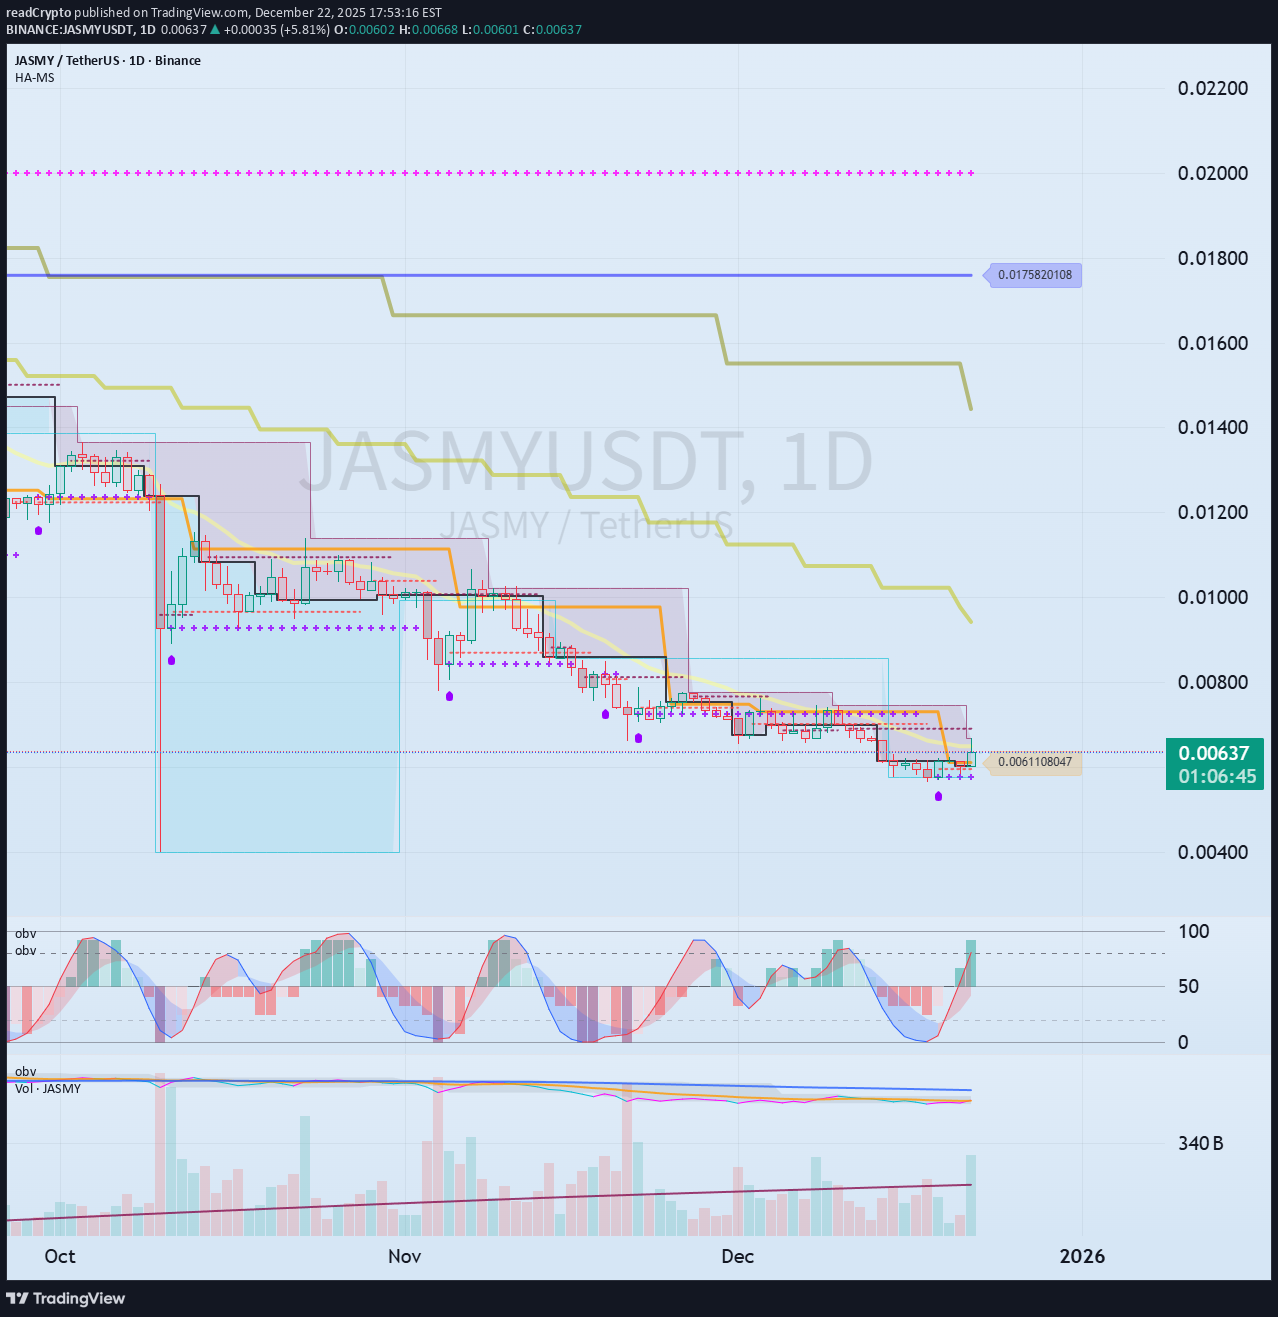
Hello, traders. By "Following," you'll always receive the latest information quickly. Have a great day. ------------------------------------- We are always at a crossroads. We choose which instruments and coins (tokens) to trade and take responsibility for that choice. You can see in the chart above that the price has fallen back to near the HA-Low indicator on the 1W chart. And, the 1D chart shows a stepwise downward trend. In other words, the price fell below the HA-High indicator, exhibiting a normal decline, and then encountered the HA-Low indicator, forming a stepwise downtrend. A normal downtrend is formed from a high and then declines, while a stepwise downtrend is formed from a low and then renewed. While both types of downtrends ultimately represent the same decline, the difference is that in a stepwise downtrend, you can choose the criteria for entering a trade. Therefore, we can look for charts where a stepwise downtrend transitions to an uptrend and trade based on whether support and resistance are present. Looking at this example chart, the price fell below the HA-High indicator on August 14th and then exhibited a normal downtrend. Then, on October 10th, it fell below the HA-Low indicator, forming a stepwise downtrend. Looking at the larger 1W chart, we can see that the price has been in a normal downtrend since February 3rd, falling below the HA-High indicator. Then, after October 6th, it touched the HA-Low indicator, indicating that it had reached a low. It appears to be currently testing support near the HA-Low indicator level of 0.00544. Therefore, whether support is found near the HA-Low indicator level of 0.00544-0.00611 on the 1W and 1D charts indicates a different meaning from the stepwise decline seen so far. However, the point at which the downtrend turns into an uptrend and the uptrend is likely to begin is when the price rises above 0.01090 and holds, giving us time to decide on a trade. Therefore, we can buy when the price rises after finding support in the 0.00544-0.01090 range. The buy zone, or support zone, is too wide, making it difficult to trade. In this case, we buy when the price rises after finding support in the key zone, such as the 0.00544-0.00611 range or near 0.01090. Most traders are afraid to buy at the lowest price, so they will buy when the price rises to around 0.01090. This phenomenon is called a breakout trade. In other words, the psychological pressure to buy arises when the price breaks above 0.01090. Therefore, you should buy when the price rises after finding support in the DOM(-60) ~ HA-Low range, and sell some of the gains, gradually buying during a stepwise downtrend. By leaving behind coins (tokens) that represent profits, you can reduce the burden of buying at the bottom. However, if you're not familiar with day trading, you may continue to use your investment funds to buy. However, don't be afraid of this. This is because the start of a stepwise downtrend means that the likelihood of a bullish turn has increased. What you should be afraid of is the HA-High ~ DOM(60) range, i.e., when you buy during the high and then the downtrend begins. This is because you don't know how far the decline will go. Only when you encounter the DOM(-60) or HA-Low indicators will you know the end of the decline is near. Therefore, you need to understand the current position of your chosen asset or coin (token) and consider how to set your trading timing and how to proceed with the trade. ------------------------------------------------------------------ From this perspective, looking at the BTC chart reveals the significance of its current position. In other words, if the price declines from the current position, it marks the beginning of a stepwise downtrend. If it rises, it indicates the possibility of an upward trend until it encounters the HA-High or DOM(60) indicator. The M-Signal indicator on the 1M chart passes through this crucial crossroads, making it even more crucial. The same holds true for the ETH chart. Therefore, rather than focusing on whether the price will rise or fall, you should check for support near the established low point, i.e., the DOM(-60) to HA-Low range, and respond accordingly by making split purchases. In other words, trading that leaves behind the coins (tokens) that represent profits from day trading is a useful strategy. If you're not familiar with day trading, you should purchase at the lowest possible price between DOM(-60) and HA-Low. Since these purchases should be made every time a cascading downtrend occurs, it's best to purchase in small amounts. If you find a profitable purchase price within the DOM(-60) to HA-Low range on a certain day, you can sell the amount of each purchase price, leaving the coins (tokens) that represent profits. It sounds simple, but actually executing a trade is not easy. Therefore, this trading method (leaving coins corresponding to profits) should be practiced during a cascading downtrend to become familiar with it. Therefore, until you become accustomed to it, trade with small amounts of capital. - Thank you for reading to the end. I wish you successful trading. --------------------------------------------------If possible, it's best to select a stock or coin (token) whose price remains above the M-Signal indicator on the 1M chart. The chart displays the M-Signal indicators for the 1M, 1W, and 1D charts. However, depending on the chart's creation period, some M-Signal indicators may not be displayed. In this case, select the highest M-Signal indicator. In the chart above, the M-Signal indicator on the 1W chart is currently the highest.
readCrypto
The key is whether the price can break above the 0.04032-0.04342
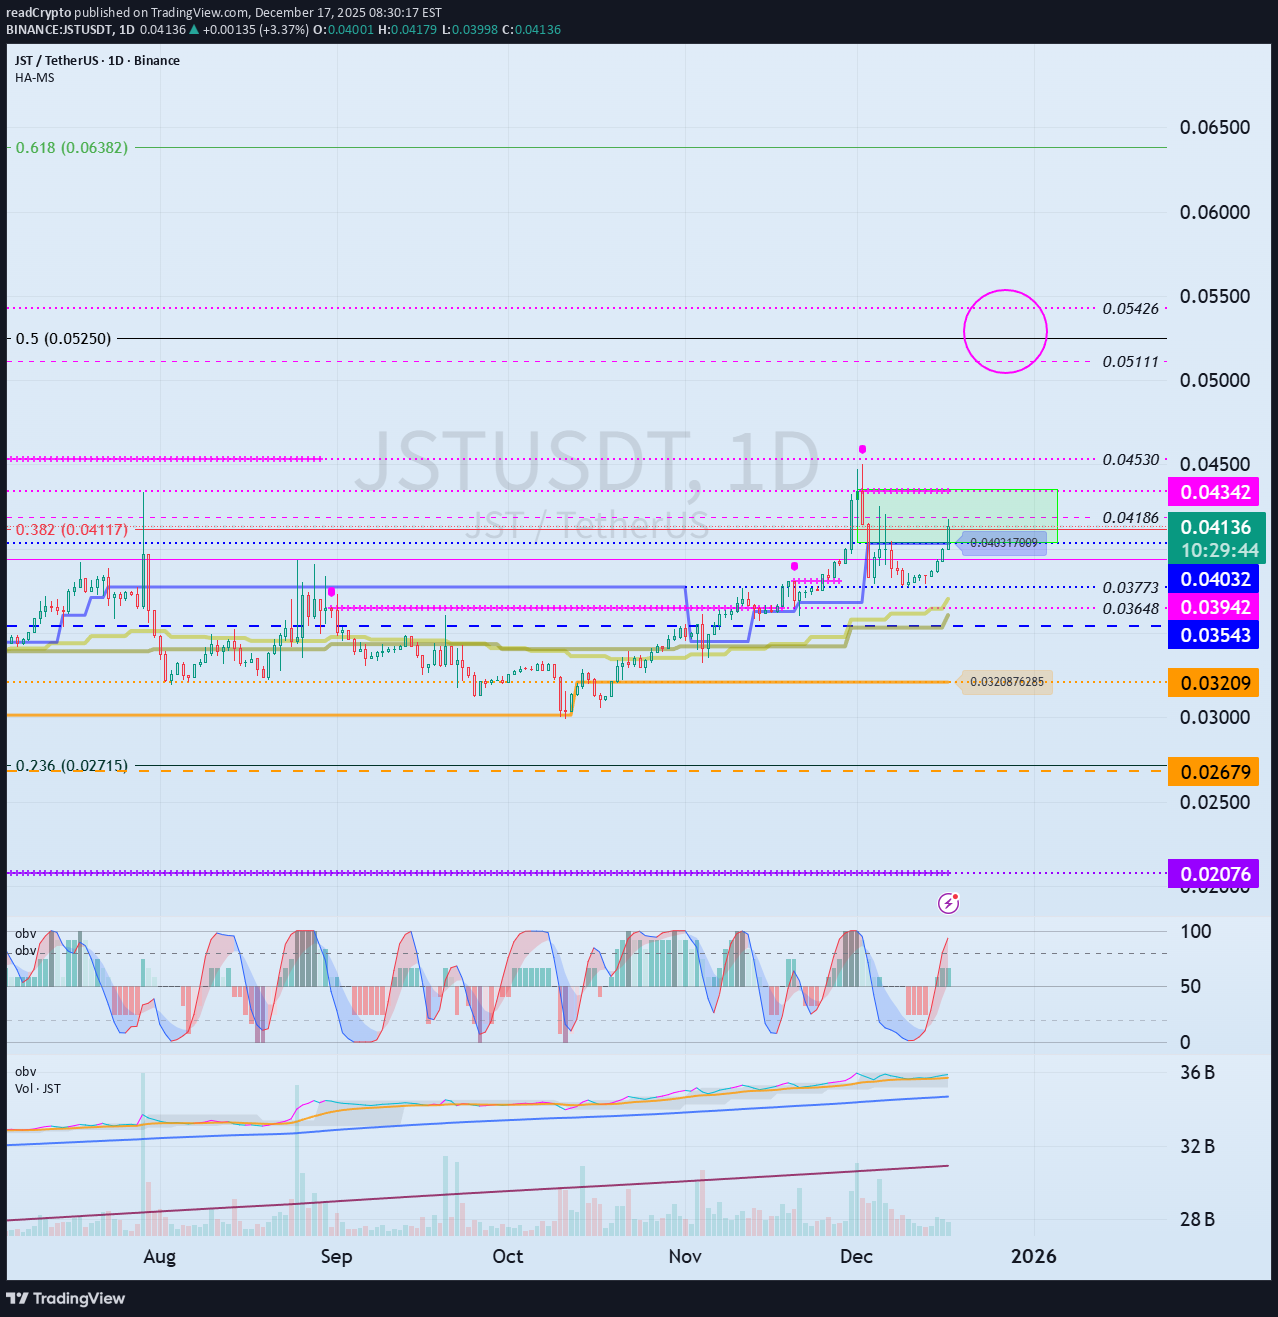
Merhaba tüccarlar! En güncel bilgilere hızlı bir şekilde ulaşmak için bizi takip edin. İyi günler. ------------------------------------- (JSTUSDT 1 milyon grafiği) Fiyatın 0,03942'nin üzerinde kalması durumunda tam ölçekli bir yükseliş trendinin başlaması bekleniyor. - (1G grafiği) Fiyat 0,03942 yakınındaki destekle yükselirse, 0,05111 yakınındaki yukarı yönlü bir kırılmanın bir yükseliş trendi başlatması muhtemeldir. Fiyat yükselip düşmezse, 1.: 0,03543 2.: 0,02679 Yukarıdaki 1. ve 2. seviyelere yakın destek olup olmadığını kontrol etmeliyiz. - (1 boyutlu grafik) HA-Yüksek ~ DOM(60) aralığı 0,04032 ile 0,04342 arasında oluşur. Bu nedenle kademeli bir yükseliş trendinin oluşması için 0,04032 ve 0,04342'nin üzerinde bir kırılma gerekiyor. Yükseliş trendinin ilk direnç seviyesinin 0,05111-0,05426 civarında olması bekleniyor. 1M grafiğindeki M-Signal göstergesi 0,03543 civarında olduğundan, 0,03543'ün altına düşmesi durumunda ticareti durdurup durumu değerlendirmeniz tavsiye edilir. Kilit bir noktanın veya aralığın üzerine çıkıp yükseliş trendini sürdürmek için StochRSI, TC ve OBV göstergelerinin yükseliş trendi göstermesi gerekiyor. Mümkünse, - StochRSI göstergesi aşırı alım bölgesine girmemelidir. - TC göstergesi sıfırın üzerinde kalmalıdır. - OBV göstergesi Yüksek Çizginin üzerinde kalmalıdır. Şu anda StochRSI göstergesi aşırı alım bölgesine girdi ve bu da yükselişi sınırlayabilir. Bunun üstesinden gelmek ve yükseliş trendini sürdürmek için işlem hacminin hızla artması gerekiyor. Değilse, yan movement aramalı ve desteği test edip etmediğini kontrol etmelisiniz. - Okuduğunuz için teşekkür ederiz. Başarılı ticaretler dilerim. --------------------------------------------------
readCrypto
Next Volatility Period: Around January 1, 2026
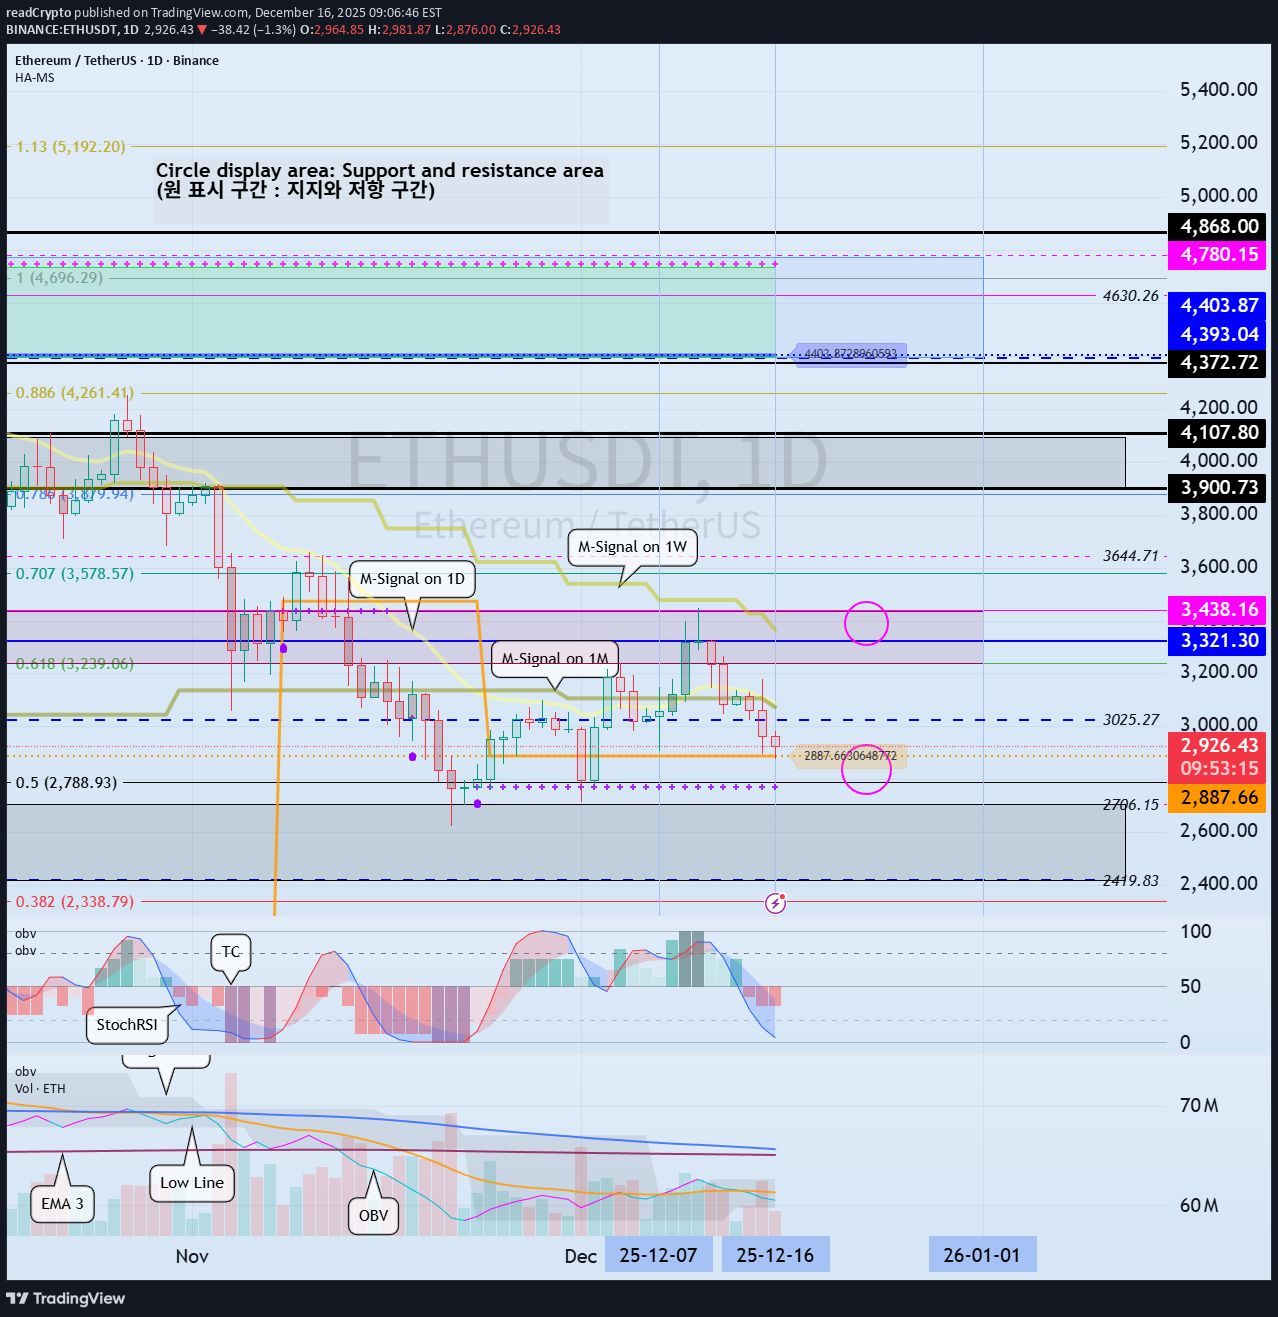
Merhaba tüccarlar! En güncel bilgilere hızlı bir şekilde ulaşmak için bizi takip edin. İyi günler! ------------------------------------- (ETHUSDT 1B Grafiği) Bu dalgalanma döneminin 17 Aralık'a kadar sürmesi bekleniyor. Yükseliş trendi başlatmak için fiyatın 1M grafiğindeki M-Signal göstergesinin üzerine çıkması ve sabit kalması gerekir. Bu anlamda önemli olan, fiyatın 2887,66 yakınlarında destek bulup 3025,27 seviyesinin üzerine çıkıp yükseliş ivmesini sürdürüp sürdüremeyeceğidir. Ancak, tam ölçekli bir yükseliş trendinin ancak fiyatın 1A grafiğindeki HA-Yüksek ~ DOM (60) aralığının (3321.30-3438.16) üzerine çıkması durumunda başlaması bekleniyor. - Ticaret açısından bakıldığında, 1M grafiğindeki M-Signal göstergesinin altında işlem yapmak zordur, bu nedenle mümkünse desteğin varlığına bağlı olarak 3025,27 civarında bir ticaret fırsatı bulmak en iyisidir. Orta ve uzun vadede DOM (-60) ~ HA-Düşük aralığı yakınında destek bulunduğunda taksitle satın alabilirsiniz. Bu nedenle taksitli alım için zamanlama 2770.12-2887.66 yakınında destek bulunana kadardır. Ancak fiyat DOM(-60) seviyesinden HA-Düşük aralığına düşerse, bir düşüş eğilimi görülmesi muhtemeldir, bu nedenle bir karşı önlem düşünmelisiniz. Başka bir deyişle, fiyat DOM(-60) ila HA-Düşük aralığı yakınında desteklendiğinde satın aldıysanız, fiyat yükseldiğinde ve ardından düşmeye başladığında varlıklarınızın bir kısmını satabilir ve kâra karşılık gelen koinleri (tokenları) bırakabilirsiniz. Bu taksitle yapılabilir. - Uzun vadeli bir perspektiften bakıldığında yükselişin sürdürülebilmesi için fiyatın 2419,83-2706,15 seviyesinin üzerinde tutulması gerekiyor. Bu başarısız olursa ve fiyat düşerse, uzun vadeli bir düşüş eğilimi muhtemeldir, bu nedenle bir karşı önlem düşünmelisiniz. İki tür düşüş vardır: 1. Normal Düşüş Bu, fiyat DOM(-60)'tan HA-Düşük aralığına yükseldiğinde, HA-Yüksek ila DOM(60) aralığını oluşturduğunda ve ardından düştüğünde meydana gelir. Bu düşüşün DOM(-60) veya HA-Düşük göstergelerine ulaşana kadar devam etmesi muhtemel, bu da düşüşün gerçek boyutunu ölçmeyi zorlaştırıyor. Bu nedenle, normal bir düşüş sırasında kısmi alımın zamanlamasını belirlemek zordur, bu nedenle alım yaparken dikkatli olunması tavsiye edilir. Ancak zamanlamayı tahmin etmek için diğer göstergeler ve destek ve direnç seviyeleri kullanılabilir. 2. Merdiven İnişi Bu, DOM(-60) seviyesinden HA-Düşük aralığına doğru daha fazla düşüşe işaret ediyor. Bu nedenle, eğer düşüş devam ederse, DOM(-60) veya HA-Düşük göstergeleri eninde sonunda yeniden karşılaşılacak ve bu da kısmi bir alımın zamanlamasına olanak tanıyacak. Ancak bu düşüşün sıklığını tahmin etmek imkansız olduğundan, bölünmüş ticaret gereklidir. Bölünmüş bir ticaret yaparken, her bölünmüş satın alma fiyatında kısa vadeli ticaret (günlük ticaret) yaparak kara karşılık gelen coin (token) sayısını artırmak önemlidir. Aynı zamanda, gelecekteki bölünmüş satın alımlarınız için fon sağlamak amacıyla ana paranızın bir kısmını geri almalısınız. - Yukarıda bahsettiğimiz düşüşler arasında ilgilenmemiz gereken an, ikinci adım olan düşüşün gerçekleştiği zamandır. Başka bir deyişle, DOM(-60) veya HA-Düşük göstergeleri karşılandığında işlem yapmayı düşünmeye değer. - Sonuna kadar okuduğunuz için teşekkür ederiz. Başarılı ticaretler dilerim. --------------------------------------------------
readCrypto
The key is whether it can rise above 0.2851
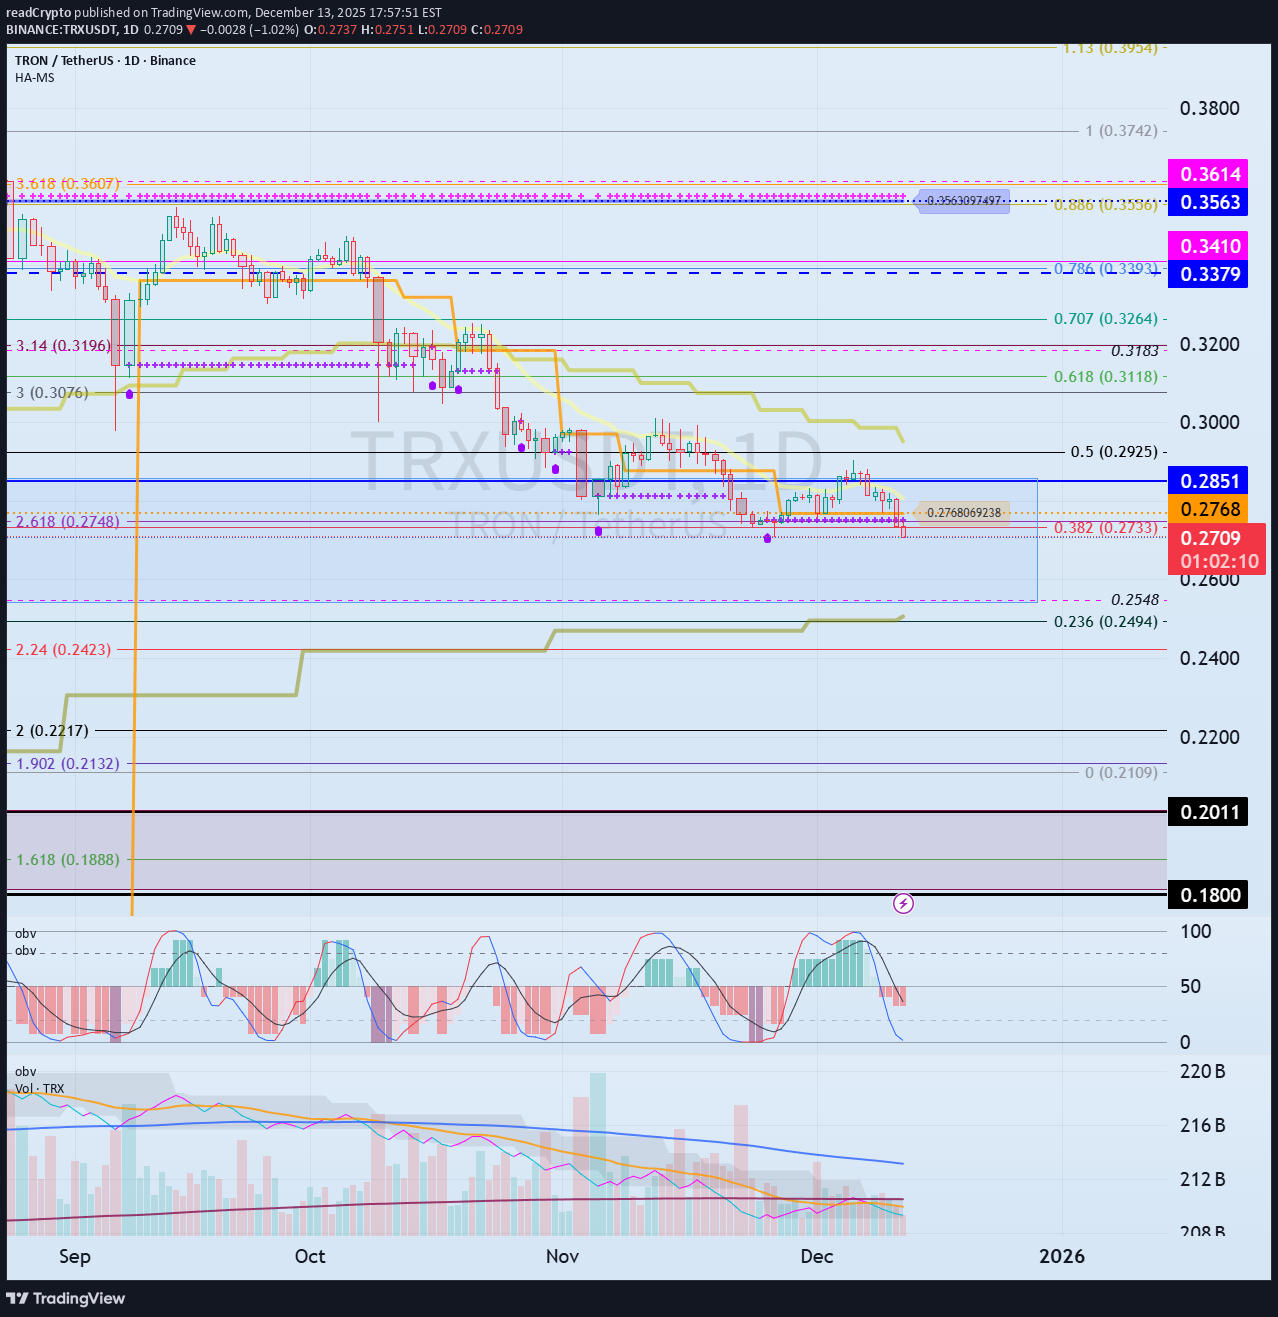
Merhaba tüccar arkadaşlar! En güncel bilgilere hızlı bir şekilde ulaşmak için bizi takip edin. İyi günler. ------------------------------------- (TRXUSDT 1M Grafiği) Uzun vadeli bir perspektiften bakıldığında yükseliş trendinin devam etmesi için fiyatın 0,18-0,2011 seviyesinin üzerinde kalması gerekiyor. 0,2851'de dirençle karşılaşıp düşerse 1M grafiğinde M-Signal göstergesinin yakınında destek olup olmadığını kontrol etmeliyiz. Daha fazla düşüş meydana gelirse, 0,18-0,2011 civarındaki destek çok önemli olacaktır. - (1G grafiği) 1 haftalık grafiğe baktığımızda 0,2548-0,2851 yakınlarında destek bulup yükselemeyeceğini incelememiz gerekiyor. Eğer 0,2548-0,2851 yakınında destek bulur ve yükselirse asıl soru 0,3379-0,3614 aralığının üzerine çıkıp çıkamayacağıdır. - (1 boyutlu grafik) Bu nedenle, 1.: 0,2548-0,2851 2.: 0.18-0.2011 Desteğin yukarıdaki 1. ve 2. seviyelere yakın bulunması kısmi alım dönemine işaret ediyor. HA-Düşük göstergesinin altına düşüyor ve kademeli bir düşüş eğilimi gösteriyor. Bu nedenle, ya kademeli düşüş eğiliminin durmasını beklemeyi ya da günlük ticaret yoluyla kâr edilebilecek coin (token) sayısını artırmayı düşünmelisiniz. - Sonuna kadar okuduğunuz için teşekkür ederiz. Başarılı ticaretler dilerim. --------------------------------------------------
Sorumluluk Reddi
Sahmeto'nun web sitesinde ve resmi iletişim kanallarında yer alan herhangi bir içerik ve materyal, kişisel görüşlerin ve analizlerin bir derlemesidir ve bağlayıcı değildir. Borsa ve kripto para piyasasına alım, satım, giriş veya çıkış için herhangi bir tavsiye oluşturmazlar. Ayrıca, web sitesinde ve kanallarda yer alan tüm haberler ve analizler, yalnızca resmi ve gayri resmi yerli ve yabancı kaynaklardan yeniden yayınlanan bilgilerdir ve söz konusu içeriğin kullanıcılarının materyallerin orijinalliğini ve doğruluğunu takip etmekten ve sağlamaktan sorumlu olduğu açıktır. Bu nedenle, sorumluluk reddedilirken, sermaye piyasası ve kripto para piyasasındaki herhangi bir karar verme, eylem ve olası kar ve zarar sorumluluğunun yatırımcıya ait olduğu beyan edilir.