
pakoumal
@t_pakoumal

Ne tavsiye etmek istersiniz?
önceki makale
پیام های تریدر
filtre
تحلیل هفتگی بازار: چرا QQQ شما را کلافه خواهد کرد؟ (پیشبینی 5 ژانویه)

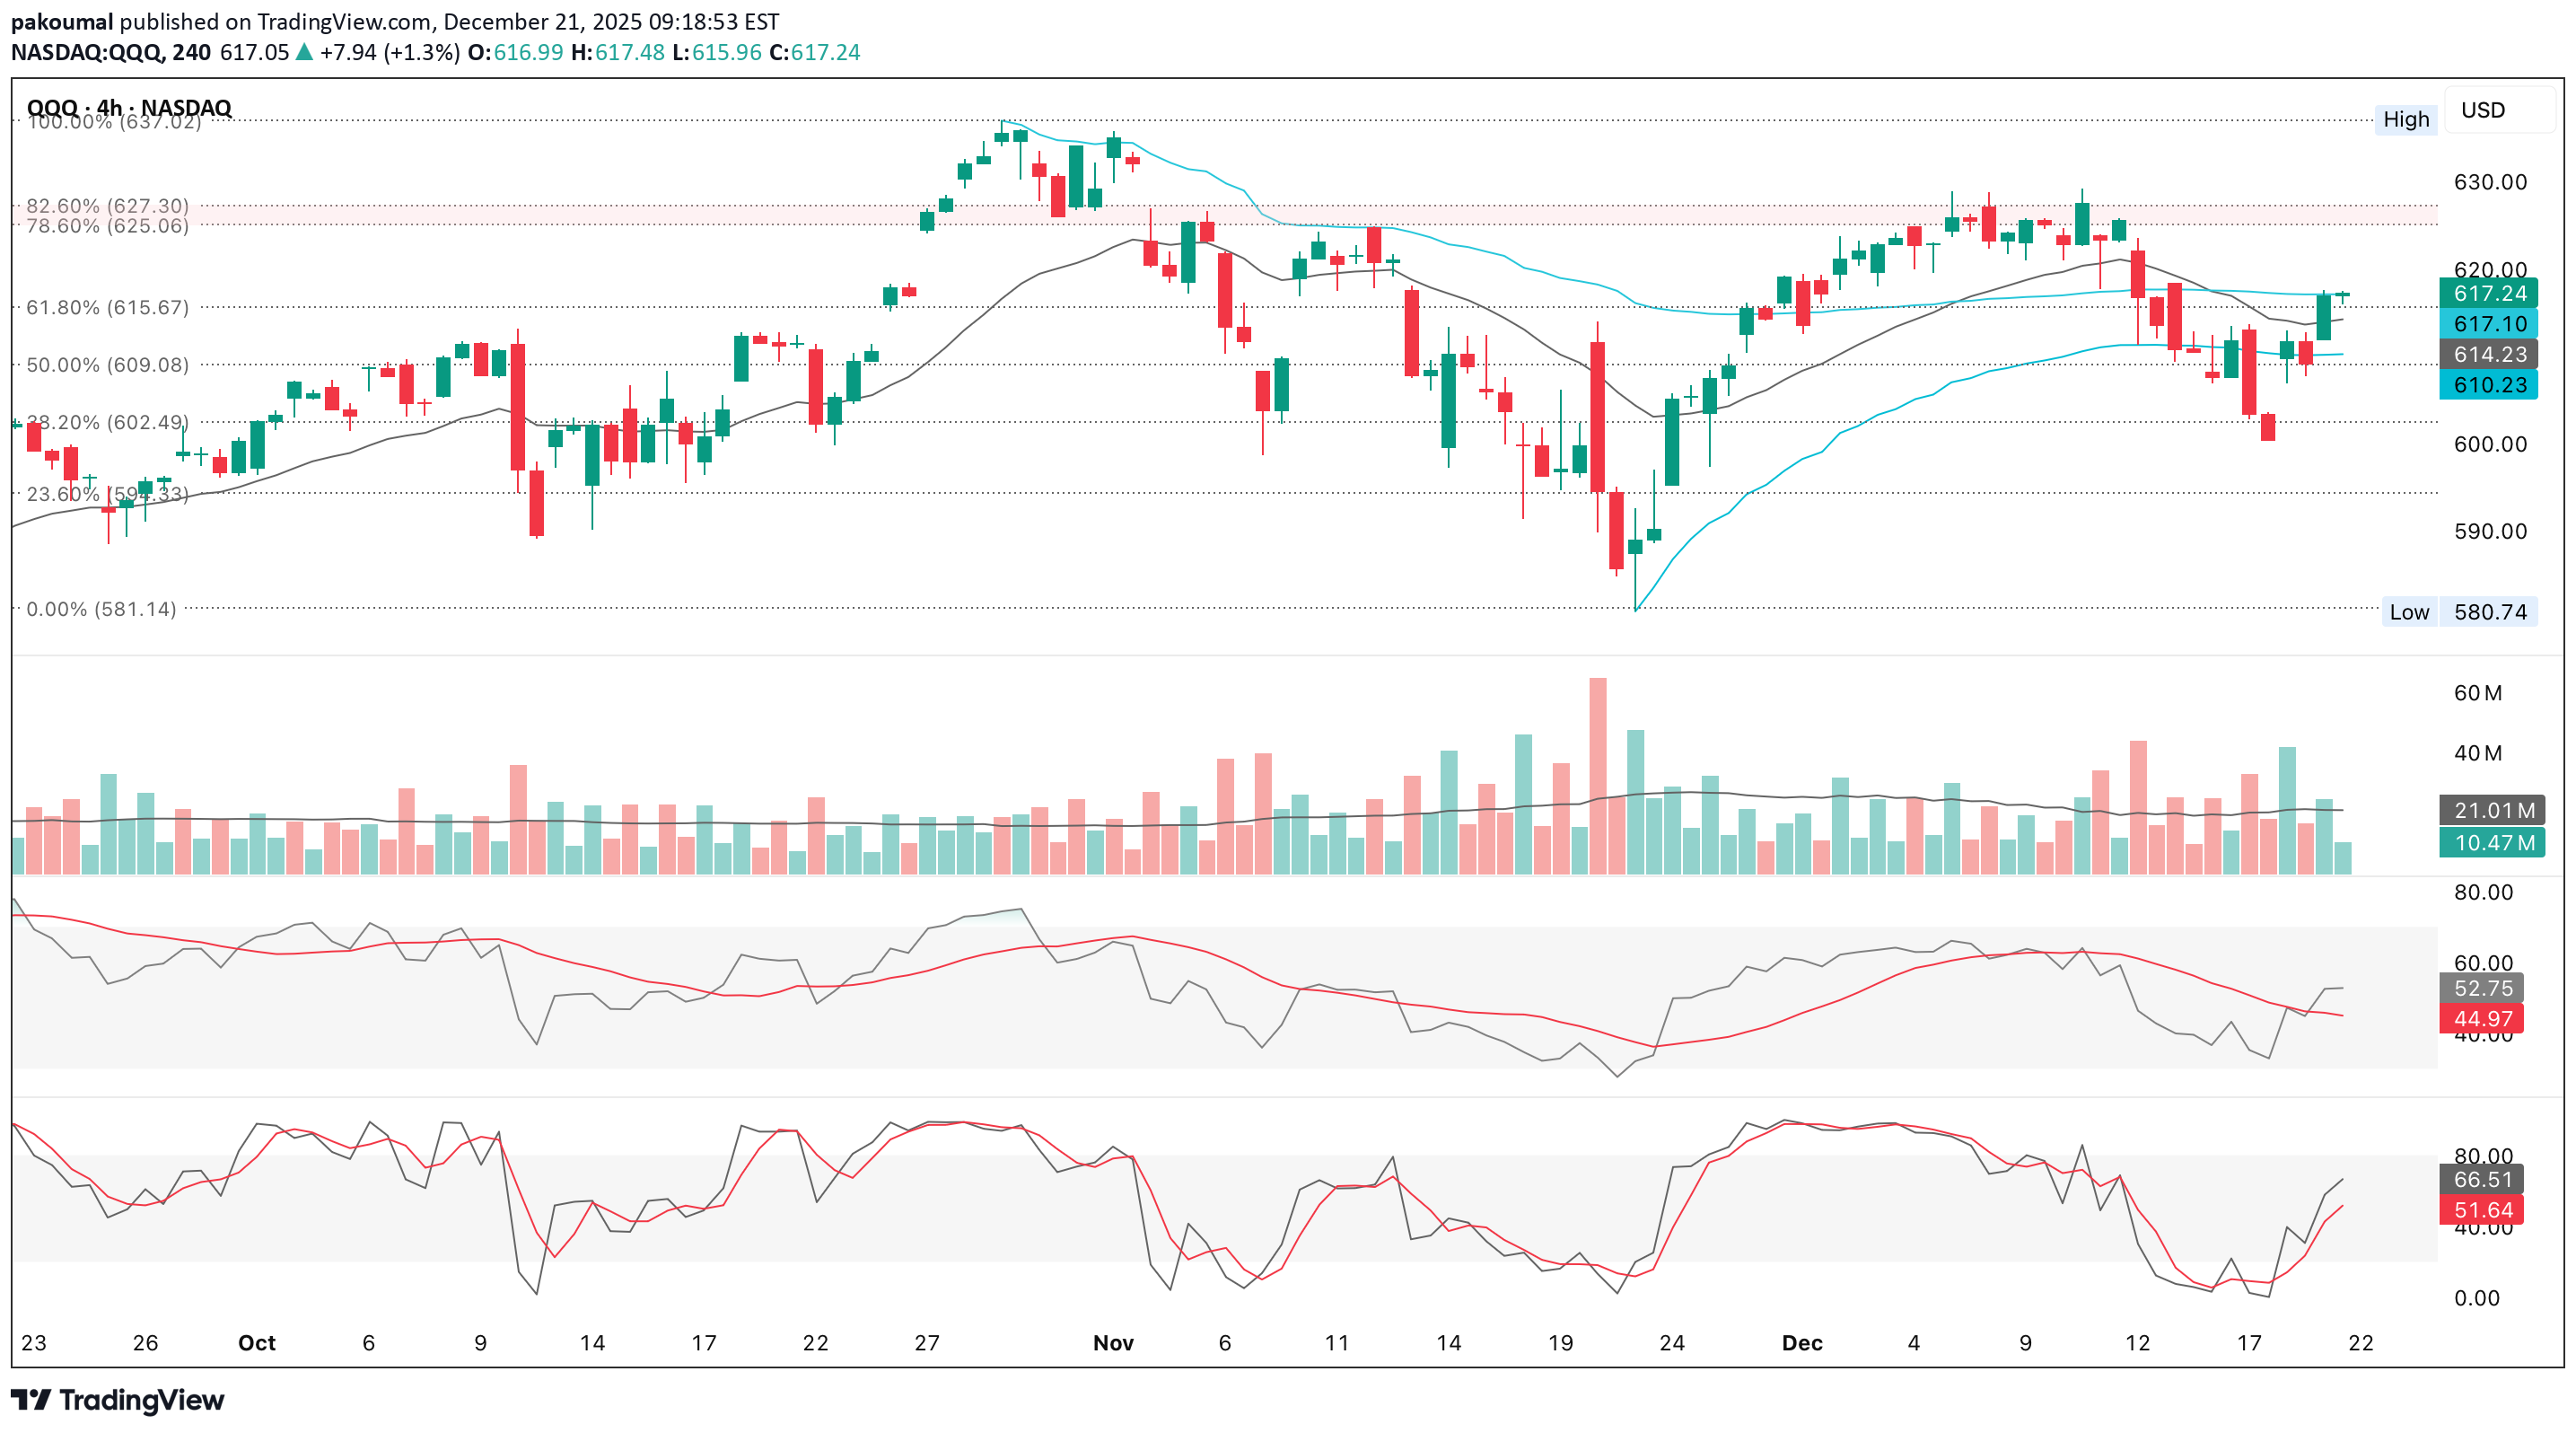
Şu anda QQQ, güçlü piyasaların karar vermeden önce yaptığı şeyin aynısını yapıyor, hayal kırıklığı yaratıyor Fiyat, klasik bir trendin devamı olan bu zirveden bu yana daha yüksek dipler yapıyor, ancak daha düşük yüksekler yapıyor Özellikle hacim 100d'ye (~602$) doğru yol açarken, 50d'nin altında sürekli bir kapanış yaşanıyor Trend hâlâ yükselişte, ivme soğuyor ve oynaklık daralıyor ve muhtemelen bir aralık genişlemesiyle çözülecek - hangi tarafın önce kırılacağına ve genişleme olmadan, herhangi bir move şüpheli olarak belirlenecek Mevcut fiyat (~613$) ~608$ ile 612$ arasındaki değerin biraz üzerindedir Düşük hacim, alıcıların devreye girmesi durumunda yükselişi kolaylaştırır Fiyatın 608-612 dolar aralığına düşmesi durumunda alıcıların istatistiksel olarak savunma yapma olasılığı yüksek ~608$'ın altındaki kabul, kısa vadede profilin düşüş eğilimini tersine çevirebilir ~620$'ın üzerindeki kabul, yüksek seviyelere geri dönüşü destekliyor Bu, bir katalizör ortaya çıkmadığı sürece aralığa bağlı bir haftayı destekler Yukarı yön genişleme olmadan sınırlanır ve aşağı yön trend kırılmadığı sürece kontrol altına alınır SMH/QQQ oranı yeni zirveler yapıyor ve yükselen MA'nın üzerinde hızlanıyor Yarı iletkenler QQQ'dan kesinlikle daha iyi performans gösteriyor Liderlik dar ama güçlüdür Geniş çaplı bir yenilemeden önce pazar böyle görünmüyor Temel nüans, eğimin dik olması → kısa vadede uzamış olması, ancak trendin bozulmadan kalması, farklılaşmaması SMH/QQQ yükselen MA'nın üzerinde kaldığı ve yapısını bozmadığı sürece, QQQ geri çekilmeleri trend sonu değil istatistiksel olarak satın alınabilir ve bu, bu hafta deep QQQ kırılımı olasılığını doğrudan azaltır AAPL ölü bir ağırlıktır, ancak bozulmaz, dolayısıyla bu bir tehdit değil, engeldir MSFT, QQQ'dan aktif olarak çıkarım yapıyor ve bu, QQQ'nun neden yarı yarıya daha yüksek takip etmediğini açıklıyor çünkü MSFT'nin zayıflığı, diğerleri takip etmediği sürece tek başına QQQ'yu bozmaz NVDA patlayıcı değil destekleyicidir ve kırılma yerine SMH gücü/QQQ sıkıştırmasıyla mükemmel şekilde uyum sağlar, böylece NVDA bir dengeleyici görevi görür ve bu da yine olumsuz hızlanmaya karşı çıkar. META, trend başarısızlığının göstergesi değil PLTR volatiliteye rağmen risk iştahını destekliyor TSLA tersten esen bir rüzgâr ama aylardır öyle; burada yeni bir şey yok Yandan yukarıya aralık dahilinde (≈60–65%) QQQ'nun elinde ~608-612$ var 610$ – 625$ arasında döner Zayıf MSFT'ye rağmen bozulamıyor Herhangi bir düşüş hızlı bir şekilde satın alındı Güçlü SMH/QQQ oranlarının genellikle ürettiği şey tam olarak budur Boğa Genişlemesi (≈25%) ~625$ → 632$–637$ üzeri kırılma MSFT'nin istikrara kavuşmasını (toplanmayı bile değil), NVDA'nın yüksek aralıklara doğru ilerlemesini ve SMH/QQQ teklifinde kalmayı gerektirecektir Bu tetiklenirse, QQQ muhtemelen ATH likiditeyi hızlı bir şekilde etiketler Ayı Dağılımı (≈10–15%) ~608$ kayıp → test ~602$ SMH/QQQ'nun devredilmesini (henüz gerçekleşmiyor), NVDA'nın kesin olarak 180$ kaybetmesini ve MSFT'nin daha düşük hızlanmasını gerektirir Bunlar olmadan, olumsuzluk muhtemelen kontrol altında ve düzeltici olarak kalır Risk SMH/QQQ MA'nın altındadır ( her şeyi yeniden değerlendir ), NVDA < ~$180 (QQQ aşağı yönlü risk artışları) & MSFT < ~&470 (baskı, ancak yine de tek başına ölümcül değil) Yarılar bandı taşıyor QQQ'nun bu hafta hem boğaları hem de ayıları hayal kırıklığına uğratma olasılığı trendden daha fazla hard AAPL META MSFT NVDA PLTR TSLA CASUS QQQ
QQQ (26 December)

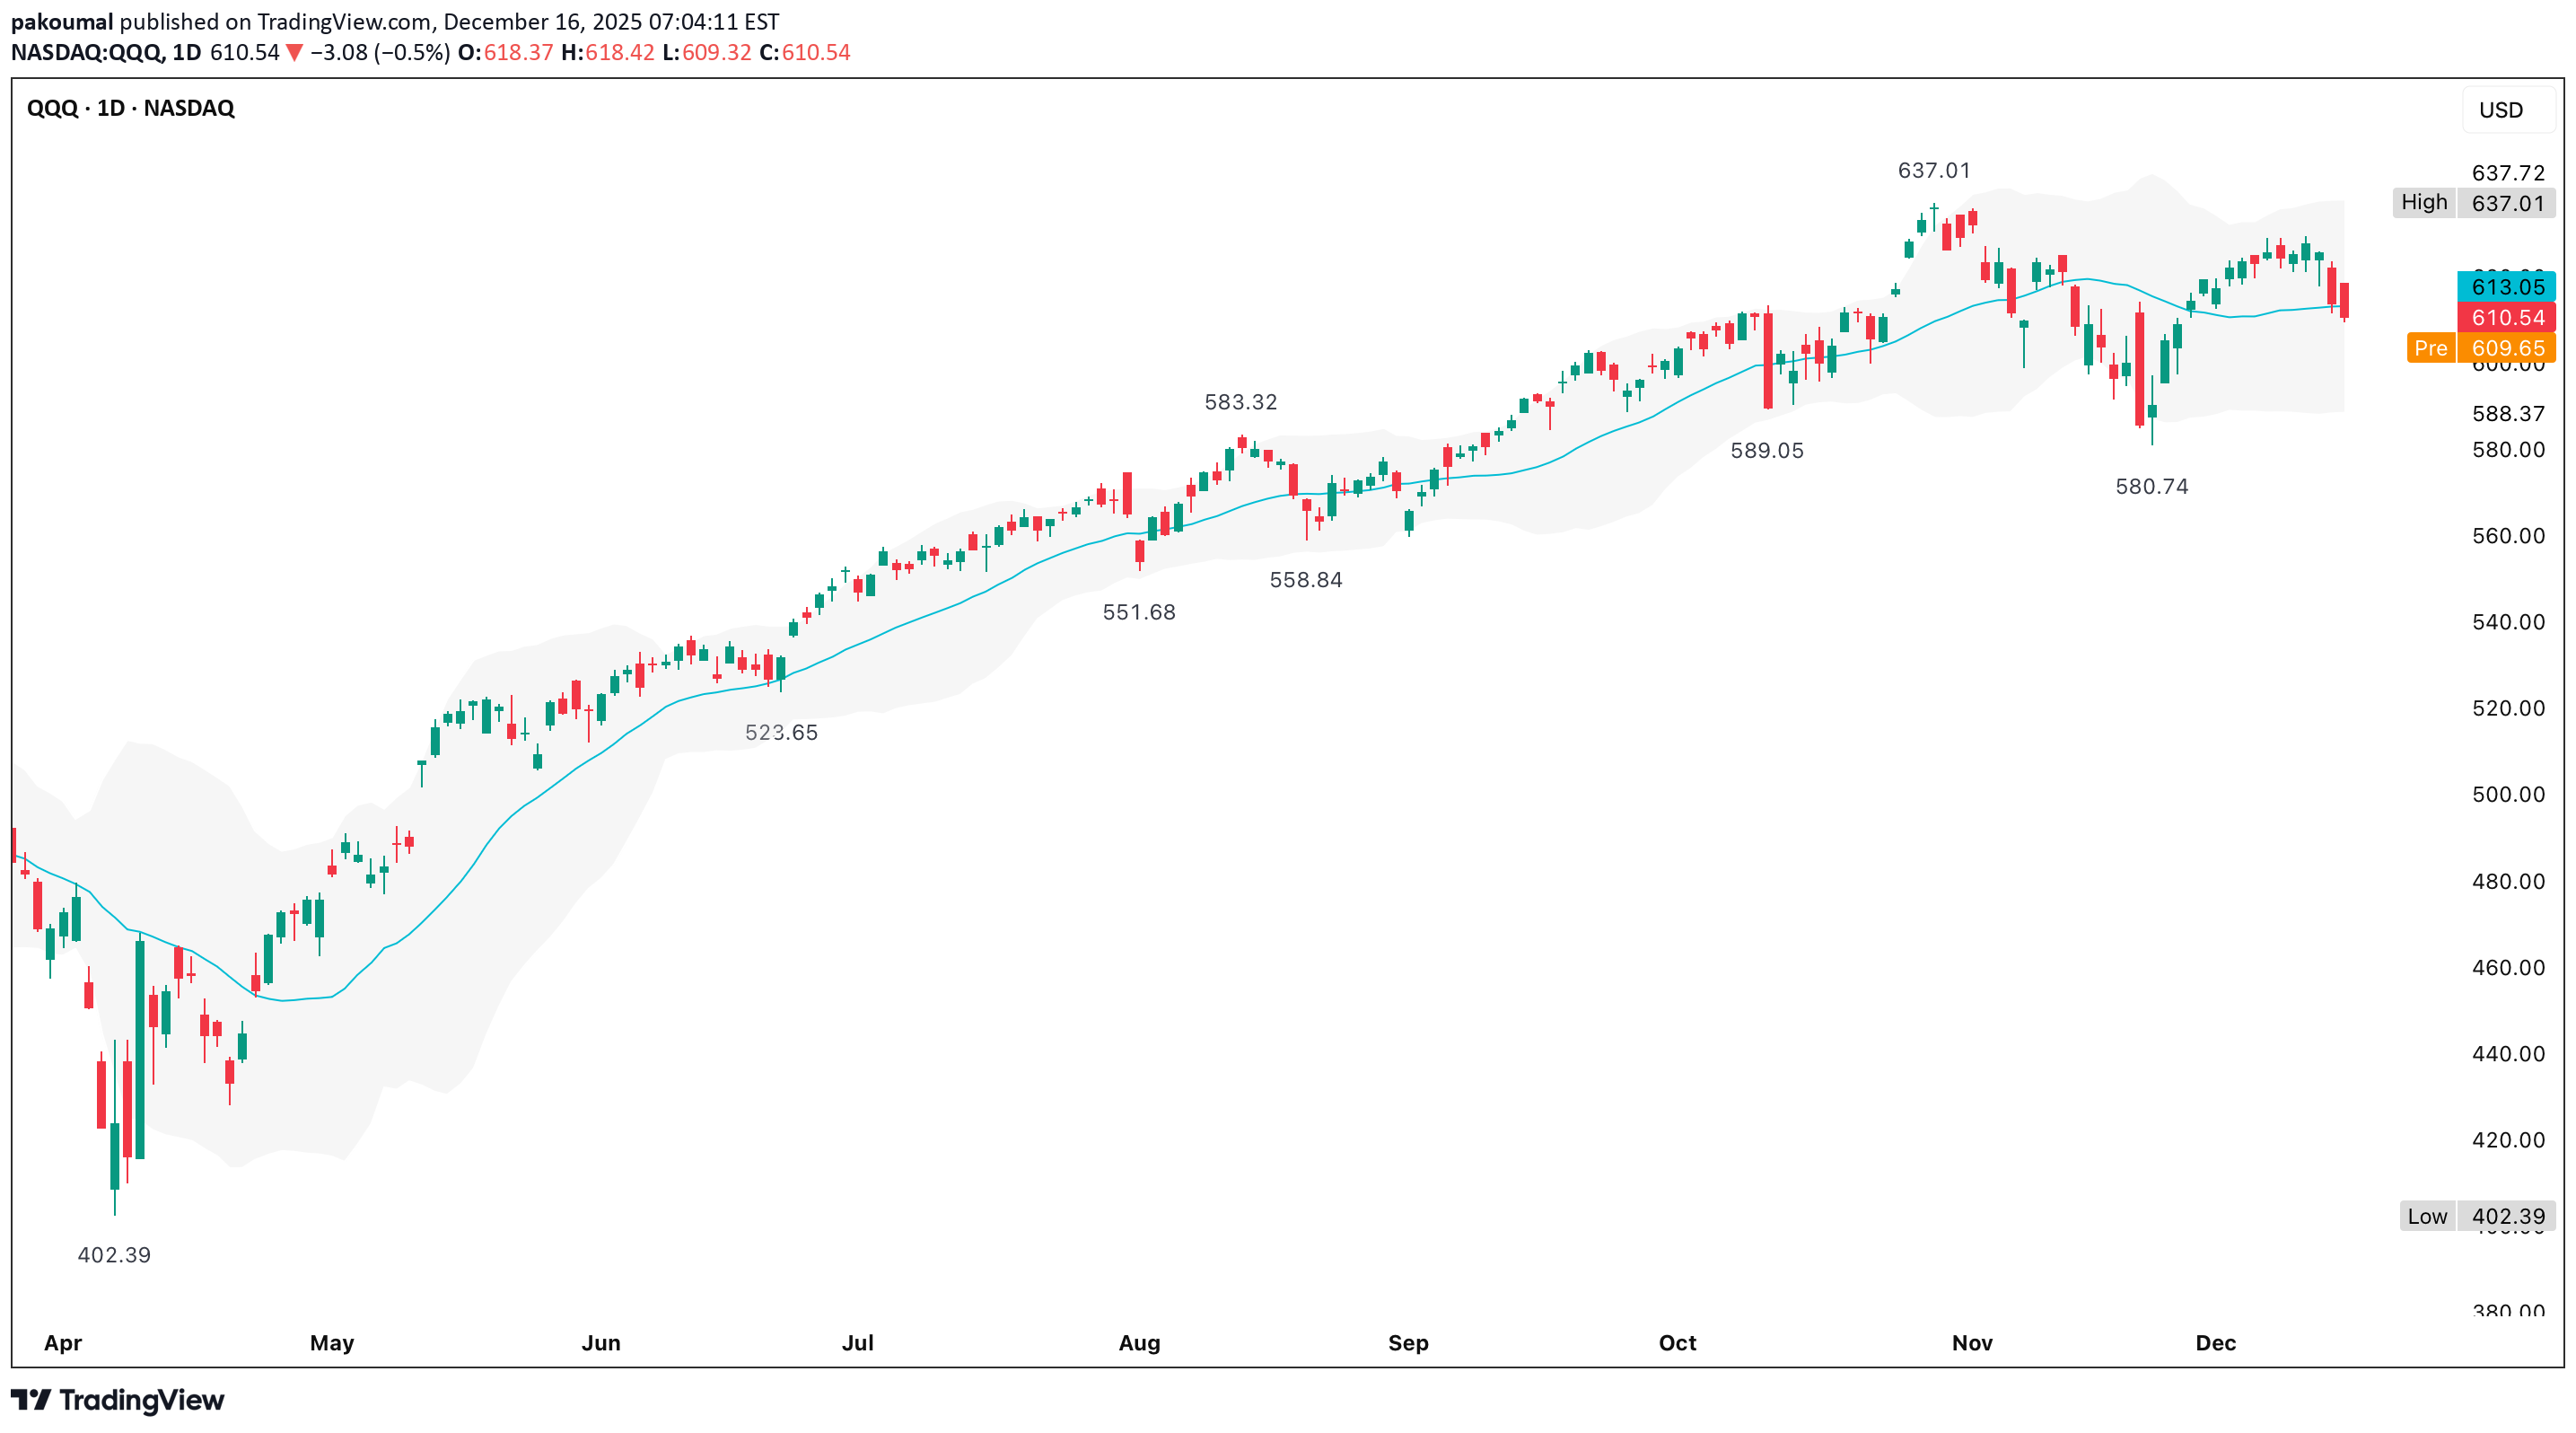
Ana trend yükselişte (Nisan ayının en düşük seviyesi ~402$'dan bu yana net bir dizi yüksek zirve/yüksek düşük) Reddetmek değil, yükseklere yakın konsolidasyon Son ~6 haftada yaklaşık 600-637$ Fiyat pozitif bir eğimle yükselen 20 günlük hareketli ortalamanın üzerinde kalıyor Geri çekilmeler, önceki salınım düşük seviyelerinin üzerinde absorbe ediliyor, onları kesmiyor Bantlar Ekim-Kasım aylarına göre önemli ölçüde daraldı Yüksek düzeydeki sıkıştırma istatistiksel olarak genişlemeyi destekler Bu bir trend duraklamasıdır, zirve formasyonu değil; yapı bozulmadığı sürece 600 dolar geçerli olduğu sürece düşüş yönlü söylemler henüz erken (varsayılan önyargınız düşüş yönlü olmamalıdır) 1. Fiyat 637 doların üzerinde kapanırsa Bunu trendin devamı olarak değerlendirin Ezilmeyi değil, genişlemeyi bekleyin Ara katılımı tercih edin, kaybolmayı değil 2. Fiyat 600-637$ arasında kalırsa Piyasa nötr/aralığa bağlı Premium satışı veya küçültülmüş bedenleri tercih edin Yönlendirici mahkumiyetten kaçının 3. Fiyat 600$'ın altına kapanırsa Boğa trendi yapısal olarak hasarlı Uzun pozlama taktiksel hale gelir, core 580 ila 550 Dolar arasında daha derin bir sıfırlama bekliyoruz 600 doların üzerinde geçerli bir düşüş tezi yok Çıkış Yapan Oyun (637$+) Günlük kapanışta giriş >637$ ve isteğe bağlı eklenti ilk geri çekme ile 630-632$ tutarda Geçersiz kılma, günlük kapanışın 630 doların altına düşmesiyle gerçekleşir Bu bir volatilite genişleme ticaretidir, yavaş bir trend eklentisi değil Geri Çekme Alımı (600-615$) red günde 600-615$'a giriş Bunu günlük yükseliş mumu izler (gün içi gürültü değil) Günlük kapanışta dur <600$ = çıkış, tartışma yok Önceki kırılma, artan MA'lar ve önceki talep yanıtıyla uyumludur (580,74 $) Savunma Değişimi (<600$) Net deltayı azaltın Olumsuz riskten korunma veya kısa vadeli kısa vadeli risk ekleme Volatilitede artış bekleniyor ve ortalamaya dönüş başarısız oluyor 1. 637 Doların üzeri → yönlü Çağrı borç spreadleri (30-60 DTE) Açık çağrılardan kaçının (IV genişleme riski her iki yönde de kesintiye uğrar) 2. 600-637$ arası → gelir Demir akbabalar Kredi spreadlerini yalnızca 600$'ın üzerine koyun 3. 600 Dolara Yakın → Asimetrik Uzun Nakit teminatlı putlar (600 $ veya 610 $) En kötü durum olarak yapısal desteğe atandı 4. 600 Doların altında → sigorta/hedge Borç spreadlerini koy Olumsuz prim satmaktan kaçının Her haftanın sonunda kendinize şunu sorun: QQQ 600 doların üstünde mi yoksa altında mı kapandı? Daha yüksek bir yüksek mi yoksa daha yüksek bir düşük mü yaptı? Günlük MA hala yükseliyor mu? Oynaklık arttı mı yoksa daraldı mı? Avantajınız, seviyenin karar vermesini beklemekten gelir, tahmin etmeye çalışmaktan değil
QQQ (19 December)
QQQ 612$'ı elinde tuttuğu sürece aşağı yönlü risk azalıyor ve 618$'ın üzerine çıkılması bunu bir sıçramadan üsse dönüştürüyor ~600$'dan ~612-615$'a kadar daha yüksek dipler oluşuyor Fiyat, zaman aralıklarında geri kazanılan değerin (612-615$) üzerinde seyrediyor Bu, ani düşüş eğilimi senaryosunu geçersiz kılar RSI ortalamaya dönüş değil, yükselişin devamı momentumudur Stoch daha düşük zaman dilimlerinde aşırı alımda ancak fiyat desteği kırmadığı sürece bu bir satış sinyali değil Momentum fiyatı destekliyor, ona karşı sapmıyor 612 dolara doğru ilerlemede hacim artışı Duraklatmalarda yüksek satış hacmi yok Bu kontrollü bir alımdır, sadece kısa pozisyon kapatma değil, sıçramanın gücünü artırır 1. 615 Dolar artık kritik destek ve geri çekilmelere devam edilmeli Fiyat 615$'da kalırsa piyasa bir temel oluşturuyor demektir 2. Fiyatın 618-620 Dolar arasında olmasını bekliyoruz Reddetme yalnızca fiyat 615 doların altına düşerse önemli olur 3. 625$ Eğer 620 dolar kabul ile kırılırsa, fiyat büyük ihtimalle hızlı bir şekilde buraya doğru hareket eder Bu, güçlü bir şekilde yükselişin devamını destekleyecektir 4. 615 $'lık kayıp, ardından 612 $'lık kayıp, fiyatı tekrar dengeye/kesintiye sokar; henüz trendin başarısızlığı değil, ancak kısa vadeli alımlar için kötü 615 dolar tutunduğu sürece yükselişte kalmak haklı Piyasa, sıçrama başarısızlığı riskinden bir temel oluşturmaya doğru kaydı Ayılar 612 dolarda kontrolü kaybetti Boğaların parayı tamamen geri alabilmesi için 620$'dan fazlasına ihtiyacı var Şimdi mesele momentumun yeterince hızlı bir şekilde devam edip etmediğiyle ilgili
QQQ Market Open Playbook
Ekim-Kasım dönemindeki baskın yapı hâlâ ayakta ancak ivme açıkça arttı Fiyat şu anda Kasım ayının en yüksek seviyesindeki sabit VWAP'nin altında ve Kasım ayının en düşük seviyesindeki VWAP'nin hemen üzerinde seyrediyor Bu artık trendleri takip eden bir bölge değil Hızlı bir şekilde geri alınmadığı sürece bu menzil/dağıtım davranışıdır RSI ~50-ortası-50 aşağı doğru iniyor; Stokastik derinden aşırı satışta ve hala daha düşük seviyeyi işaret ediyor, dolayısıyla aşağı yönlü baskı henüz tükenmedi ~608-610$'ı tutamamak, 580-585$'a doğru ölçülen bir move açar ve bu da önceki taleple paraleldir VWAP(yüksek) geri alınıp tutulmadığı sürece eğilim (4H) düşüş yönünde nötrdür Yükselen takoz kırılımı net ve doğrulandı Mola sonrası yeniden test 615-618 dolar civarında başarısız oldu Fiyat hem sabit VWAP'lerin altında hem de VWAP(yüksek) artık direnç görevi görüyor Arıza sırasında satış baskısı arttı, ancak takip düzenli oldu, panik olmadı, bu da teslimiyetin değil kontrollü dağıtımın olduğunu gösteriyor RSI 30'un ortasındas ve daha düşük trendde; Stokastik düşük seviyede sabitlendi, dolayısıyla yükseliş sapması yok Fiyat hacimle birlikte ~613-615$'ı geri almadığı sürece eğilim (1H) düşüş eğiliminin devamıdır Önemli bir nüans, düşen takozların yalnızca genişlemeyle birlikte kırılmaları durumunda yükselişe geçmesidir ve şu anda hacim anlamlı bir şekilde genişlemiyor Çift dip girişimi yapısal olarak zayıf ve 2. düşük seviye momentum farklılığının doğrulanmasından yoksun Fiyat, yukarı yönlü girişimleri sınırlayan VWAP'nin (yüksek) altında düşüyor 1. Yükseliş (şu anda daha düşük olasılık) 608-610$'ı tutun Kır ve tut > 612$ Hedef 615-618 ABD Doları (VWAP(yüksek) + önceki tedarik) 2. Ayı (temel durum) 608 $ kaybet 602 $'ın altında hızlı kabul, ardından 595 $, daha büyük 4 saatlik hedef olarak 580-585 $ Aşağıdakilerden herhangi ikisi meydana gelirse düşüş eğilimini yeniden değerlendiririm: Demirlenmiş VWAP'yi Kasım ayının en yüksek seviyesinden geri alın ve tutun 1 saatlik RSI, net hacim genişlemesiyle >50 ve 15m kırılmasını geri aldı O zamana kadar mitingler takip edilebilir değil, satılabilir görünüyor ~ 608,50 $ seviyesindeki ön piyasa, körü körüne güvenebileceğiniz bir destek değil, karar seviyesinde duruyor 1. Düşüş eğiliminin devamı (temel durum) Kısa kurulum (tercih edilir) Fiyat her iki sabit VWAP'nin altında, yükselen takoz sonrası kırılma, zayıf momentum Giriş $612-$615 VWAP(yüksek) + önceki arıza rafı İdeal giriş güç değil reddedilmektir Durdur (geçersiz kılma) >618,50$ (15m kapanış) VWAP(yüksek)+ yapısının üstünde Buranın üzerindeki herhangi bir şey düşüş yapısını olumsuz etkiler Hedefler 608$ – düşük aralık 602$-600$ - gün içi likidite 585$-580$ - 4 saatlik hedef, sabit VWAP(düşük) + ön talep Ne doğru olmalı Mitingler çakışıyor ve düşük hacimli VWAP(yüksek) reddetmeye devam ediyor RSI ilk yarıda 50'yi geri kazanamadı 2. Uzun Karşı Eğilim (yalnızca koşullar tetiklenirse) Uzun kurulum (tepki ticareti, trend değil) Onaylandıktan sonra 608-610$ tutarında beklemeye alınan giriş 15m >612$ Çıkışta hacim genişlemesi Bu 3 şey olmazsa çok sürmez Durdur <$607,80 Hard dur; tolerans yok Hedefler 615,80 ABD Doları - 618,00 ABD Doları (VWAP(yüksek)/tedarik) Yalnızca VWAP'nin (yüksek) üzerinde kabul edilirse 620-622 ABD Doları Bu uzun süre yalnızca ortalamaya geri dönüş anlamına gelir, bu nedenle fiyat 618 doların üzerini kabul etmediği sürece trendin devam edeceğini varsaymayın 3. Yüksek zaman dilimi (en önemlisi) 608,00$ Yukarıda tutmak = aralık hala hayatta Aşağıda kaybetmek ve kabul etmek = olumsuz hızlanma Hızlı move'yi 608 doların altında görürseniz, 1-2 mum içinde (15m) başarısız geri alma işlemi görürseniz, o zaman bu bir sahtekarlık değil, devamıdır 1. Düşüş hizalaması 1 saatlik RSI <45 VWAP(yüksek) genel gider Azalan hacimde 15m sıçrama 2. Yükseliş eğilimi (onay gerektirir) 1 saatlik RSI >50 VWAP(yüksek) geri alındı ve tutuldu Hacim > önceki ortalama ile 15m kırılma Farklılık yok = tahmin yok
QQQ Santa Rotation?
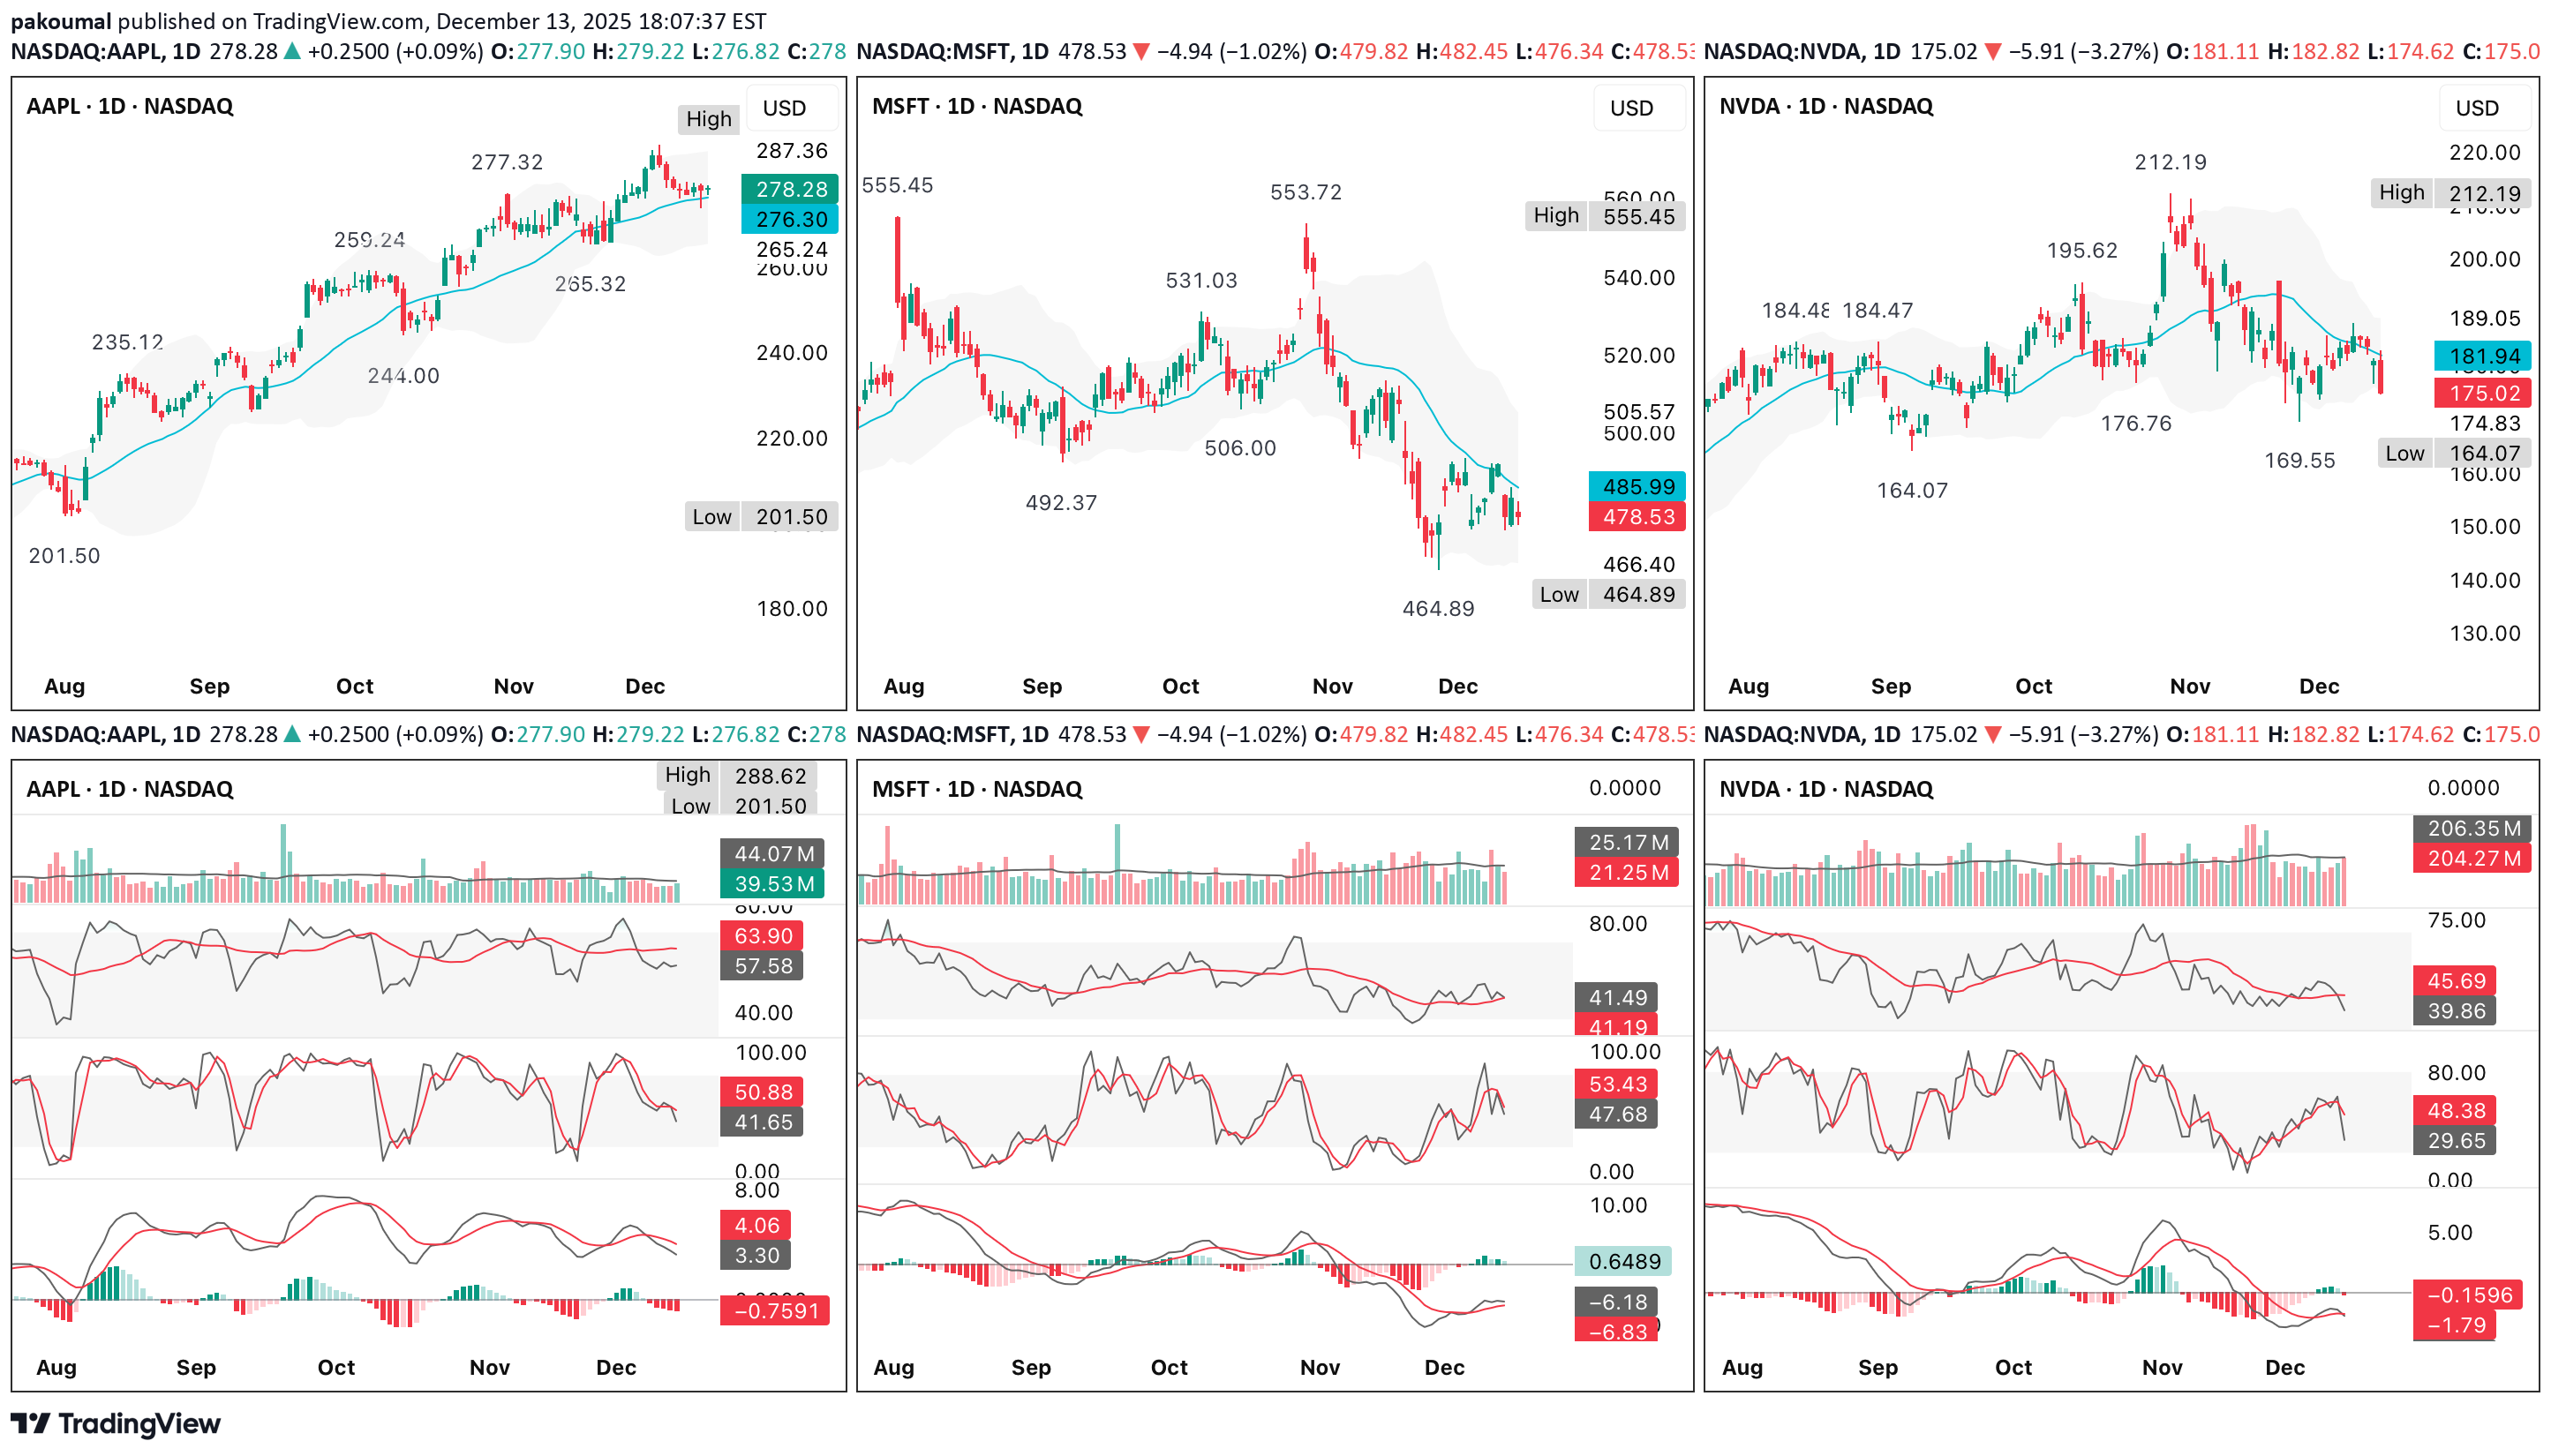
A look at the component charts lines up very cleanly with the broader QQQ direction into 2026 I am deliberately skeptical & weighting what usually leads, not what feels bullish/bearish emotionally 1. Clear leadership split or still acting well/potential leaders AAPL Above rising short-term MA, shallow pullback, no real momentum damage RSI mid–upper range, MACD only mildly negative This is not distribution behavior GOOGL Trend intact, pullback to rising MA, RSI still elevated Looks like digestion, not a trend break TSLA Relative strength standout Higher lows, bullish stochastic reset, MACD turning up This is classic “risk appetite not gone” behavior These names usually don’t hold up if a real index leg down is imminent 2. Neutral/repair mode AMZN Choppy range, sitting near mid-range support Momentum soft, but not breaking down META Sharp correction already occurred Now basing above recent lows; momentum trying to stabilize Damage done, but selling pressure clearly slowing These look more like already paid the price, not just starting to fall 3. Clear weak links NVDA Lower highs, weak bounce attempts, RSI sub-50 This is the most important chart psychologically MSFT Clean breakdown from November high Momentum still negative, rallies sold AVGO Earnings gap down with volume This is real distribution, not noise NFLX Continued downtrend, no strong reclaim yet These are dragging QQQ, but note that most of this damage is already visible, not hidden Breadth signals suggest that this is not a panic tape Across almost all charts RSI mostly 40-55, not 30s, stochastics cycling, not pinned & MACD negative but flattening, not accelerating, so this is controlled rotation, not liquidation If this were setting up a fast move to QQQ ~$590 immediately, you’d expect more RSIs < 35, more impulsive downside candles, & failed bounces across all mega-cap leaders This implies for QQQ that the most probable path (highest odds) is a bounce first, then decision Weak semis + MSFT = cap on upside AAPL/GOOGL/TSLA = downside protection That argues for a reflex rally (likely into $620-$625 area on QQQ) Followed by stall/compression, not instant ATHs Then a test of either higher low → Santa continuation or rollover to the $590s later A lower-probability, but valid alternative is if NVDA loses its recent lows decisively & AAPL breaks its rising MA Then the market probably hasn’t finished the reset That’s when the $590s become much more likely Right now, that confirmation is not present Forget narratives - these are the objective tells 1. Does NVDA fail another bounce under its 20-50d MA? If yes → drag continues 2. Does AAPL hold its rising MA on any dip? If yes → index downside limited 3. Does TSLA continue to make higher lows? Risk appetite intact if it does 4. Does AVGO stabilize instead of cascading? Big for semis sentiment If 2 of those 4 fail simultaneously, odds shift toward deeper downside If 3 of 4 hold, Santa odds rise materially This looks like a rotation-driven reset, not a market that’s done yet, but also not one about to collapse A bounce into mid/late December is the statistically cleaner path from these charts The real question is whether that bounce builds structure or fails quickly Market wants to rally, but breadth is questionable & that regime typically resolves 1 of 2 ways “Rotation Santa” (index grinds up even as laggards stay laggards) “Breadth rug pull” (leaders finally roll & index drops fast) If you get 3+ of these, odds tilt toward Santa succeeding even with semis weak & QQQ holds the prior swing low on the daily (no lower-low close) AAPL/GOOGL remain above their rising short-term trend (20ish day look) VIX is not making higher highs during down days (complacency returning) Down days are smaller-range than the earlier selloff (volatility compression) New lows list is not expanding while price chops (internal stabilization) If instead you get QQQ makes a lower-low close, AAPL breaks trend & fails the reclaim within 1-2 sessions & semis keep making fresh lows, then the “bounce to ~$620-$625 fade” becomes the base case & $590s stays in play You’re looking for structure + absorption, not fireworks into 23-27 December Higher low(s) on the 1H/4H while daily holds support Inside-day or breakout (tight range resolves up) Closes near the high of day on at least 2 of those sessions Up days on average/low volume is fine (holiday), but down days must be low volume too (no distribution) Leadership breadth improves slightly & you don’t need semis to lead, you just need fewer new breakdowns RSI on QQQ stabilizes above ~45-50 & slopes up MACD histogram stops getting more negative (flattening is enough) If you see that, the “Santa can start” signal is basically reset done = volatility compresses + leaders stop breaking + QQQ holds the low 23-27 December tells of what a failed Santa attempt looks like - this is the “looks fine… until it doesn’t” pattern Gap up/early strength gets sold & closes mid-to-low range (2+ times) Failure at a key reclaim level (prior breakdown level or VWAP zone) within 24-48 hours One big trend day down that breaks the range (holiday weeks hate that & if it happens, it’s meaningful) Semis continue to make new lows & it starts pulling down the “strong ones” (AAPL breaks trend, GOOGL loses MA, etc) Breadth worsens while index is flat/up (classic divergence) If that happens, the most common path is quick rejection from the bounce zone (~$620-$625 area), then a liquidation leg toward the next major support (~$590) The 3 “reset is done” triggers that I actually use QQQ higher low + reclaim of the prior day’s VWAP/anchored VWAP AAPL doesn't lose its rising trend on a closing basis (or loses/reclaims within 1 day) NVDA stops making lower lows (it can stay weak, but it just can’t keep accelerating down) QQQ AAPL AMZN AVGO GOOGL META MSFT NFLX NVDA TSLA
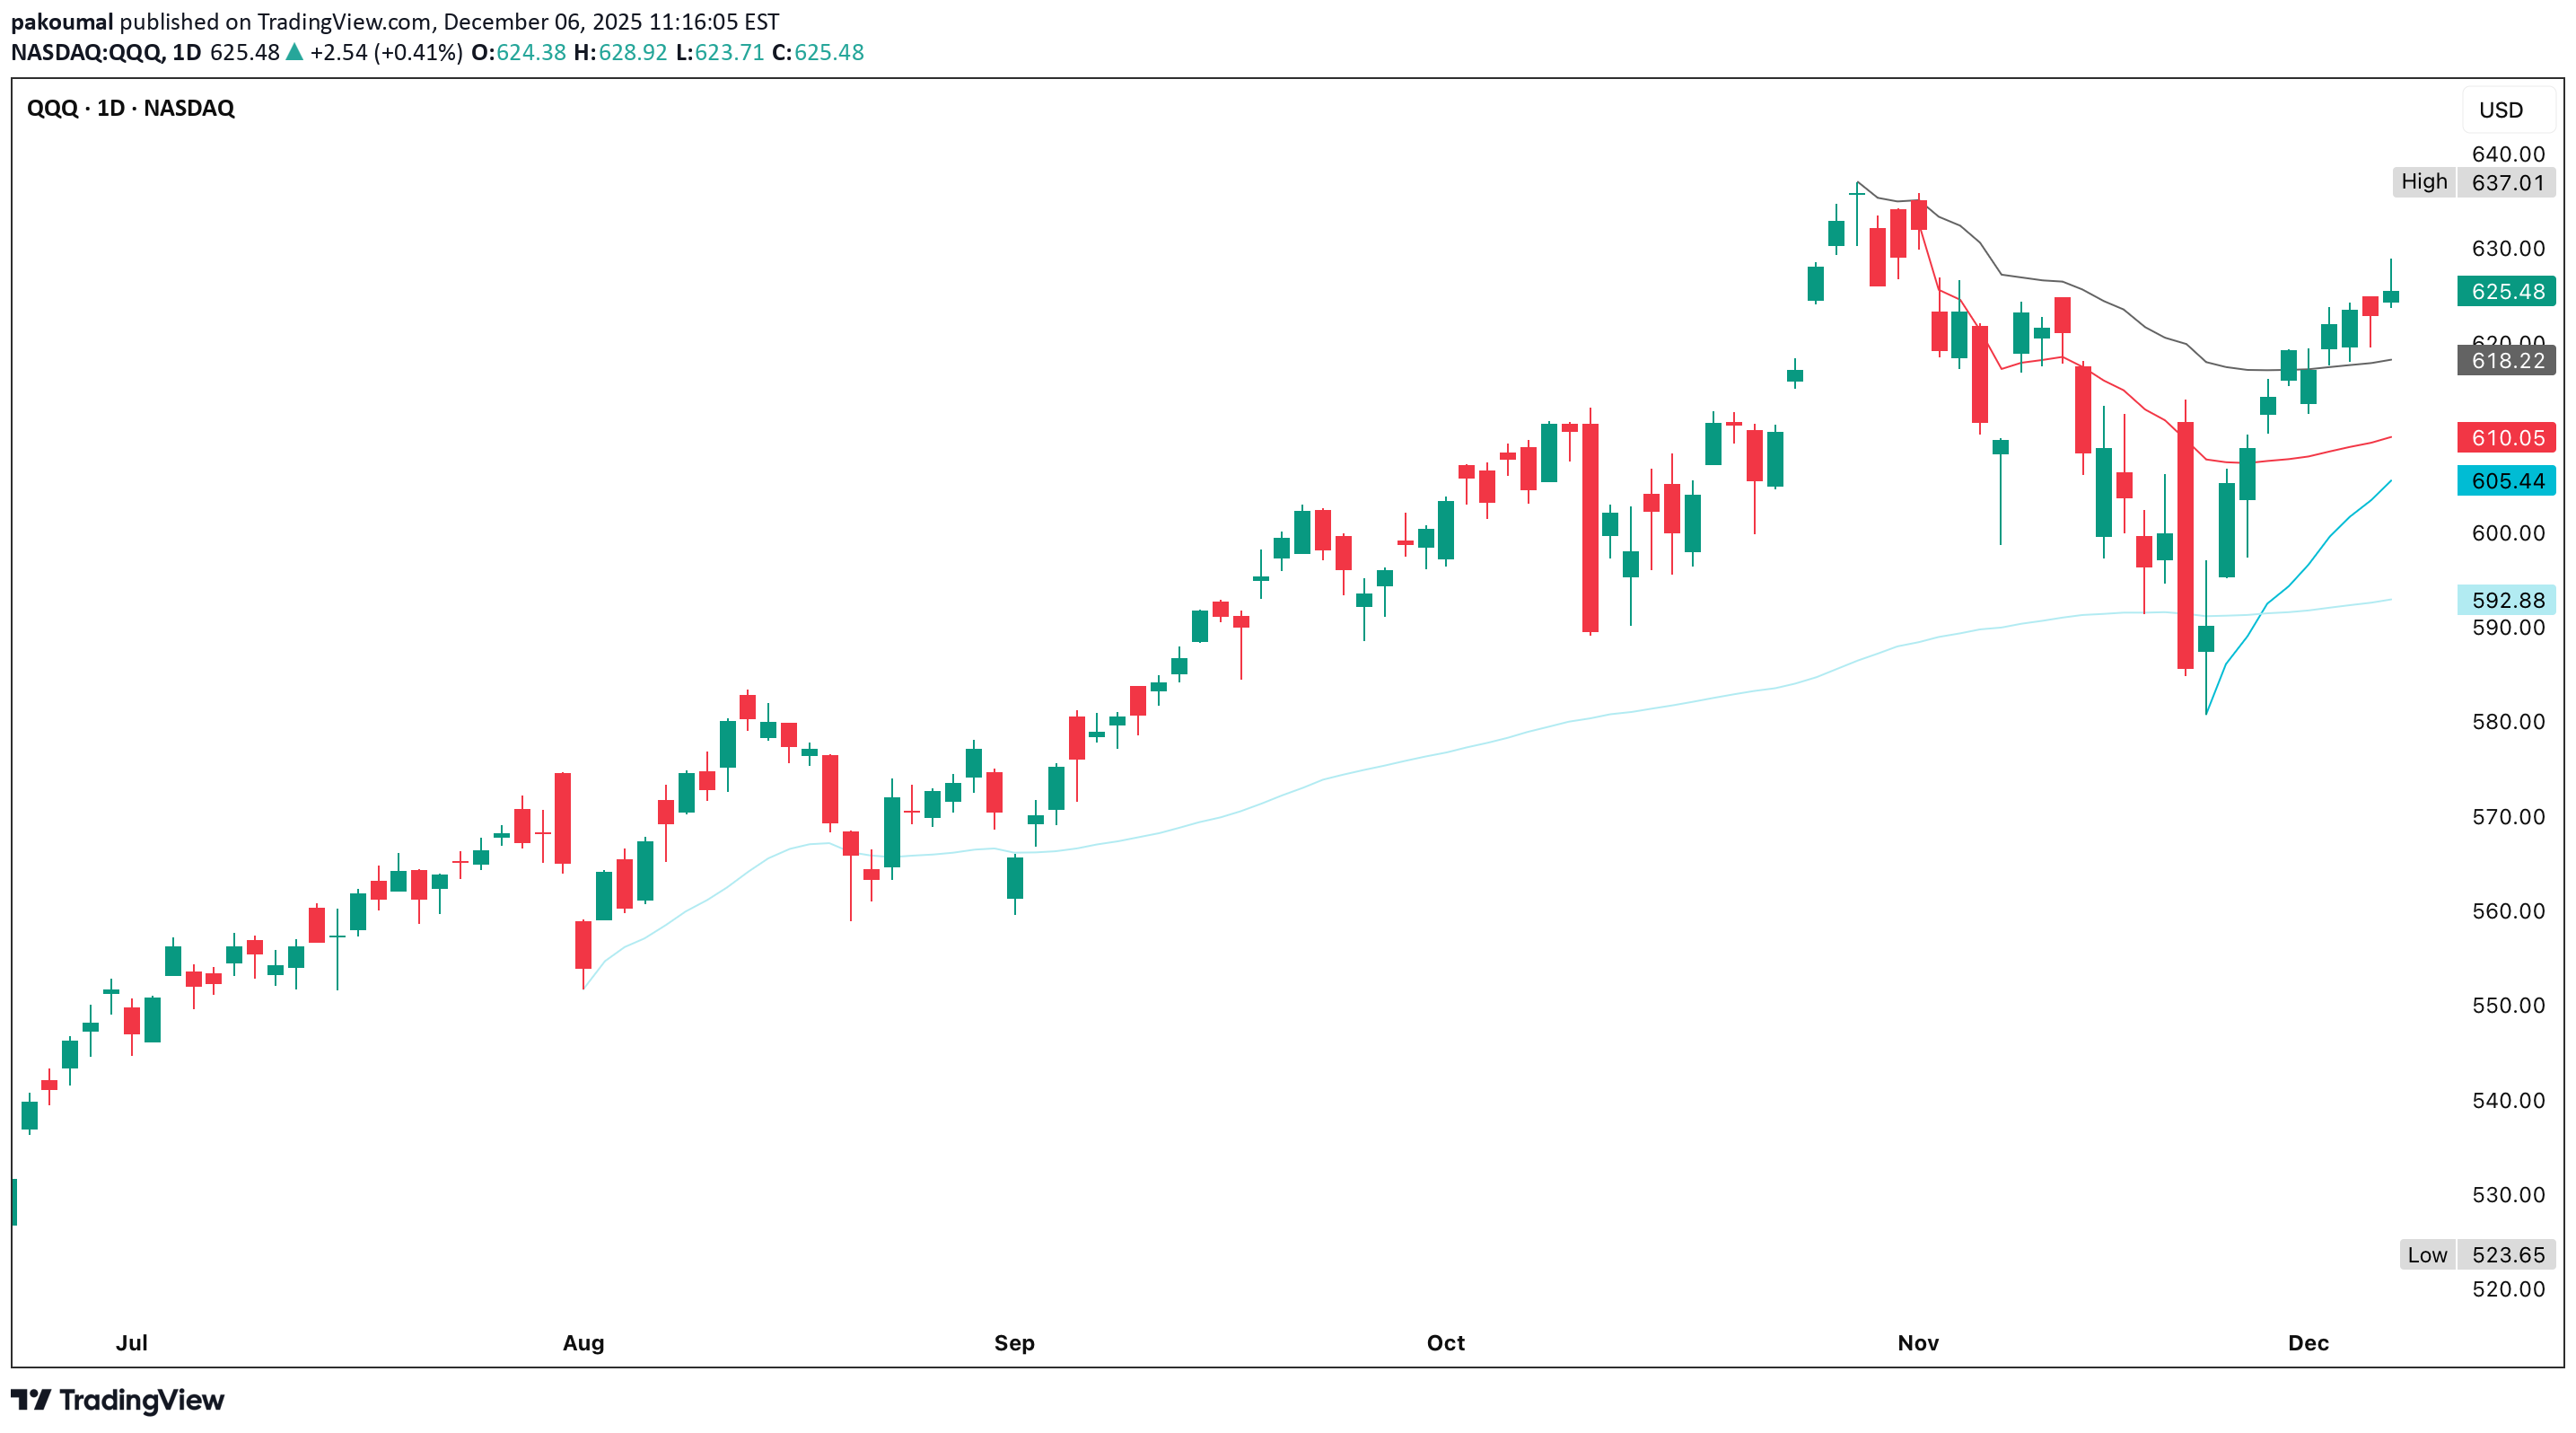
QQQ (12 December)
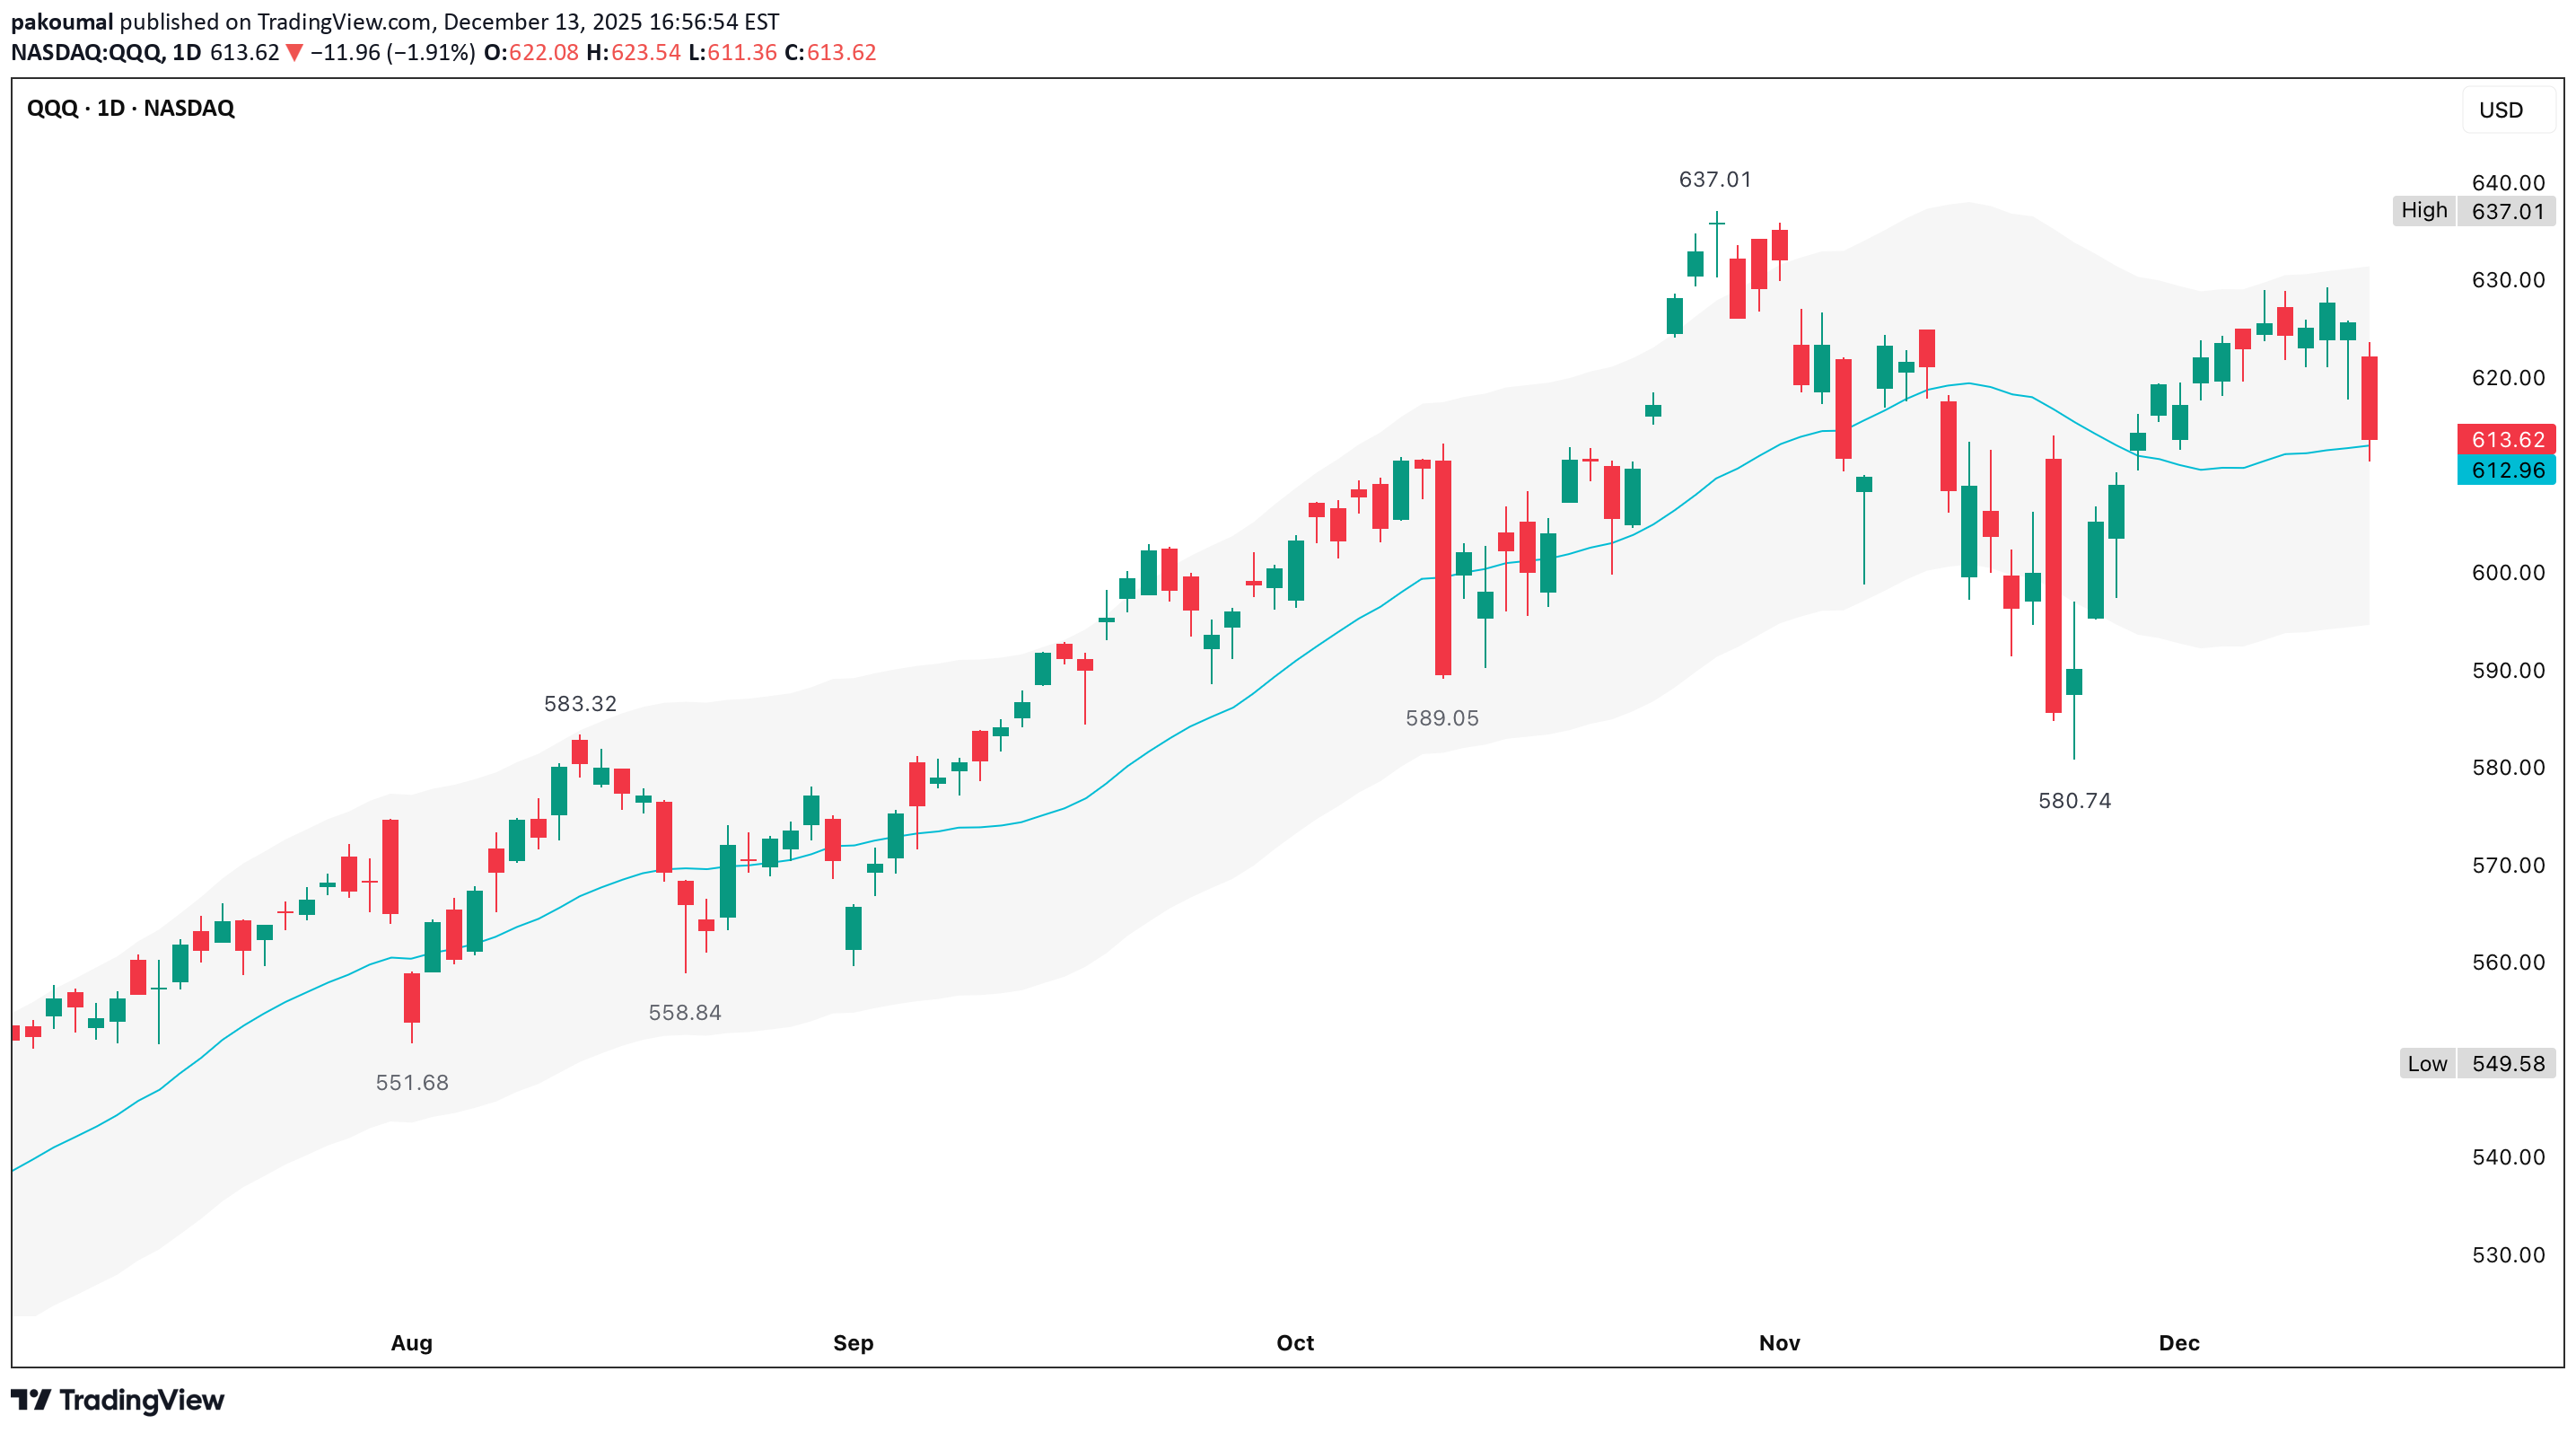
A ±3% envelope around the 20d MA does 3 important things 1. Upper band Marks short-term trend extension Rallies that fail from here often lead to multi-week digestion 2. 20d MA Control line for short-term trend Chop around it = balance, not resolution 3. Lower band (~-3%) Where momentum resets actually complete Where successful Santa rallies most often launch Price is slightly below the 20d MA & still well above the −3% band Recent selloffs have tagged the 20d MA, but not the lower band & that tells us that the reset is in progress, but not finished When Santa rallies succeed, price either 1) touches or briefly pierces the −3% band, then reclaims the 20d MA OR 2) spends enough time between midline & lower band that volatility collapses The key is whether sellers are forced to exhaust themselves & that exhaustion point lines up with ~$590-$600 The cleanest sequence for a high-quality Santa set-up is that price drifts/flushes into the −3% band & we see long lower wicks, smaller red bodies, failed follow-through on down days & price reclaims the 20d MA since Santa rally starts from inside value, not above it This leads to grind higher quietly, carry into early January & avoid sharp January reversals A weak or fake Santa rally happens when price never touches the −3% band Rallies start from above the 20d MA, upper band is hit quickly & momentum rolls again in early January The chart still argues for at least one push toward the lower band (~$590s) before a durable Santa rally - not because Santa can’t happen without it, but because momentum has not been fully neutralized & the market hasn’t forced capitulation from late longs Santa-ready = price has touched the −3% band & reclaimed the 20d MA Not Santa-ready = price still oscillating above the lower band This ±3% / 20d MA view confirms everything from the weekly MACD It visually explains why $590-$600 keeps showing up Santa rallies that start after a lower-band test are stronger & last longer Santa rallies that start before it are more fragile The weekly MACD is saying that momentum is rolling, not reversing & in strong bull markets, this exact MACD behavior typically resolves via price moving sideways-to-down until momentum resets & the trend continues - not how a major top appears The MACD is not deeply negative which argues against panic-style selling, but it does demand time or price, or both The weekly MACD does not resolve with a quick bounce to $625, or a shallow 2-3% dip It usually resolves with a 5-8% pullback, or several weeks of chop From the ~$637 high 5% ≈ $605 6-7% ≈ $595 to 590 Which lines up exactly with weekly 20 MA & prior breakout structure Structure strongly favors price visiting ~$590 since that actually resets momentum The weekly trend is bullish & weekly momentum is resetting Daily structure is corrective, 4H AVWAPs suggest balance & the 1H wedge pattern is a short-term pressure When all of those align, the most common resolution is drift/chop to a test of $590-$600, consolidate a base & rally A $620-$625 bounce can still happen inside that process, but it’s secondary, not required Test $590s, then base ~55% (base case) Chop $600-$620, no resolution ~25% ATHs without touching $590 ~15% Sharp breakdown below $580 ~5% The weekly MACD confirms a reset is underway & that reset most cleanly completes near $590-$600 A $620-$625 bounce is optional, not necessary Any move into $590-$600 that holds weekly structure is bullish, not bearish The higher-probability outcome is a test of the $590s before any Santa-rally-style push to new highs Historically, QQQ does not print new ATHs while weekly momentum is actively resetting since that reset almost always completes before the seasonal tailwind expresses itself So if there is a Santa rally, it’s far more likely to start from lower prices, not launch from mid-reset levels A move into the $590s completes a 5-7% pullback, resets weekly momentum cleanly, flushes late longs & sets up positioning for a late-December/early-January run This sequence aligns perfectly with typical late-year behavior Santa rallies that actually stick, not fail Markets prefer to rally from fear, not from complacency The one thing that would flip this quickly is if & only if price closes on the daily above $625, followed by strong acceptance Seasonality is subordinate to structure The market is resetting, not breaking Santa rally odds improve after a dip, not before $590s before ATHs is the cleaner, more durable path Any dip into the $590s that holds weekly structure is bullish fuel, not danger This SMH/QQQ ratio chart is the missing piece & it materially tilts the odds toward the base case The ratio is still in a clear uptrend, it's above its rising MA, so long-term structure is higher highs, higher lows, which means semiconductors are still outperforming QQQ on a medium-term basis, so despite the AVGO-driven selloff, leadership has not broken & that matters a lot The pullback is a mean-reversion, not a regime change In strong markets, relative strength pulls back to the MA, then either consolidates & resumes higher, or rolls over decisively (which has not happened) Semis are ~40% of QQQ’s momentum contribution QQQ rarely makes a sustained leg lower without semis underperforming The ratio holding implies any QQQ downside is corrective & not the start of a broader drawdown That supports bounce attempts, shallow-to-moderate retraces & defense of higher MAs (50d & 100d MA) This slightly changes the probability weights in my opinion vs a $590 test as highest single outcome Bounce to $620-$625, stall ~45% Bounce & range $615-$630 (no immediate $590) ~25% Breakdown to $590 test ~20% Breakout & reclaim $632+ ~10% So $590 is still very much in play, but it is less inevitable than it looked without the ratio & this is exactly why relative strength matters The $590 test would be much more likely if SMH/QQQ closes below its MA & then fails to reclaim it within ~3-5 sessions If that happens semis stop leading & QQQ likely seeks the 100d MA (~$590-$596) If ratio stabilizes and turns up, QQQ holds above $610, then the $625 test becomes constructive, not corrective I believe this ratio shows that the cause (profit-taking) is validated, the damage is contained & that the sequence still favors bounce, consolidation/decision & either delayed ATHs or a shallow reset What it argues against is an immediate waterfall to $590 The SMH/QQQ ratio says leadership is intact That reduces (does not eliminate) the odds of an immediate $590 flush A bounce toward $620-$625 is now even more likely The next decision happens at $625, not $590; unless, semis lose relative strength CPI & NFP next week are much more likely to affect intraday volatility than weekly direction since they are unlikely to invalidate the $590-$600 reset thesis unless the data meaningfully re-prices the rate path, which Powell explicitly tried to prevent so treat CPI/NFP days as liquidity events & not trend confirmation days Powell effectively said Don’t overreact to individual prints - policy is about the trend Watch where price closes, not the spike If the market uses data to explore lower value & then fails to continue, that’s bullish If it uses data to bounce, but cannot reclaim key levels, the reset continues The data does not replace the technical process - it only colors it
QQQ Implied Move Range
QQQ's implied expected move is calculated using the current option chain to find the ATM straddle (cost of ATM call + ATM put for nearest expiry) Expected Move (≈ 1σ) ≈ $0.85 × (ATM Straddle Premium) The result gives a one-standard-deviation range (≈ 68% probability) for the underlying’s move over the option’s life For a short horizon (“by tomorrow”), pick the front-month (or nearest-term) options that expire soon & use their straddle; alternatively, use annualized implied volatility (IV) converted to daily/weekly via the standard volatility-scaling formula Move = S × IV × SQRTΔ t /365 Where S = underlying price & Δ t = number of days to expiry This yields a symmetric “+/-” band, but it does not forecast direction - only the magnitude (volatility expectation) The front-month or nearest options typically price in a short-term move of roughly +/-1% to +/-1.5% around the current price, ~$625, which suggests a likely trading range for tomorrow of roughly $618 to $634 (-1% to +1.5%) The implied move is derived from option-markets’ aggregated expectations - it doesn’t tell you direction Actual price can & often does, break outside the straddle-implied band; especially, if there's a surprise (Fed tone, macro data, headlines) The implied move reflects volatility pricing If implied volatility collapses (after the event), realized moves may be smaller If IV remains elevated or rises, moves may exceed the band The “+/-1%-1.5%” range is a typical result for front-month options under normal volatility In a “event week” (like FOMC), implied volatility can be distorted, meaning the real move could be larger, or the band may understate risk Use the $618-$634 band as a “probability envelope” Markets seem to expect QQQ to stay somewhere in that range under “normal” conditions If you expect a dovish surprise - the upper half (near $629-$634) is reasonable If you expect a hawkish or cautious tone - then the lower half (near $620–$618) is better If you expect a major surprise or risk-off - plan for possible breakouts beyond that band (to either side) 1. FOMC 27 July 2022 QQQ closed @ $306.81 the day before FOMC 1 day close was $309.81 3 day close was $315.27 Actual 1 day move was +0.98% Actual 3 day move was +2.76% The 1 day move stayed within the typical implied move (~+/-1-1.5%) The 3 day move exceeded the common expected-move envelope (~+/-2-3%), driven by a surprise dovish tone 2. FOMC 14 December 2022 QQQ closed @ $297.50 the day before FOMC day close was $285.94 3 day close was $268.60 Actual 1 day move was -3.9% Actual 3 day move was -9.7% This massively exceeded the typical implied move band Implied range around that meeting was ~+/-1.5-2% & the realized move was far greater Powell pushed back on easing conditions 3. FOMC 22 March 2023 QQQ closed @ $305.00 the day before FOMC 1 day close was $309.42 3 day close was $315.57 Actual 1 day move was +1.45% Actual 3 day move was +3.47% The 1 day move landed right inside the expected band The 3 day move pushed to the upper edge or slightly beyond the common ~+/-3% implied envelope A mild dovish shift + banking-crisis risk-off reversal supported tech 1. QQQ usually stays within the implied move on Day 1 Roughly +/-1–1.5% is historically typical Breaks above +/-2% tend to occur only on strong surprises 2. QQQ frequently breaks the implied move by Day 3-5 The 3-5 day window often includes volatility expansion, trend continuation if the Fed surprises & mean-reversion if the first move was emotional 3. Surprises create the largest deviations Hawkish surprises are the biggest downside breaches (December 2022) Dovish surprises are sizable upside breaches (July 2022) 4. Base-case FOMC outcomes generally stay within the implied band Typical outcomes settle into the +/-1-1.5% Day 1 move, but still tend to fade over 3-5 days Around 70-80% of the time, QQQ stays within a “1σ” band after FOMC 20-30% of the time, it breaks out with a big move (usually driven by a surprise) The 3 day window is actually slightly more prone to exceed the band than 1 day or 5 day This suggests that 3-5 sessions after FOMC is where the real repricing happens 🕊️ Dovish Day 1 +0.5% to +1.5% Day 3 +1% to +3% if the narrative sticks Day 5 some giveback is common = net +0.5% to +2% 🧸 Base Case (“hawkish cut”/cautious) Day 1 –0.5% to +0.5% (within 1σ band) Day 3 drift –0.5% to –1.5% Day 5 further mild weakness = total -1% to -2.5% 🦅 Hawkish Day 1 -1% to -2.5% (near or beyond 1σ band) Day 3 -2% to -4% total Day 5 is either stabilization or a small overshoot lower = –3% to –5% total in a stronger shock Something like the base-case band happens ~70-80% of the time A true “shock” move (outside band, +/-3–5%) occurs roughly 1 in 4 to 1 in 5 meetings Directionally, given current positioning yield re-steepening + QQQ’s extension, I’d assign higher odds of a base or mildly hawkish outcome, so statistically, the 3-5 day fade is still my default The 3-5 session window is where the bigger, more directional, macro-driven moves happen In the current macro setup, the bias is toward the base/mildly hawkish path, which historically lines up with a contained Day 1 move, then a drift lower over the following 3-5 sessions +/-1.5% (1 day) Upside $625 × 1.015 ≈ $634 Downside $625 × 0.985 ≈ $616 +/-3% (bigger, 3-5 day) Upside $625 × 1.03 ≈ $644 Downside $625 × 0.97 ≈ $606 +/-5% (shock/tail scenario) Upside $625 × 1.05 ≈ $656 Downside $625 × 0.95 ≈ $594 1. If we close >$634, it nudges into “strong dovish” territory & day 3-5, holding above $625-$630 keeps the “wave 5 extension” idea alive; even then, a later retest of $620-$625 is typical behavior 2. A drift toward $608-$615 lines up with historical negative median returns & if QQQ breaks below ~$615 & closes there on Day 3-5, odds increase that we’re in bigger corrective territory, not just a quick shakeout
QQQ End of a Corrective Bounce?
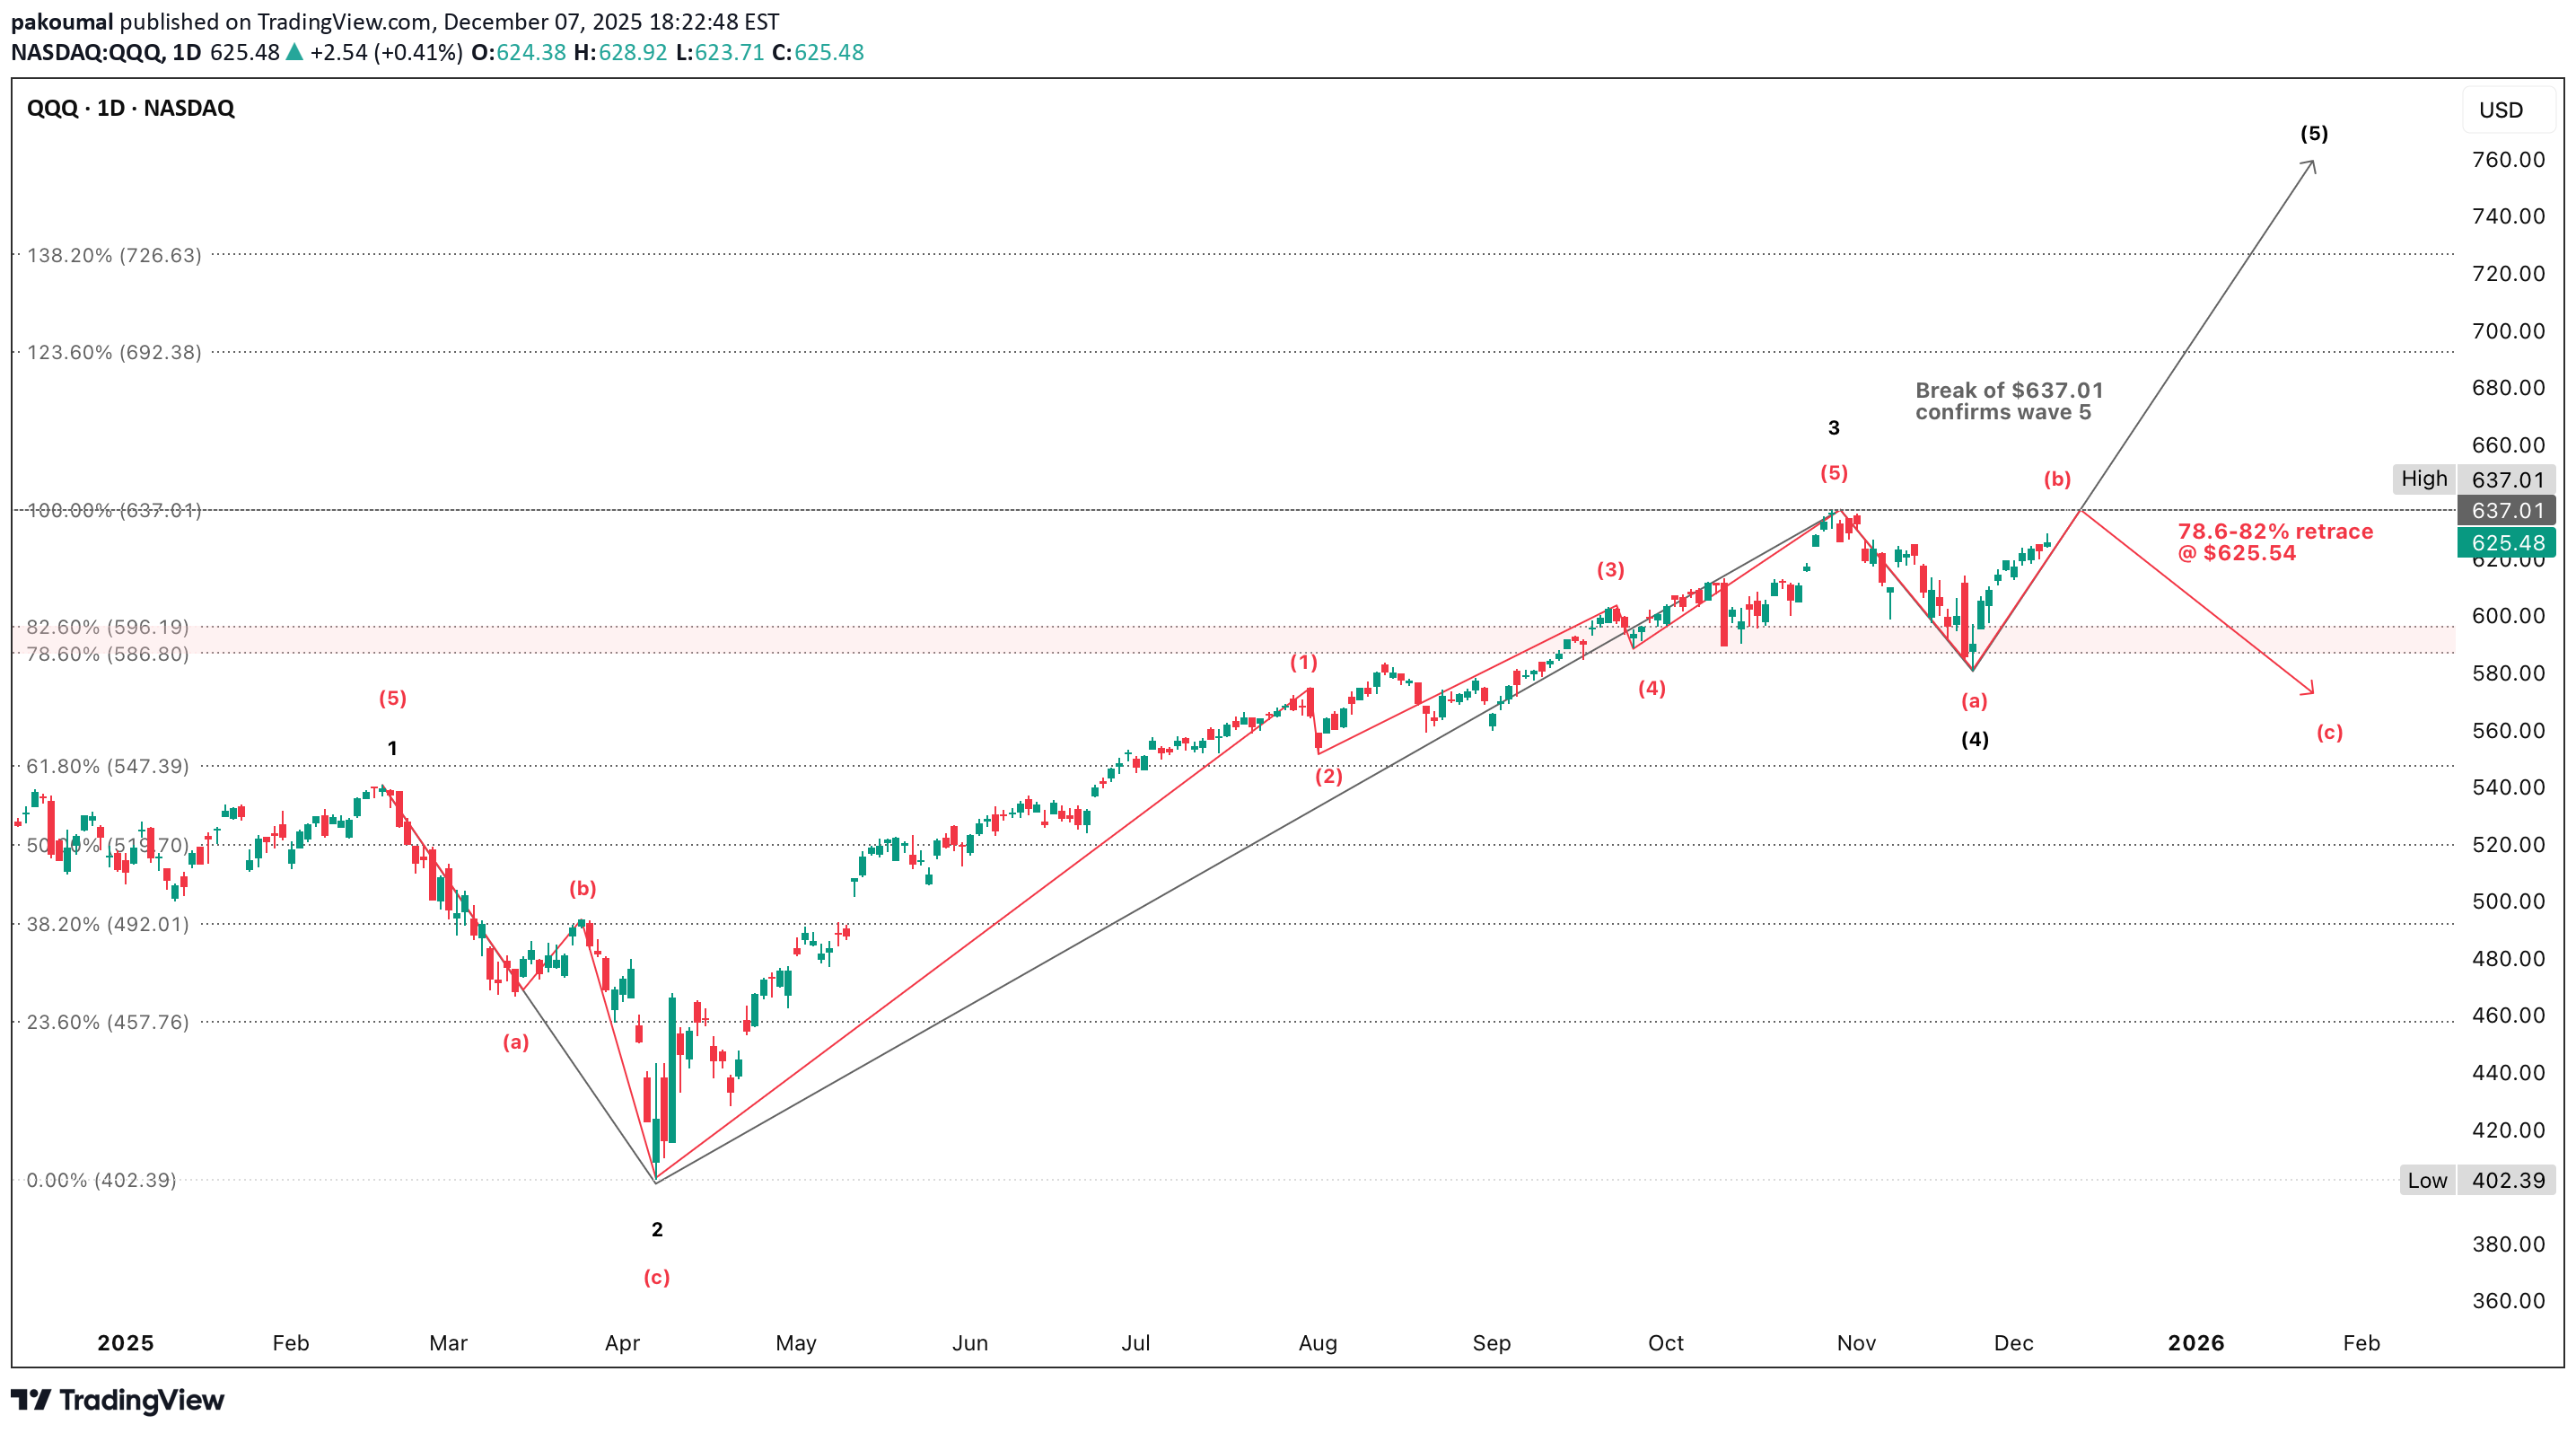
Şükran Günü yükselişi, yaklaşık 585$'lık keskin bir V-tersine dönüşüyle gerçek ve teknik olarak sağlıklıydı Alıcılar önemli MA'ları (20 gün ve 50 gün) geri aldı, osilatörler yukarıya döndü ve fiyat panik düşük seviyesinden direnç göstermeden çıktı Geçen haftaki eylem, net bir tavan altında sıkı bir sarmal oluşturdu ve bu tür kurulumlar genellikle bir katalizörün (FOMC) ardından çözülüyor QQQ gerçek bir dönüm noktasında; ne açıkça zirveye çıkıyor, ne de açıkça kırılıyor Hem geri çekilme hem de kırılma teknik olarak makul Uzatılmış momentum, zayıflayan hacim, 631-637 dolar arasındaki net direnç, birçok bileşenin güçlü olması, ancak dalgalanma olmaması ve zayıflama riskini teknik olarak inandırıcı kılan diğer kısa vadeli tükenme sinyalleri göz önüne alındığında bir geri çekilme mümkün Trend yapısının sağlam olması, alıcıların 2 hafta boyunca her düşüşü savunması, kısa vadeli AVWAP'lerin fiyat (destek) altında yükselmesi ve geri dönüş sinyali olmaması nedeniyle piyasanın drift yukarı doğru hareket etme eğiliminde olması nedeniyle bir kırılma hala mümkün En gerçekçi yol, bu hafta başında yavaş yavaş 630-633 dolara doğru ilerlemek ve FOMC'den sonra piyasa kendi yolunu seçiyor Alıcılar ikna olmazsa 612 dolardan 605 dolara geri çekilme yaşanabilir Alıcılar bir katalizör elde ederse 637 doların üzerine bir çıkış yaşanabilir "FOMC'ye sıçrama ve ardından kaybolma" temel durumu grafikler tarafından tamamen destekleniyor, ancak tek geçerli sonuç bu değil 637 doların hacimle geri kazanılması durumunda bir kırılma teknik olarak mümkün olmaya devam ediyor QQQ'nun Şükran Günü rallisi geçen haftaki konsolidasyona da taşındı ve endeks şu anda dengeli, teknik olarak nötr bir durumda dirençte bulunuyor, dolayısıyla hafta başında 630-633$'a doğru yükselebilir, ancak gerçek move (geri çekilme veya kırılma) FOMC'den sonra belirlenecek Dalga 5 ve Dalga b Bir anahtar seviye kırılana veya tutulana kadar genellikle benzer görünür ve şu anda fiyat, her iki sayının da teknik olarak geçerli kaldığı yerdir. bu yüzden kendimi çaresiz hissediyorum - doğası gereği belirsizdir, ancak belirsizliği çözen kesin düzeyler vardır 1. Fiyatın hiçbir istisna olmaksızın önceki en yüksek seviyesi olan 637,01 doların üzerine çıkması gerekiyor 5. dalga 3. dalgaya göre daha yüksek bir tepe oluşturmalı 2. 5. Dalga, genişleyen mumları göstermeli, genişliği artırmalı ve ses seviyesini artırmalıdır. direnç bantlarını itin Şu anda move dalganın dışında bir düzeltici görünümlüdür ve 5. dalga genellikle düzeltici geriye dönük testlerle başlar; ancak bir görünüme sahip a–b–c yukarı doğru düzeltme, daha yüksek yeni bir bacağın başlangıcı değil ve bu boğa durumu için sarı bayraktır 1. Fiyat dirençte reddederse, dalga b onaylandı ve 5. dalga geçersiz kılındı Fiyat genellikle dalga için yaygın olan %78,6-82'lik geri çekilme seviyesinde durur. b zirveler Fiyat 632-637 doların altına düşecek, ardından 600-605 doları kıracak ve muhtemelen 570 dolara düşecek. 2. Fiyat 637 doların üzerinde kapanırsa 5. dalga onaylanır. dönem 3. Fiyat 630-637 doları reddeder ve 612 doların altına düşerse dalga b yol onaylandı Bu grafikteki en önemli destektir. 612 doları kırın ve sıçrama düzelticiydi, bu nedenle dalga c Sıradaki Dalgadan yukarı sıçrama bir düşük daha çok bir dalgaya benziyor b Geri çekilme derinliği (~%78,6) dalgaya uyduğu göz önüne alındığında, dalga 5 başlangıcından daha düzeltme b mükemmel, azalan hacim, trend onayı olmadan esneyen osilatörler ve fiyat major direncinin altında sabitlendi 5. Dalga genellikle zayıf hacim ve üst üste gelen mumlarla başlamaz, ancak dalga b mitingler sıklıkla yapılır Dalgayı onaylamıyoruz b piyasa desteği kırana kadar zirvede Yapısal olarak grafik sağlamdır ve hiçbir hard Elliott kuralını ihlal etmemektedir Bir dalga b genellikle dalganın %61,8-78,6'sını veya bazen %100'ünü geri alır bir Mevcut ralli %78,6-82'nin (630-632$) hemen altında bulunuyor ve hatta piyasanın olaya/katalizöre yönelmesi durumunda 637$'ı bile etiketleyebilir Dalga c 5 temiz alt dalga halinde, genellikle move dalgaya paralel olarak ortaya çıkar bir & genellikle önceki itici gücün %61,8'lik geri çekilme yakınına iner Gerçekçi bir hedef 560-575$ Dalga c Düzeltme devam ederse 572 dolar civarındaki hedef makul 0,618 × dalga bir (~32 puan) 1 × dalga bir (en yaygın, ~52 puan) 1.618 × dalga bir (güçlü, keskin düzeltmeler sırasında ~84 puan) 572 dolar, dalga için 0,618 ile 1 projeksiyonları arasında c 3. dalga ilerlemesinin tamamının %50 geri çekilmesine neredeyse mükemmel bir şekilde iniyor
QQQ VWAP Based Entries
When price moves from below to above an AVWAP decisively, it signals short covering & a shift in control from sellers to buyers & when 2 or more AVWAPs converge liquidity concentrates, reversals or breakouts often happen there & these are the spots where traders take reversal trades, breakout entries, or stop placements Right now, the 3 & 21 November AVWAPs are separated, meaning trend strength When they converge, it signals compression 1. Using AVWAPs as a dynamic stop-loss is one of the simplest & most effective uses If you're long above the 21 November AVWAP, the rising blue AVWAP is your dynamic stop A close below it should signal an exit It reflects the average buyer cost basis, not arbitrary price levels 2. An AVWAP is a useful trend filter Price above rising AVWAP(s) suggests a long bias Price below falling AVWAP(s) suggests short bias When price chops around a flattening AVWAP, stay out AVWAP is a trend health indicator 3. AVWAP + candlesticks = clean entry signals The strongest signals come when price pulls back into an AVWAP, prints a small reversal candle (hammer, doji, engulfing) & ATR is declining (just like now) since these become high-quality continuation entries As a high-level playbook, anchor VWAPs at major pivots (highs, lows, breakdowns, earnings gaps), trade pullbacks into rising AVWAPs during uptrends & trade rejects from falling AVWAPs in downtrends Use converging AVWAPs as inflection points Use the nearest rising AVWAP as your stop Anchor to the close if the candle represents an event you want to capture (breakout, breakdown, a clear reversal bar, a candle where closing price indicates the market's verdict, earnings, FOMC, etc) Anchor to (H+L+C)/3 (the “typical price”) when you want a smoothed, less-biased VWAP for longer-term structures or swings Typical price reduces noice from intraday spikes & avoids sensitivity to one extreme print or over-reaction to the tails on the candle (AVWAP from swing highs/lows or the start of a trend) Price is above all AVWAPs This means all meaningful “cost basis cohorts” are beneath price The market is structurally repaired, at least in volume-weighted terms Overhead resistance from anchored supply does not exist right now This is a very different situation from when AVWAPs are stacked above price The ATH AVWAP is rising & firmly below price This is one of the best signs of long-term trend health in AVWAP analysis When the ATH AVWAP is rising, decisively reclaimed & acting as near-term support, it usually tells you the prior correction has been fully absorbed Longs from the top are no longer underwater Selling pressure from those prior buyers is neutralized Trend followers using AVWAP logic have flipped their filters back to “risk-on” This is an objective, mathematical read & not a prediction The 3 & 21 November AVWAP are now support layers 3 November (red) are breakdown-day sellers who are now underwater & this is a bullish dynamic because they can’t apply pressure 21 Nov (blue) are capitulation low buyers, still profitable & in control - primary support Together, these form a layered support around $605-$612, or the area where dip-buyers have historically stepped-in A stop-loss location for AVWAP-based trading systems Now that price is above all 3 major AVWAPs, the focus shifts to behavior around the ATH AVWAP & since price is above it already, there are only 2 meaningful reads 1. Bullish continuation setup 2. Price may pull back to the ATH AVWAP ($618) Find buyers (hammer, doji, small-range reversal) & then move away This is one of Brian Shannon’s highest-probability setups (reclaim AVWAP → pullback → higher low → continuation) Potential warning setup because trend deterioration begins with this move Price closes below the ATH AVWAP Then stays below it for multiple sessions Slope begins to flatten or roll over This would be your first objective sign that the trend is losing strength from an anchored-volume standpoint The chart shows the exact 3 level anchored VWAP system that institutional traders use A correction-low AVWAP (21 November) A breakdown-event AVWAP (3 November) A structural high AVWAP (ATH) This lets you map out short-term trend control (blue), intermediate-term supply absorption (red) & higher-timeframe trend health (gray) & right now, all of them say the same thing Price is in a state of repaired, orderly trend with all major AVWAPs providing support beneath ATH AVWAP Defines trend health at the highest timeframe visible on your chart Swing traders, late buyers at the highs, trend-following algos When price is above the ATH AVWAP then the uptrend is structurally intact When price is below it then long-term players are underwater, trend is suspect QQQ is above the ATH AVWAP (~$618) This means that ATH buyers are profitable again The first high-quality pullback often tags this line in early trend repair phases A reclaim → retest → hold sequence is extremely bullish behavior 3 November breakdown AVWAP Tracks sellers from major breakdowns or panic candles Funds that sold into weakness, systematic risk-off flows If price is above it then that entire selling cohort is underwater These traders become forced buyers on pullbacks or breakouts AVWAP ~$610 Price is above it then supply from that breakdown is absorbed This AVWAP becomes support on deeper pullbacks If price tags it then watch for immediate dip-buying 21 Nov AVWAP - capitulation Tracks the cost basis of buyers who stepped in at the emotional low Aggressive reversal traders, deep-value algos, CTA re-leveraging This is the most important rising support line in the model When price is above it, the reversal cohort is still in control A close below it often signals trend exhaustion AVWAP ~$605 Price is well above it & the slope is rising aggressively As long as price respects this AVWAP, the recovery trend remains clean If price pulls back to it then this is a high-odds rotation/continuation buy point Long-Term AVWAP This is the long rising AVWAP on your chart (~$592) It acts as deep trend support The line separating bull vs bear structure The highest timeframe “fair value” of the entire trend leg A tag here marks trend reset, not breakdown A break below this layer shifts the market into caution This long AVWAP is safely under price so the long-cycle trend remains intact When all layers are stacked in ascending order like this, you get a fully aligned bull structure, clean pullback architecture, no overhead VWAP resistance, multi-cohort profit alignment & strong continuation behavior This model is about control, not prediction & right now, the bullish alignment is simply a fact of structure These levels come directly from how institutions trade AVWAPs 1. ATH AVWAP (~$618) is the light pullback, common after a fast push off a low Signals to watch for include a hammer/doji at the AVWAP Lower wick rejection ATR contraction & reversal Reclaim → hold → push This is the first layer most swing traders buy 2. 3 November AVWAP (~$610) This is the mid-depth pullback It’s usually triggered when short-term longs trim Expect a strong buyer reaction 1-2 days of stabilizing candles Momentum traders stepping back in This is a very strong continuation level in AVWAP systems 3. 21 November AVWAP (~$605) This is the high-value dip This line is VWAP traders’ favorite It represents the true reversal cohort’s cost basis It has been respected perfectly It rises steadily each day It marks the “line of trend continuation” If price reaches this AVWAP, this is often the highest-probability buy in the entire structure Rejecting here = trend continuation Closing below = trend fatigue 4. Long-Term AVWAP (~$592) This is the deep reset, not a casual dip If price ever hits this momentum is gone, trend is resetting, higher timeframe traders reassess, hedge funds rotate & isk allocation shifts This is not a breakdown, but it is a significant tone-change You rarely see this tested unless markets enter a broader digestion phase Given the current AVWAP spacing & slope $618 (ATH AVWAP) is highly actionable $610 (3 November AVWAP) is a strong level $605 (21 November AVWAP) is an institutional-grade support When price is above all 3, VWAP traders don’t look for tops - they monitor control transitions
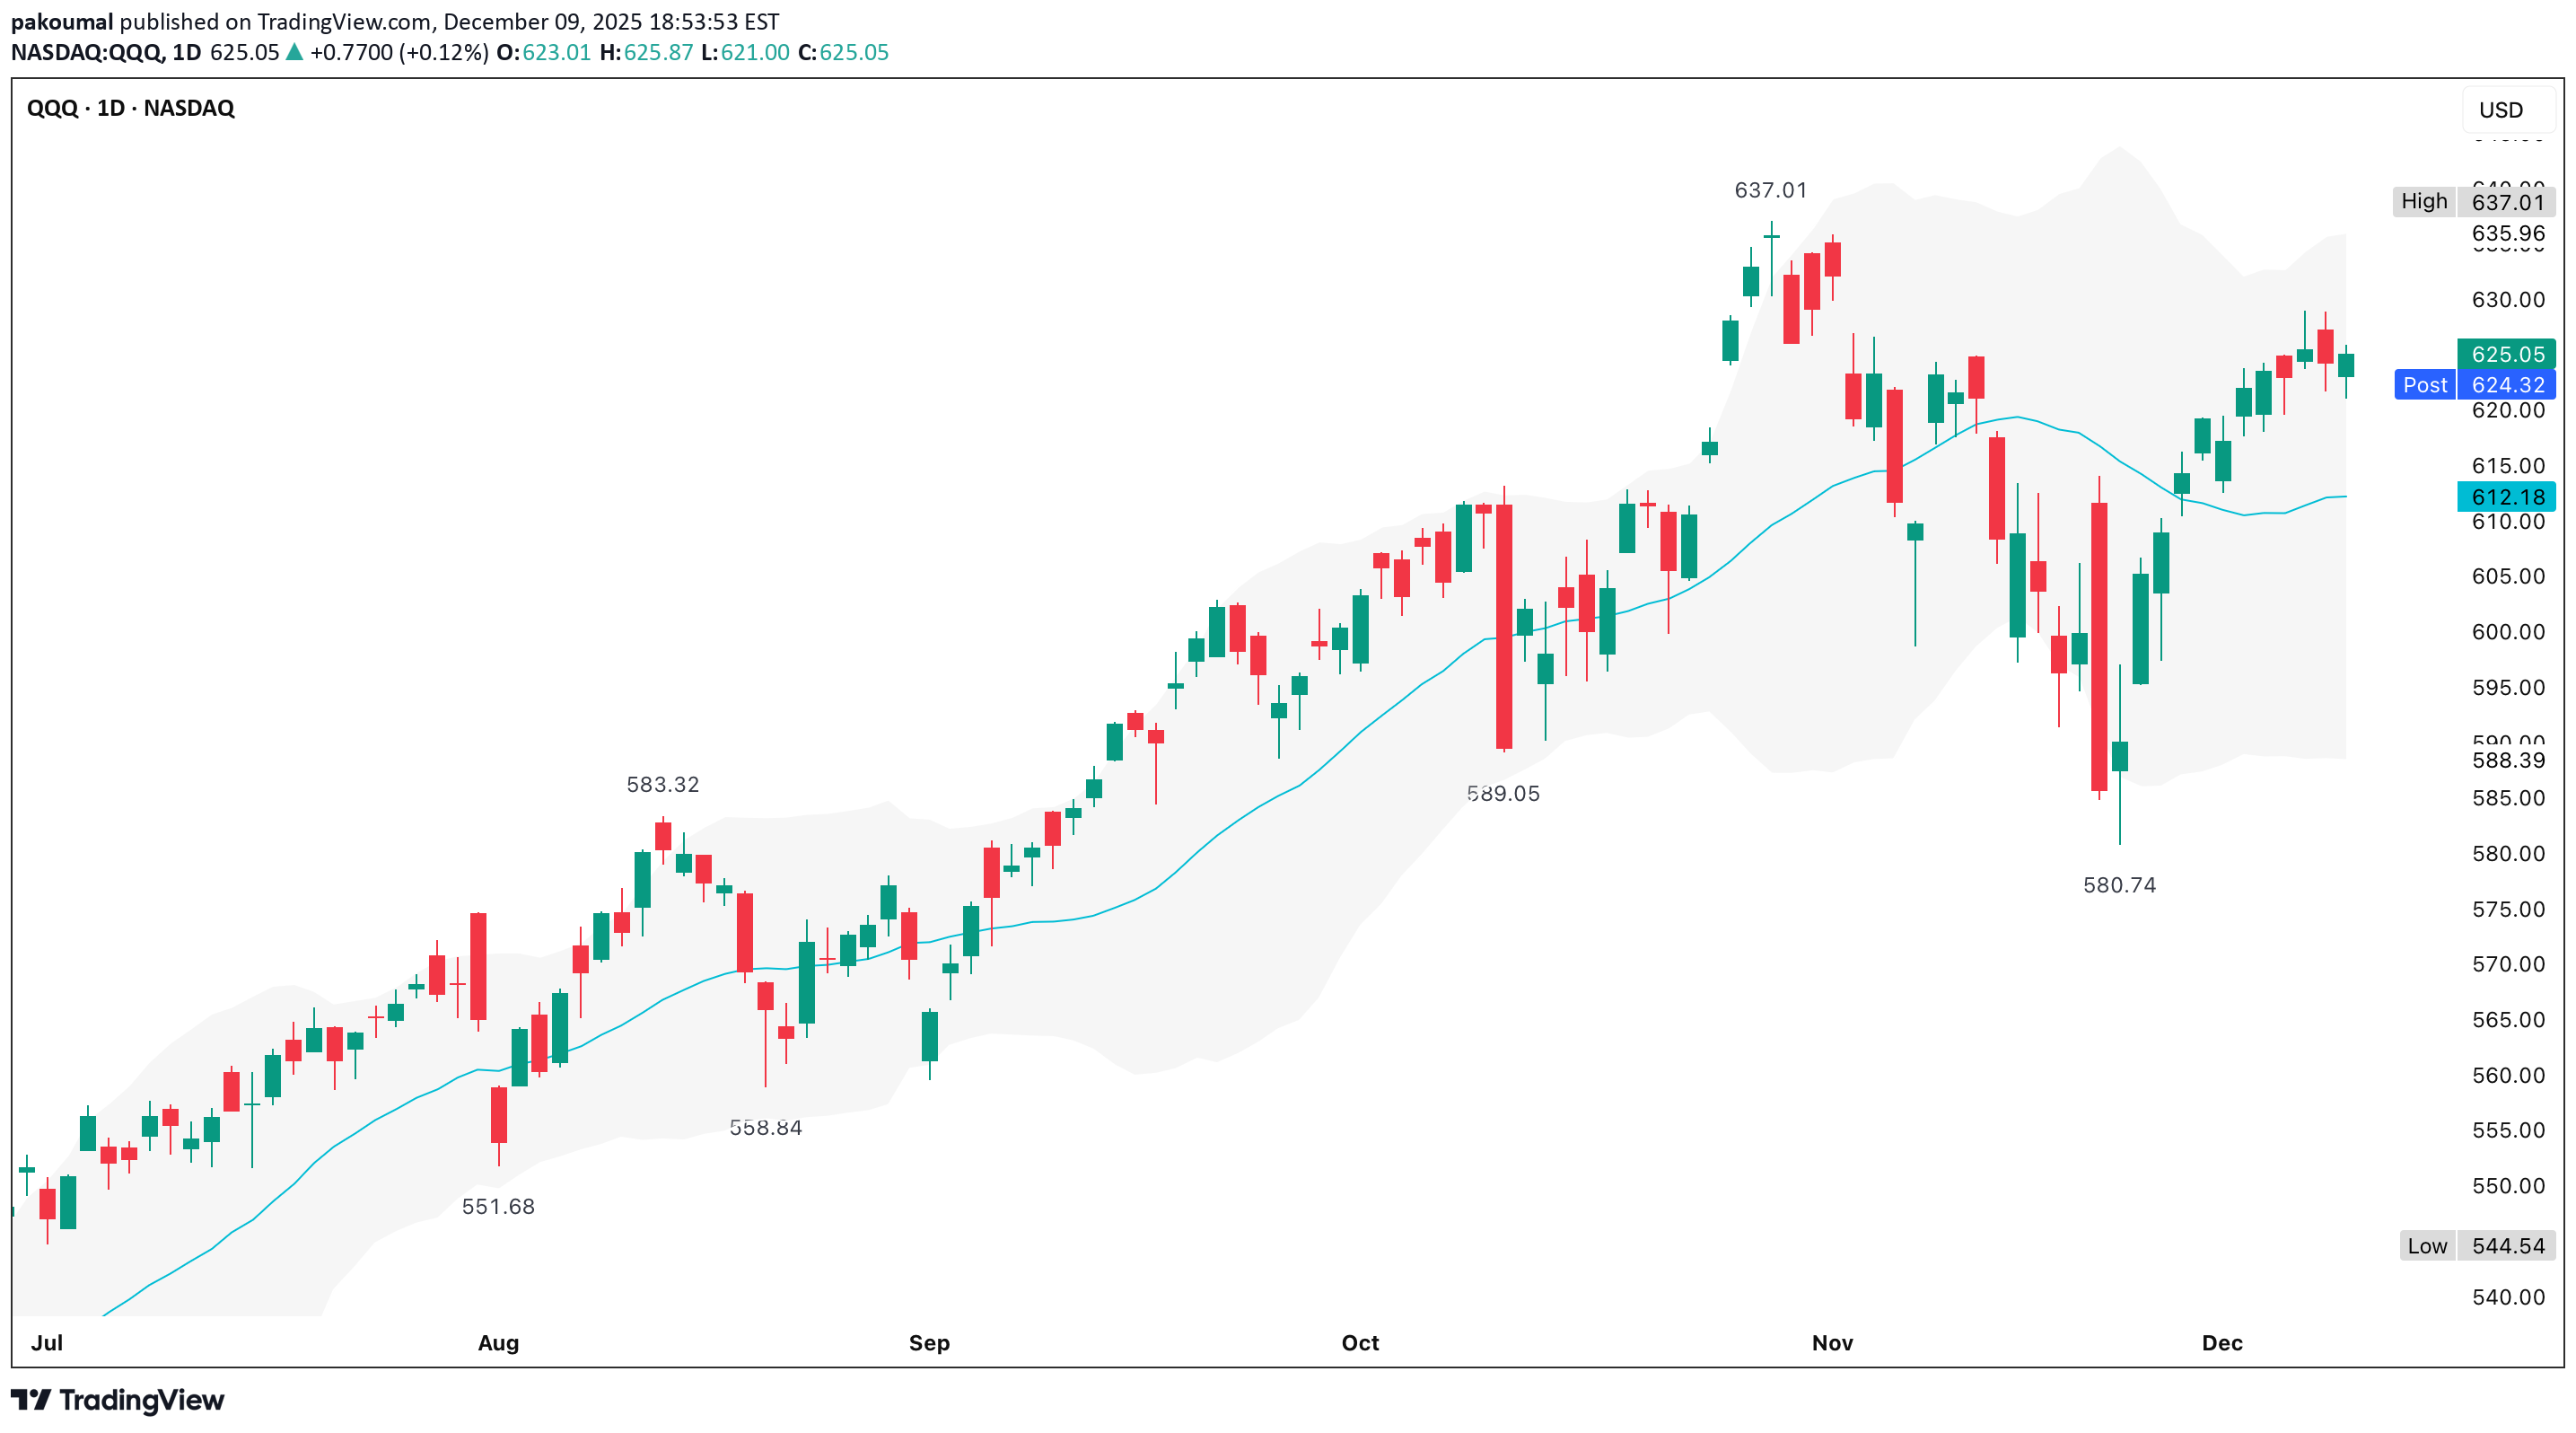
QQQ (5 December)
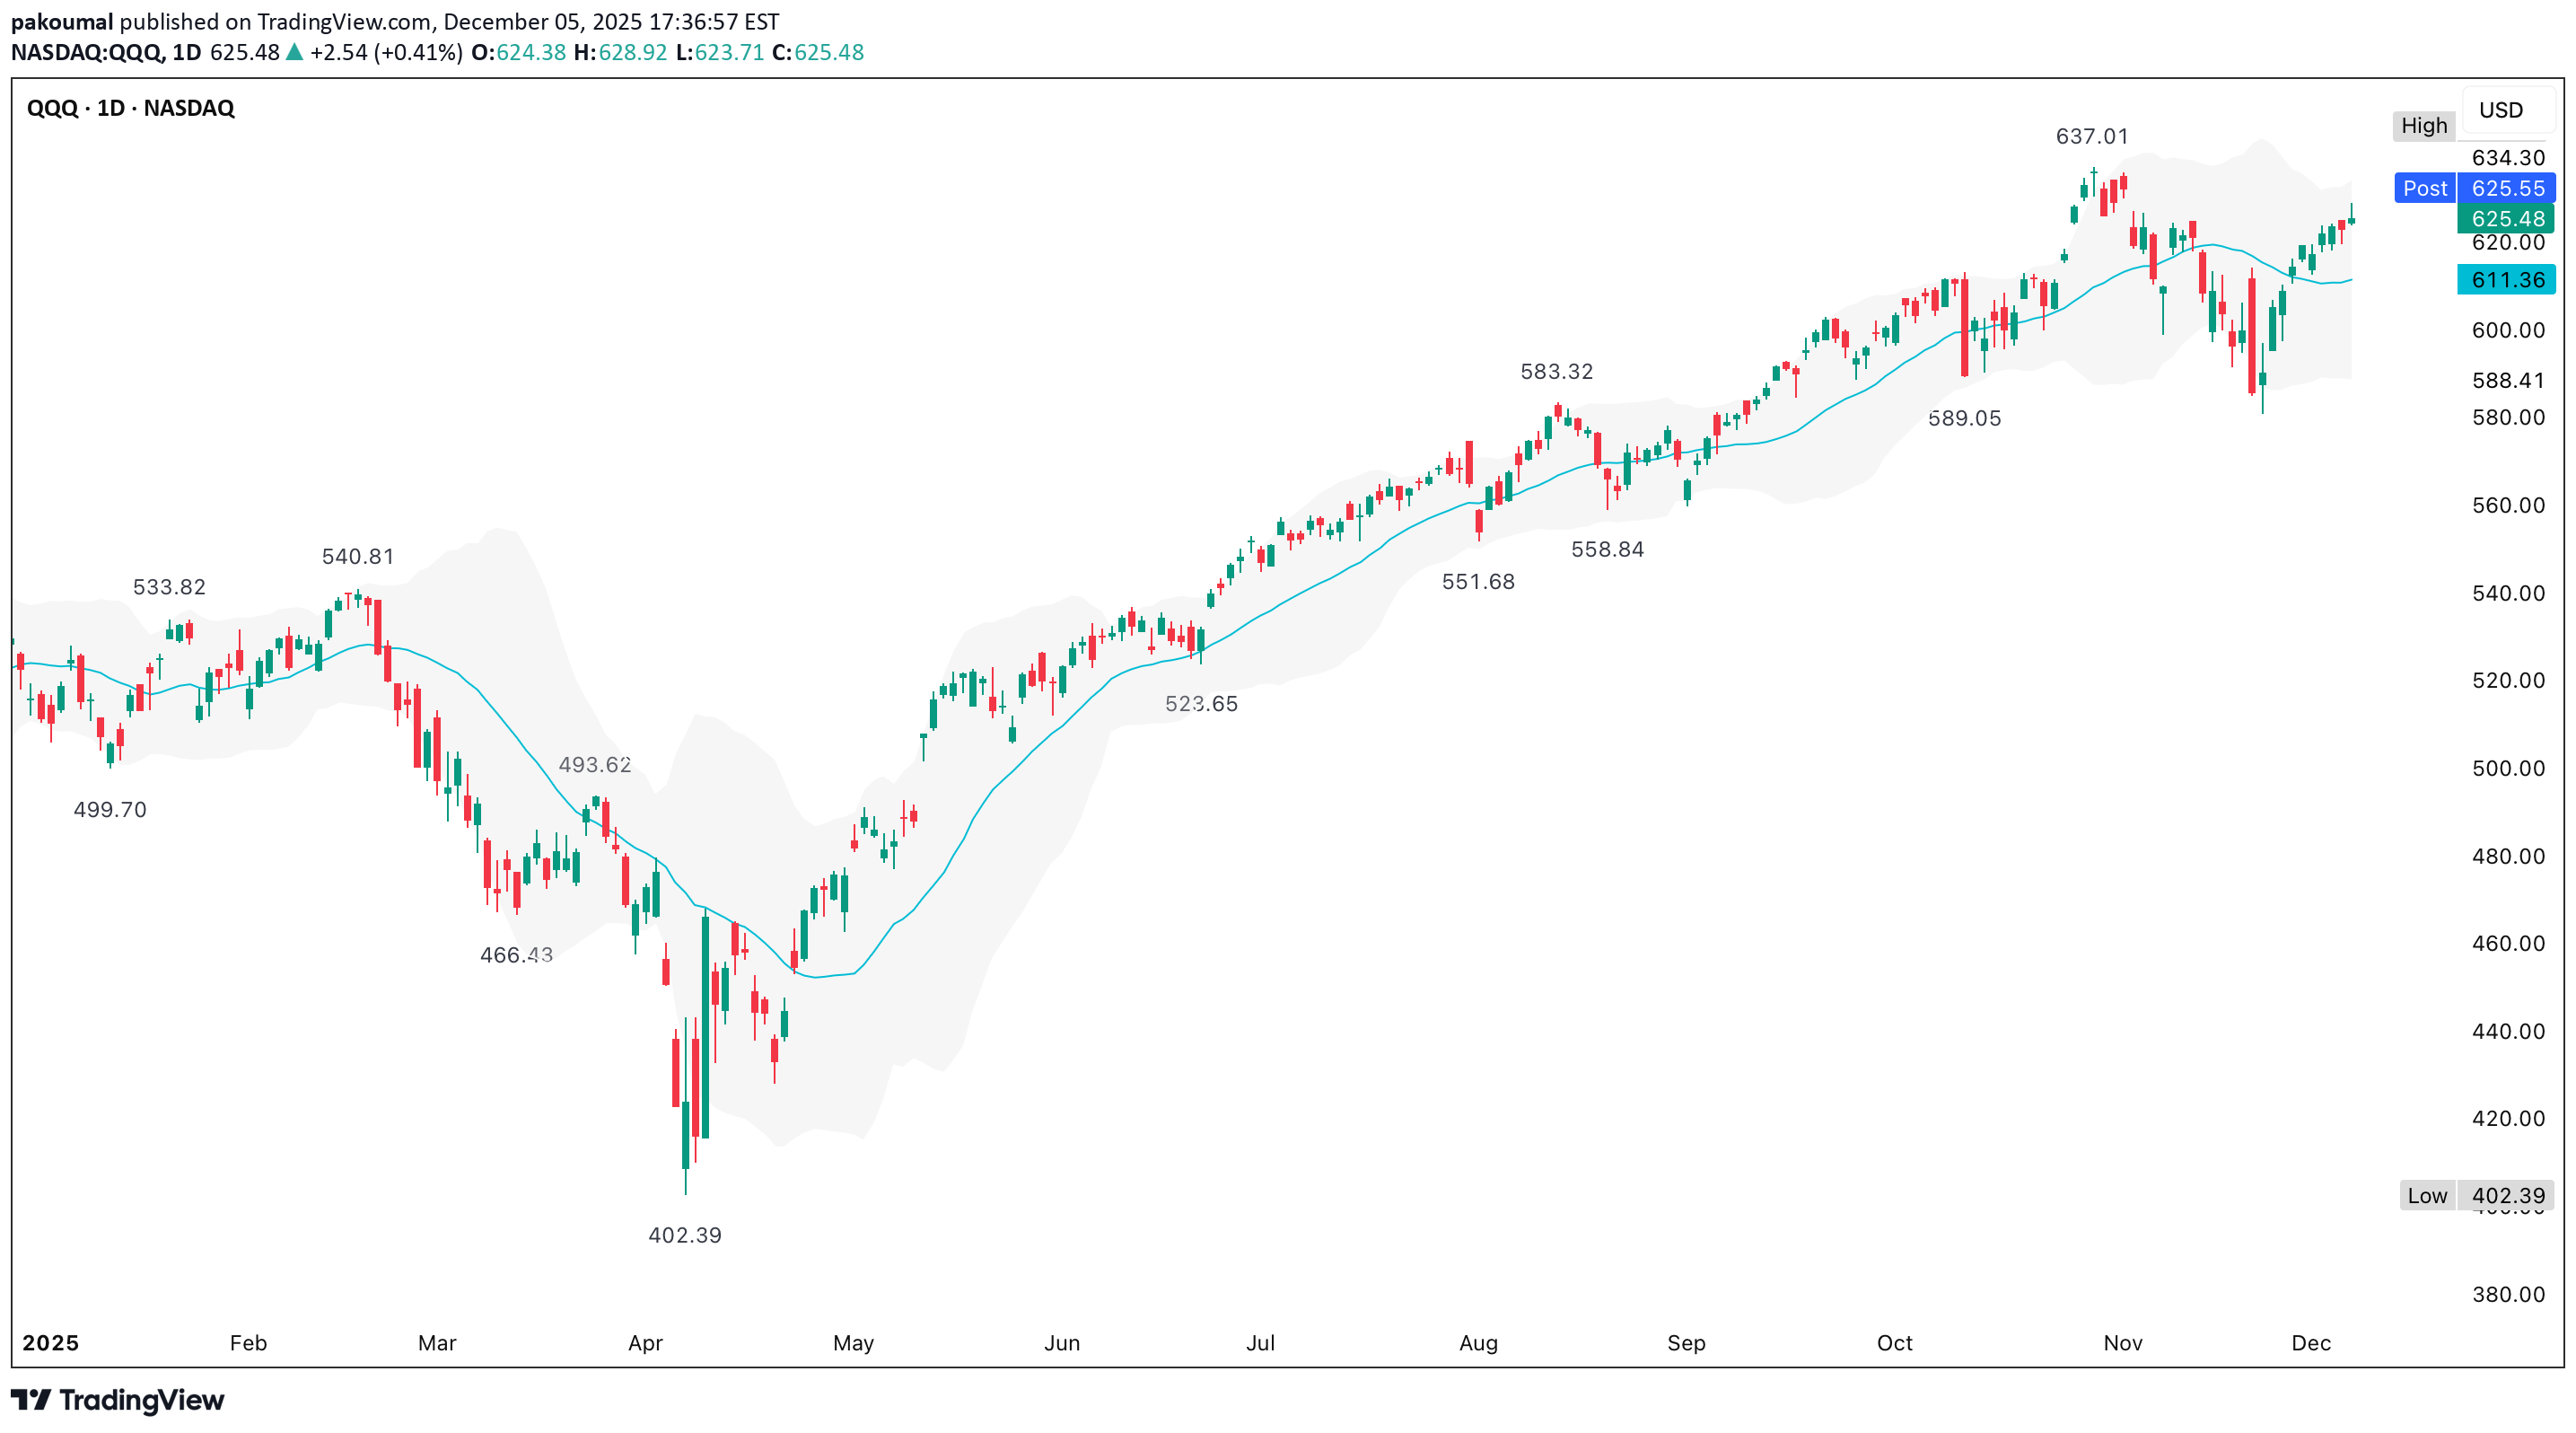
QQQ günlük zaman diliminde zirveye ulaştığında, genellikle üst bantta aşırı genişleme, çoklu ret fitilleri, aşağı yönlü yutan mumlar, net bir düşük yüksek formasyon, EMA dökümü ve daralma momentumu + artan volatilite görürsünüz, ancak grafik bunun tersini gösterir Fiyat orta banttan temiz bir şekilde sıçradı ve Bollinger kanalının üst yarısında ilerliyor Bu devam davranışıdır, tersine çevrilen yapı değil Günlük trend sağlam ve sağlıklı Bollinger ortasının (20 günlük MA) altında kapanış yok Keskin ortalamaya dönüş yok Ekim düşük yapısının ihlali yok 589 dolar civarındaki pivottan bu yana daha yüksek dipler Bu bir yükseliş trendidir ve zirveye çıktığına dair hiçbir teknik kanıt yoktur 637$ ATH QQQ nadiren ilk tekrar testte zirveye ulaşır Ya i) direnç altında güçlenir ve sonra kırılır ya da ii) küçük bir düşüş taklidi yaparak kırılır Mevcut kurulum kontrollü genişleme, trend koşulları, volatilite artışı yok, orta bant desteğine düzgün bağlılık ve bantların içinde daha yüksek yükseklerin oluştuğunu gösteriyor Bu yükselişe işaret Son mum yeşil, sağlam hacimle üst band yakınında kapanıyor ve QQQ 625 doların üzerinde kapandı - geçen haftaya göre daha yüksek bir yüksek, bu da dağıtım değil devam anlamına geliyor 1. 630-635 Dolara doğru kırılma girişimi %60 band'deki trend + pozisyon yükselişi destekliyor 2. Yükselmeden önce 620-615 dolara geri çekilme %30 Orta bant yapısının standart yeniden testi 3. Deep 580$'a doğru geri dönüş %10 Tepesi deseni yok; makro şok gerektirir
Sorumluluk Reddi
Sahmeto'nun web sitesinde ve resmi iletişim kanallarında yer alan herhangi bir içerik ve materyal, kişisel görüşlerin ve analizlerin bir derlemesidir ve bağlayıcı değildir. Borsa ve kripto para piyasasına alım, satım, giriş veya çıkış için herhangi bir tavsiye oluşturmazlar. Ayrıca, web sitesinde ve kanallarda yer alan tüm haberler ve analizler, yalnızca resmi ve gayri resmi yerli ve yabancı kaynaklardan yeniden yayınlanan bilgilerdir ve söz konusu içeriğin kullanıcılarının materyallerin orijinalliğini ve doğruluğunu takip etmekten ve sağlamaktan sorumlu olduğu açıktır. Bu nedenle, sorumluluk reddedilirken, sermaye piyasası ve kripto para piyasasındaki herhangi bir karar verme, eylem ve olası kar ve zarar sorumluluğunun yatırımcıya ait olduğu beyan edilir.