09.12.2025 tarihinde sembol QQQX hakkında Teknik pakoumal analizi

QQQ Implied Move Range
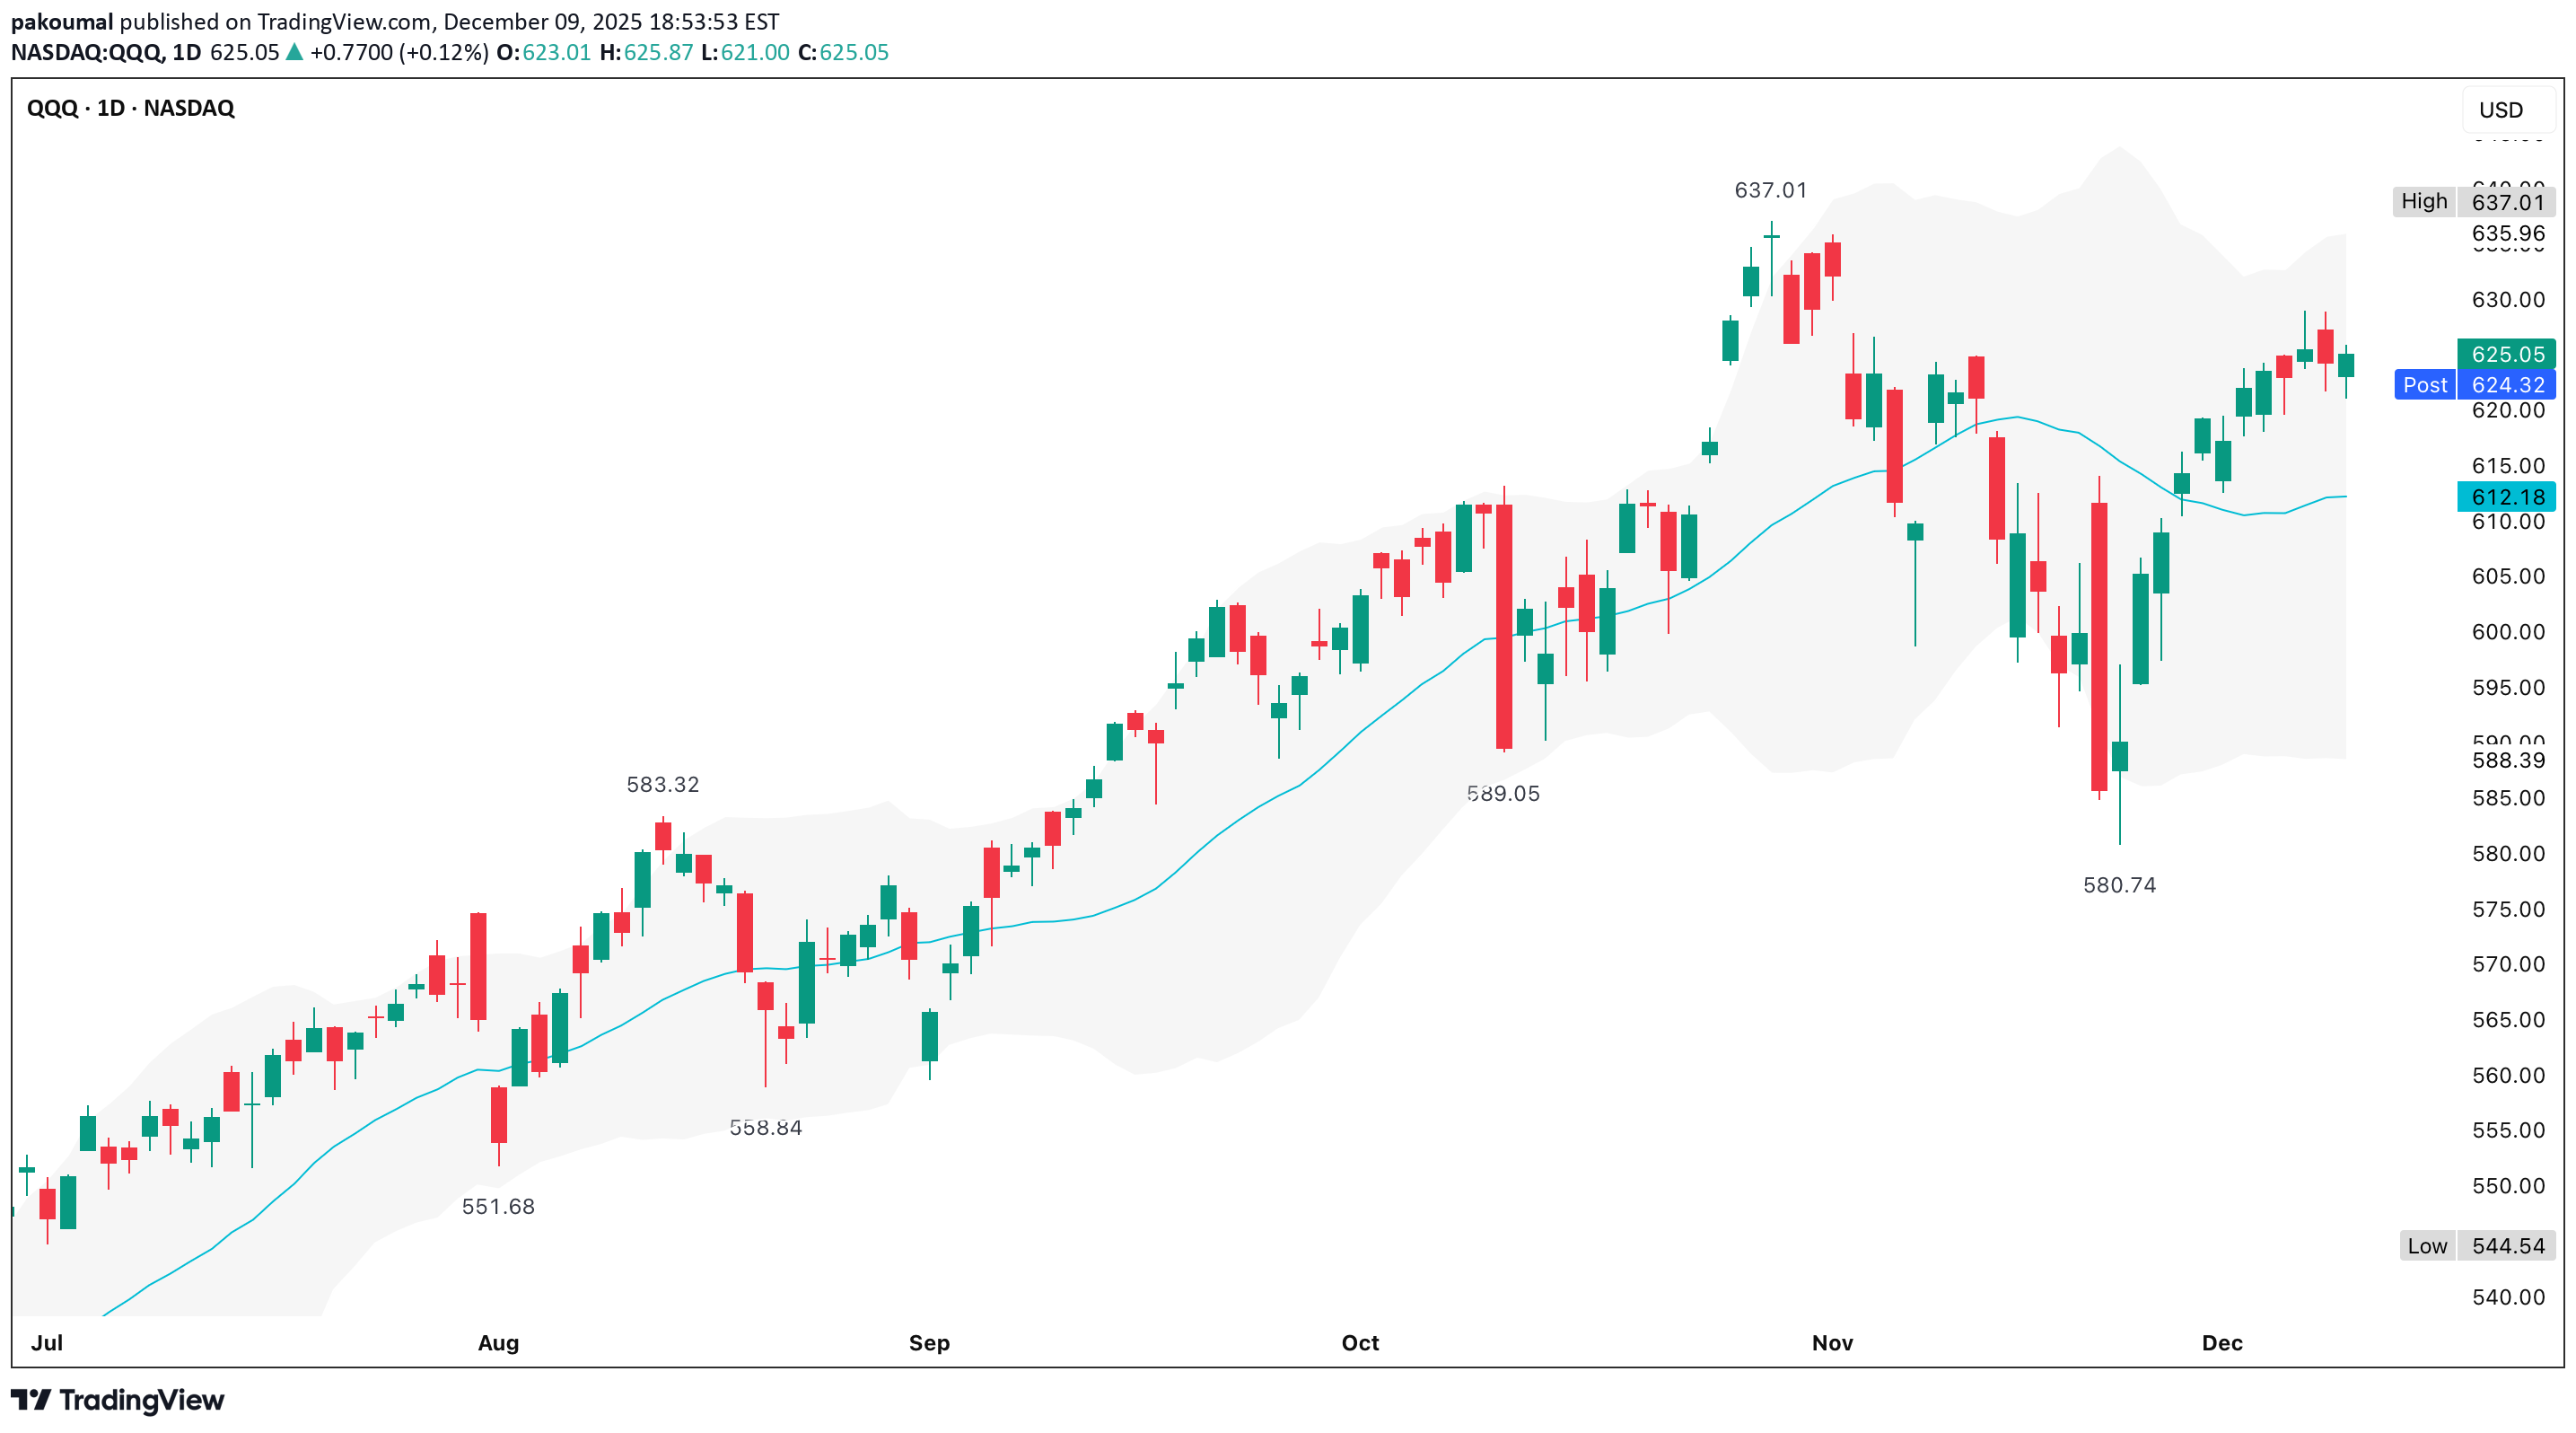
QQQ's implied expected move is calculated using the current option chain to find the ATM straddle (cost of ATM call + ATM put for nearest expiry) Expected Move (≈ 1σ) ≈ $0.85 × (ATM Straddle Premium) The result gives a one-standard-deviation range (≈ 68% probability) for the underlying’s move over the option’s life For a short horizon (“by tomorrow”), pick the front-month (or nearest-term) options that expire soon & use their straddle; alternatively, use annualized implied volatility (IV) converted to daily/weekly via the standard volatility-scaling formula Move = S × IV × SQRTΔ t /365 Where S = underlying price & Δ t = number of days to expiry This yields a symmetric “+/-” band, but it does not forecast direction - only the magnitude (volatility expectation) The front-month or nearest options typically price in a short-term move of roughly +/-1% to +/-1.5% around the current price, ~$625, which suggests a likely trading range for tomorrow of roughly $618 to $634 (-1% to +1.5%) The implied move is derived from option-markets’ aggregated expectations - it doesn’t tell you direction Actual price can & often does, break outside the straddle-implied band; especially, if there's a surprise (Fed tone, macro data, headlines) The implied move reflects volatility pricing If implied volatility collapses (after the event), realized moves may be smaller If IV remains elevated or rises, moves may exceed the band The “+/-1%-1.5%” range is a typical result for front-month options under normal volatility In a “event week” (like FOMC), implied volatility can be distorted, meaning the real move could be larger, or the band may understate risk Use the $618-$634 band as a “probability envelope” Markets seem to expect QQQ to stay somewhere in that range under “normal” conditions If you expect a dovish surprise - the upper half (near $629-$634) is reasonable If you expect a hawkish or cautious tone - then the lower half (near $620–$618) is better If you expect a major surprise or risk-off - plan for possible breakouts beyond that band (to either side) 1. FOMC 27 July 2022 QQQ closed @ $306.81 the day before FOMC 1 day close was $309.81 3 day close was $315.27 Actual 1 day move was +0.98% Actual 3 day move was +2.76% The 1 day move stayed within the typical implied move (~+/-1-1.5%) The 3 day move exceeded the common expected-move envelope (~+/-2-3%), driven by a surprise dovish tone 2. FOMC 14 December 2022 QQQ closed @ $297.50 the day before FOMC day close was $285.94 3 day close was $268.60 Actual 1 day move was -3.9% Actual 3 day move was -9.7% This massively exceeded the typical implied move band Implied range around that meeting was ~+/-1.5-2% & the realized move was far greater Powell pushed back on easing conditions 3. FOMC 22 March 2023 QQQ closed @ $305.00 the day before FOMC 1 day close was $309.42 3 day close was $315.57 Actual 1 day move was +1.45% Actual 3 day move was +3.47% The 1 day move landed right inside the expected band The 3 day move pushed to the upper edge or slightly beyond the common ~+/-3% implied envelope A mild dovish shift + banking-crisis risk-off reversal supported tech 1. QQQ usually stays within the implied move on Day 1 Roughly +/-1–1.5% is historically typical Breaks above +/-2% tend to occur only on strong surprises 2. QQQ frequently breaks the implied move by Day 3-5 The 3-5 day window often includes volatility expansion, trend continuation if the Fed surprises & mean-reversion if the first move was emotional 3. Surprises create the largest deviations Hawkish surprises are the biggest downside breaches (December 2022) Dovish surprises are sizable upside breaches (July 2022) 4. Base-case FOMC outcomes generally stay within the implied band Typical outcomes settle into the +/-1-1.5% Day 1 move, but still tend to fade over 3-5 days Around 70-80% of the time, QQQ stays within a “1σ” band after FOMC 20-30% of the time, it breaks out with a big move (usually driven by a surprise) The 3 day window is actually slightly more prone to exceed the band than 1 day or 5 day This suggests that 3-5 sessions after FOMC is where the real repricing happens 🕊️ Dovish Day 1 +0.5% to +1.5% Day 3 +1% to +3% if the narrative sticks Day 5 some giveback is common = net +0.5% to +2% 🧸 Base Case (“hawkish cut”/cautious) Day 1 –0.5% to +0.5% (within 1σ band) Day 3 drift –0.5% to –1.5% Day 5 further mild weakness = total -1% to -2.5% 🦅 Hawkish Day 1 -1% to -2.5% (near or beyond 1σ band) Day 3 -2% to -4% total Day 5 is either stabilization or a small overshoot lower = –3% to –5% total in a stronger shock Something like the base-case band happens ~70-80% of the time A true “shock” move (outside band, +/-3–5%) occurs roughly 1 in 4 to 1 in 5 meetings Directionally, given current positioning yield re-steepening + QQQ’s extension, I’d assign higher odds of a base or mildly hawkish outcome, so statistically, the 3-5 day fade is still my default The 3-5 session window is where the bigger, more directional, macro-driven moves happen In the current macro setup, the bias is toward the base/mildly hawkish path, which historically lines up with a contained Day 1 move, then a drift lower over the following 3-5 sessions +/-1.5% (1 day) Upside $625 × 1.015 ≈ $634 Downside $625 × 0.985 ≈ $616 +/-3% (bigger, 3-5 day) Upside $625 × 1.03 ≈ $644 Downside $625 × 0.97 ≈ $606 +/-5% (shock/tail scenario) Upside $625 × 1.05 ≈ $656 Downside $625 × 0.95 ≈ $594 1. If we close >$634, it nudges into “strong dovish” territory & day 3-5, holding above $625-$630 keeps the “wave 5 extension” idea alive; even then, a later retest of $620-$625 is typical behavior 2. A drift toward $608-$615 lines up with historical negative median returns & if QQQ breaks below ~$615 & closes there on Day 3-5, odds increase that we’re in bigger corrective territory, not just a quick shakeout