
iCantw84it
@t_iCantw84it

Ne tavsiye etmek istersiniz?
önceki makale
پیام های تریدر
filtre
iCantw84it
XAUUSD Quick fast short to bottom if you need to make some back

Kayıp kar elde etmek için burada hızlı küçük bir düşüş. Icantw84iti tarafından neden tüm grafikleri uzun süre kullandıklarını bilmiyorum çünkü bundan çok sonra gidiyorum. Bunun için görüntünün 4 grafik olduğundan nefret ediyorum. Ya da bunu sonsuza dek durdurabilirler, o zaman aniden hepsini tek bir mumla yapabilirler.Bu 19 mum gibi olabilirdi, çabucak dediğimi biliyorum. LOL bir ticarette bulunduğumda ve bunun olduğunu fark ettim, sadece bekleyeceğim diyebilirim. aptal fikir. Ve ne zaman bu gerçekleşirse aslında üzerimde bir mumda düşüyor. Şimdi paylaşmaya çalıştığıma göre, hareketinin tamamını alacak. Lollol nasıl bu kadar yavaşça inç olduklarına bak ve sonra oh hayır gibi geri çekiliyor. Gerçekten o ish satmaya çalışıyorlar. Mumları izleyin Son dakikadan önce yaptığı her şeyi izleyin, korktuğunuz veya en çok olmasını istediğiniz fikrine satıyor. Beni kontrol ettiğin için teşekkürler. Bu mum hakkında endişelenmiyorum, en yüksek izle ... Eğer bir önceki 5 mum altında 15 bir 15 üzerinde kalırsa hala hareket halinde olmalıyız ... her şey olabilir. Ama bence bunu mümkün olduğunca sürükliyorlar. Grafiğe tekrar baktığımda, TA hattımı damla için yerleştirdiğim yere göre ayarladım, sonra sahip olduğumuza baktım ve hala haklıyım .. bizde bulunmadık. Daha derine inmeli. Ve onlar bizimle lanet. Sıkı asmak, hafta boyunca son günümün sonunda büyük bir L almak istemiyorum, bu yüzden win olacak. Ayrıca, bir sonraki 5-10 mum üzerinde biraz daha az hacim olması gerektiğini de kontrol edin. Tabii ki bu mumu tam direkle bitiriyorlar. Bir sonraki düşmeli ama cehennem şimdiye kadar olması gerektiği gibi gitmiyor. Yalan yalan söylemiyor, şimdi biraz korkutucu değil LOL LOL sanırım sadece yapının düşük ucunu test ediyoruz ve sadece yapıdan çıkmaya başlıyoruz? Bir tane daha zamanını kontrol edeyim. Sanırım ne yaptıklarını görüyorum, çok ileriye gitmek yerine hareketi uzatıyorlar, aslında bu hareketin en yüksek zirvesi olmaya geri dönüyoruz, bu yüzden lansman için sizi negatif yapmanızı sağlayabilir!
iCantw84it
XAUUSD who's ready for another trade?
If you were trading with me yesterday I took you down a 6 hour tour of what XAUUSD was doing every move it made and every move I made. I am starting my prop trading test today. And yesterday was my preliminary test to see if I had my rule set down pat. Also, to see if I can guide others through it step by step. How many mistakes would I make? Were they Huge or small? Was I profitable or not? Did I obey by the rules or not? Could I make someone else money? Yesterday I made 16 Trades 3 losses so around 80% Trading the last trade was really just to see if I needed to continue or not and I shouldn't have made it. Only a $50 loss across each loss. Avg Trade was $200. Max open lots was 8 singles at one given moment and over half were around $300. My only regret was that I didn't catch the 90% pull back before it was too late. Need to come up with a better way for this, Which I believe I have with my new indicator that shows price under the lines. When it rotates to above it is very bullish in that moment even if all my other signals are saying its not going to turn completly or reverse me out of my trade. Had I caught it in time , I could have made profit rode it up and then back down. Which I had the trade channels set to do that if I wanted. So potentially somewhere around 3x profits or more realistically 2.25-2.5 profits because of slippage. I ended up with $2882 using singles on one move over 6 hours. Yes, I know I could have made a lot more. Another trader made 24k on the same move yesterday. However, this is new and I am trying to stay in my lane. lol Todays Trade.... Not sure up or down yet. Im coding a indicator right now for this using chatgpt trying not to waste my day too . but its consolidating so we should be good. im late getting in I will start this now. when the market closes I will close as well but when its back up at 6pm est I will start it back up.here is the inidicator i just created. for price projection based on other factors that influence it and supply and demand1901.41 is being pegged on a 4hr analysis of this stock and its contributors...Daily it says 1906.50 lolthree price targets 15 min 1900, 4hour 1902.19 Daily 1906.69Thanks you all know me well.... love the boost and we havent even cracked this open yet LETS GO!I'm not sure what I love more, finding a new way to create an indicator to solve a issue I want to see fixed.... or being right! lol I have the biggest grin on my face. Love making new things. This one is specifically tuned to GOLD. I love how hyper focused it is..Channel behavior goes something like this: 1. Drop in or pop up into new trading range. 2. Identify top and bottom of channel. 3. oscilate top to bottom. 4. when buyers or sellers over power one side you will manipulation to one side or the other. 5. The reaction will be a test to the opposite side and manipulation there as well. 6. test is over when price has either successfully made out of the othersides extremity to the channel. 7. if price fails to get back in channel it finds support or resistance depending on side and makes a move to continue in that direction. 8. if it makes it back in it follows these rules: a. if high drop low. if low go high. b. if up it drops to bottom of channel. to test downside c. back to mid of channel to test the upside. d. then back to bottom to manipulate bottom e. once outside of channel it either consolidates and is shaking out weak hands and absorbing shares . or drives down deeper to shake out weak hands again. f. then moves back to mid g. back to bottom of channel h. runs to top of channel i. if doesnt break through it runs back down to mid j. retest high k. drops back down to bottom of channel. l. if manipulated bottom it most likely will do this again. m. after succesfully breaking through to the bottom and manipulating it again.. it moves back to mid (this is called the spring in wyckoff) n. then bottom again to retest one last time. o. then launches to break through top of channel p. once its through it tries to find support on the top of the channel q. then trys to make a new high r. then finds support on top of the last high. s. trys to make a new high again t. then comes all the way back down to the top of the channel (called last point of supply) Phase C u. then makes it move to break away from the trading range. this is called phase Di could have the phases slightly off but the movements are solidWeakness fall out of channelprobably taking my $150 here as market will close soon. Ill set up to get in again as soon as it opens or at least stalk it until it gives me the oppurtunity3o min is actually moving up away from price.. going to hang tight to see what happensemotional push down out of channel?Nailed it !1st trade on my prop trading test. $116 Should of taken the $150.00 lol oh well curiosity killed the cat I am going to chill till market opens at 6pm unless you all have questions or want me to check something out for you?Going to open a video of my chart live streamLooking fo signs of life Lets see what we findadded another positionadded anotherabsorption hit again1903 price target on 15 minThank you everyone for the early boost it makes me feel bad to ask but i mean I called a no vol move to the upside and if you have been adding you should have around $150 thats worth a boost or two.. ;: )supportYea i knew i should of closed it out this move should have another urn up but it might be cooked.Slowly crawling back up if you look at the orange path i drew it should be about rightthanks again for all the boosts if you are half crazy and partially psychotic about being right you held here like an idiot... but clearly stop loss hunting manipulation its disgustingChannel rules for the win.... if it fails to break out here it will dumphere is a the same move i just moved the dots over sidewayswe break out of this im addingWe arent in the clear yet its gooing to look ugly herebasically the consolidation we just saw was the teal move... glad i could post it before it happened all the way lol if it dumps back in to the channel and heads to bottom I would consider taking the L just be careful if they cant find shares to break free it will drop down to shake out some.dont et too excited but if you need a small win...lord I do.... here is one... look who made it on top of the linesseriously you can fart and knock this guy off the lines lolAdded here...l might be a pull back to top of channel here so be carefulwhoa! that was painful. Outside of that, everyone you all are great we just passed yesterdays views by 150! Lets go! Thank you for all the boosts! Maybe one more for walking us through that trip through Skid row.....sketchy!Where them 50 rounds? So did you guys know I have my chart live streaming? click here tradingview.com/streams/L2QTFcMQYb/Whoa that changed up real quick.... i guess we can say this wants to move up with certainty now... look at the candlesjust lkilled 60% of my trades holding 2Lets get some BOOST people Lol WTF! what a great pay off387 Points Whoa!vol offset bullishDrop down to 1 when it broke the chanel it was making. lets see where it goesSorry talking to a friend i havent talked to in a hot min. going to add one if this breaks for a new high but it looks like its trying to down step. so i might close my last one here... soon and wait for another signal.. pls ask any questions if you have any if you havent... Hit me with another boostbe careful here it looks like pahse d where it jumps off a cliff. if it gets a lot of vol and moves back over that line I will addwaiting for the pull baack and then im adding oneif it dumps im out lolContracting and expanding . making nodes... interacting with the nodes and eventually making its way outadded to position again here most likely jumped the gun we will see avg vol is low like 39 push then pop might happen real quick to shake out shares and use that to launchthe new indicators lines are alive you can see them latch on to candles from under neath and fuel the move up.bullishlets get some more boost going pls... another move up for profitSpoke to soon looks like the opposite move double top failed to make the smae high could dump here take profits if you got it if you see it move downlook at the vol candles diminishing.. no interest in going down. I am looking an emotional push down and then a pop to the upside.it keeps stopping short it might dump and its acting like it wants to go to draw us in....we are going to move up and out of this box!
iCantw84it
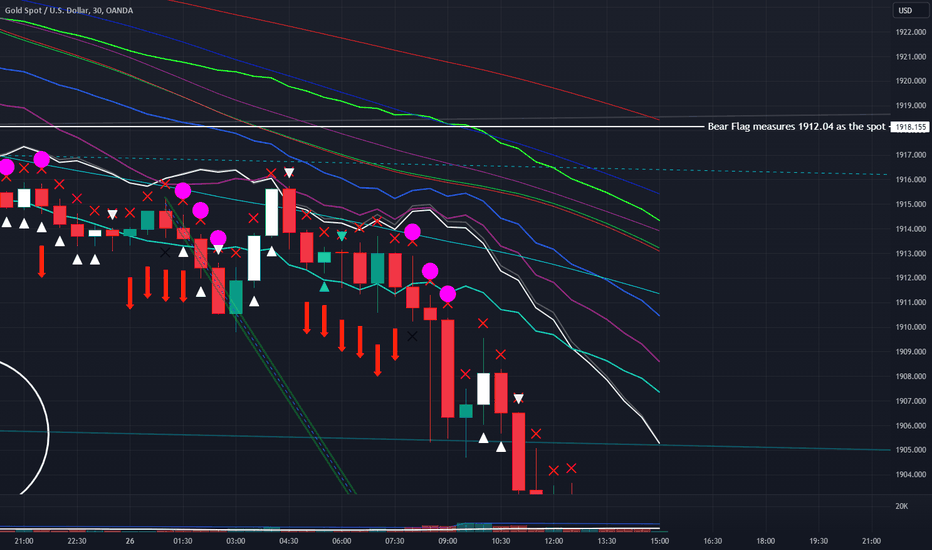
XUAUSD Next Stop 1905-1900 pls put trays in the upright position

Yes these lines might cause you seizures do not look at them if you have or a family member has experienced or has a history of having them. I am going to post two charts one is something I just made. so simple. and another is my indicator. both say market wants to dump to 1900ish-1905. this chart a signal when the market basically burps or farts....lol sorry but you aren't suppose to see it. I see it because I made my indicator with my own formulas. I use that symbol's candle that it is referencing and I can draw channels leading from it above and below price action using other price action. This shows me where price will go if it breaks out one way or the other. The other chart is an instant direction indicator which right now on a 15 min chart is showing both lines pointing down. the stronger the trend the straighter the lines and the closer together they are. you can switch down to a 1 min and see what the instant is.... if the red line is on top while moving up its a weak move... probably ignore that move. When green is on top its got alot more momentum to it. I normally add to my position when the red is on top and moving up. When it switches I start closing positions. Right now the market isnt running full steam but when it is there chart I am using is set to move against gold when the market is running up or down. depending on different metrics. Its kind of smart. Once I get it dialed in It should tell me where gold will be headed to. There is a .30 cent difference in price between the two with the market closed. I can imagine on really huge volume days this can have a massive divergence and push this. Thanks for taking the time to read. I love messing around with new things and this was fun. Please Like, follow and of course boost...as its free. And it shows me that you appreciate or want to see more of this. by iCantw84it 09.25.23actually 1912.34 would be a viable stopping point if you see a strong reverse here this would be solid.. ill post if I see soemthing first.1912.12 is where two paths crossAdded another positionpotential profits are: $110 $91 $50 $10 $-9Target potential: 177 ptsthats $885 from here if it can maintain this move downIf you jumped in when I posted this you would be $100 on 1 contract to the good. Thats worth a boost dont you think? o.0not counting the emotional candle just nowthis move is strong look how the red is on touching the other linemaybe over if this closes on or over this....hang tightstill cliff hanging like sylvester stallonstill hanging I have a im stupid i should have closed this 1 line ago line.. but watch hang onWhat can i Say I'm a dual pistoleer!You guys are stingy with the boosts! what would you like me to do? I already called the move, stopped the close to the move up.... back to profits on the move down. and did it with dictating every part of the move in annotations. Would it help If I said I was cooking and dancing at the same time?I get it you closed your position didnt you? I feel you I wouldnt want to tip a wizard for shooting lightning out of his fingers into the air and striking down a flying dragon. o.0Increased buying int his area.Thank you whom ever Boosted you are a true boss!Because they boosted check this out. with the Volumetheres more if you keep boosting I will keep digging deeperWhoa you guys are hungry don't worry I have big spoons lets get into this. here is some more on the vol and distance.and another close preventedCheck this out... I was wondering why it stopped short and found thisFeel free to ask my questions about this stock or anything I am doing aThank you for all the boost I will pick some things to talk about but if you boost pls ask me anythingease of movement ? new higher lows but no higher highs? yetExplaining the lines and the symbols above priceWhen White is above Price action it causes pressure to push down. When it touches price it causes pressure to push down. If it comes up from the bottom and crosses price action to go above. I call that the Death Cross. Price Dumps!Death Cross Started this move downMore vol comparisonsIf you will look at the two candles you can see that they didn't break the high of the one candle. BearishAdded oneWatch out this thing might sling shot hereChannel the indicator and watch for over bought or sold conditions on the flyBreaks out over if it hasnt found support it will most likely dump to find support and if it fails it dumps to continue move. If it drops low it will move tot he top of channel and manipulate the high could also be a move to break out. Same with Manipulating the high first. It will dump to manipulate the low or break out of channel and dump to next channelWant this to reverse? Here's how we will know it has. Atleast one Part. there are about 5-10 different ways using this one indicator.More Reverse Signalsdifferent variation of the momentum indicatorfirst version of momentum indicator...At this point we are about 150 pts, although a lot slower to get these last 50 points. That would be another $50 bucks on 1 contract. Now if you have been adding we should be at .....Potential profits from adds: $180 $160 $124 $65 $84 $-20 Its moving lol and yea I got in too late on that big push down. thats $627 from what was $250 on last update to profits. Thats worth a few more Boosts I think lolYou's all are Great Thanks. Someone ask me about something on here. I can keep picking random things?Bullish moves in motion... dont lose profits... watch closeBearish still for me1 Min Bearish flagsLooking more and more like it will make a stand here... this is a 3 min chart. moving toa 5 min nextthis is interesting. Makes me think after these reds there will be more green trying to test upside vol and distance.. or demand and ease of movement. So far half the vol took 5 candles to get half way. not truly easy going up. but Vol is on par.here are some potential ways this move can play out.Another thing to keep in mind is the whole point of moving down is to find buyers that will hold on to shares longer. This whole time the vol has been diminishing. Meaning there are stronger hands holding these shares. Proof: There is less shares to trade each time or time period. Which is why the movement has been so much slower. We are hitting Absorption. Every good ansorption will have whats called a red push or in this case a green push up that will cause people to drop shares and take profit etc. this will flood the float and dilute the value causing price to drop again. unless there is a massive demand spike at this level that starts staking buyers greater than sellers. at that point this will launch. most likely not going to happen until 8am -9am-10am eastern time. All this is the ground work to set up a run . That said. if that is true then this move is to drive this deeper in the dirt and free up shares because its become so slow. its no longer cost efficient to get it to the price we need to get to where the pocket of deep pocket buyers are waiting. My best guess is either 1912 or 1900 which is the whole purpose of this trade. Either I am right or We just missed alot of profits lol15 min time frame has all the lines pointed up but they arent together, nor are they below price action. This isnt ready. This is a 90% move back to the start to shake out shorts and any buyers who want to ride this up and to trap fomo buyers as it goes up. if it was the real deal... it would be moving a lot faster. if you notice all the candles are really small. only the last 3 candles are of size. thats fomo but fomo with this draw down and if it was absorbed with Demand Spiking it would be really large candlescommitted to the upside candles for referenceadded to my position also showing what happens once it breaks the channel.Something to watch out for... this could have issues breaking the middle of the channel if that happens and it makes a move back to the top... two things can happen. 1. it will attempt to break and succeed if it does it needs to find support. 2.it fails and falls under the mid and test the bottom or more than likely drops below channel where it will attempt the same test as the high. if it fails it will continue to my price target.Going to add another if it clears the low of these two candlesFlags re-emerging on the 5 min timeframeAdd position update will most likely take profit on 1 or 2 once we clear the bottom of this move again. and then when we clear the bottom of the previous move.*** Future self*** When speed drops to .011 on the 5 min for any given length of time like over 30 mins to an hour..... Look at taking profits and potentially riding this up or just taking profits on most of my positions so I can reload and double my profitBearishwe are close.... I think this deserves another Boost... lolIf I am right 2:30 is the close to one of the europe Markets or somewhere over there past it.. lol so we should see some activity here coming inI would get in close here.. its so close it can turneither we are moving under these lines again or we are about to launchCome on wheres the boosts don't make me start making anaolgies about wizards and dragons again.... $909 at this point.. could have doubled that but its ok... this was a learning experience for everyone including me. thanks for joining me. I appreciate the follows and likes and boosts!Thanks Zak you are true boss! just for that the price is going to drop more for you. lolAt this point I am looking for an emotional candle that desimates everything else on screen or atleast over the last 17 to 31 candles. This will be the sellers climax and this i will be the Change of character that sets up the reverse or continuation of this move.Sorry slow on getting to this because its so LONG the post. lol Less vol on last red compared to the two greenLadies and Gentlemen with this we Cracked into 1912's Still doubt we are going to at least 1912.04 ish....??? Fomo will kick in if it keeps dropping which means free ride down here we goNope not enough$ 1500 right here nope $1600 nope there it is emotional drop fomo $17501.1k vol this is the candle we are at 1911.95 took $300 off table $1500 left might take another soonBy the way We made it to 1912 now is this the end of this move or are we going to 1900 like I first said? Vote in chat pls.More Boost pls lol I think I earned it. $2k move here if you have been with me from the start,,, could have been $4k if I got out and rode it down again.Flags!Back under the lines going to be hell getting back over.... At least I hope lolSee most people get excited about the cash....no not me.... I love it dont get me wrong.... whats better than the cash? Being Right! lol it can be a curse and it can be a blessing. I have been working on being ok with being wrong. and that has helped my trading a lot. Thanks again to everyone whos been with me this whole time. I think this trade is just starting. Im back to $1700. might take one
iCantw84it
XAUUSD 3rd trade today headed to 1923.50

Xauusd Piyasa düşerken bunu işlemeye gittim. Göstergemle inanılmaz bir şekilde tahmin edilebilir. Kanalların nereden kaynaklandığı ve talep tükendiğinde bayraklar için çapa noktalarım var. Geri çekme için tedarik hatları. ve bir tersine dönüştüğü için hareketler için yerleşik olan hız inidcators. Hedef 1924.50 Olmalıdır Günün Üçüncü Ticareti Her bir hedef 1-2 gün önce çizildi. Pls beğen ve bedava güçlendirin. ICANTW84IT09.22.2315 dk tarafından Masanın% 25 indirimini almaya yönelik işlem planı hakkında daha fazla ayrıntı için daha fazla ayrıntı için ... Bu çizgide tutulmazsa ... 1925 civarında bir yerde, bu konsolidasyonun bitmesini beklerseniz, bu konsolidasyonun sona ermesi beklenirse ... karınızı en yüksek veya en düşük seviyeye girmediğinizden önce, en yüksek veya en düşük seviyeye çıkmadığınızı göreceksiniz. Bu konsolidasyonun çevresinde bir kutu olduğunu hayal edersiniz, sonra üstte takıldığını görebilirsiniz, sonra altına düşer, düşük vuruşları ortaya manipüle eder, daha sonra tekrar ortaya geri dönmeli ve daha sonra altına geri dönmeli ve daha sonra bir sürü aktivite altına geri dönmeli ve kutunun üstüne yakındır. Eod'a kadar patlamak ve durdurmak üzere bir noktaya gelin ve daha sonra fiyat eylemini durdurma kayıplarınıza hit manipüle edin ve tekrar ticaret yapmaya başladığınızda bu kadar olumsuz olursunuz. Lol, önümüzdeki 30 dakika içinde aşağı hareket etmezse muhtemelen karımı biraz burada alacağım. 1000 $ 'lık bir Hasta Alın Gohereis nasıl çaldı ... Hedefime hit düşme şansı var ama bu noktada ticaretinizi açık bırakıp hesabınızı maksimuma çıkarmak veya durdurma kaybınızı gezmek için 100-200 PTS'yi taşımayı umdukları gün. Buna değmez. 200-300 civarında 5 tek işlem kapattı 500'e ulaşmayı umuyordu, ancak zamanım tükendi. Takip Boost gibi tekrar sun veya Pazartesi günü yapalım.
iCantw84it
Watch this move....ANKR Crypto on new cycle indicator
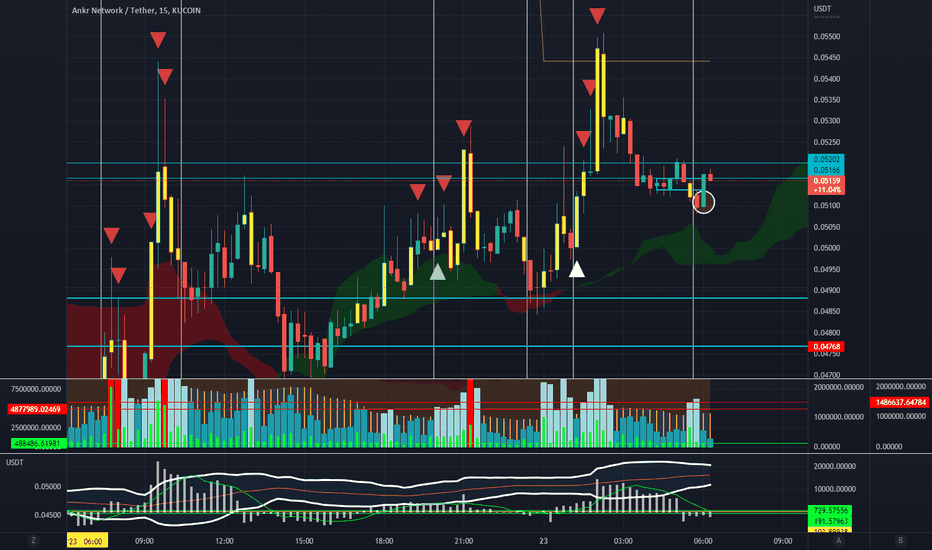
Yeni göstergeler oluşturmak için chatgpt kullanmak... buna 1 dakikada bakabilirseniz daha iyi olur... ama belki zamanla siz de görebilirsiniz. iCantw84it tarafından 23/02/23 eğer bunu ilgi çekici bulursanız lütfen beğenin/takip edin ve en önemlisi destekleyin. teşekkürler, çok fazla ayrıntıya girmediğimi biliyorum ama sadece bir araya getirdiğim için bu hareketi işaretlemek istedim ve kemerinin altında bazı işlemler istiyorum. tekrar teşekkürler.
iCantw84it
TRXUSDT using trigger on 8hr and 20 min Trigger .62704
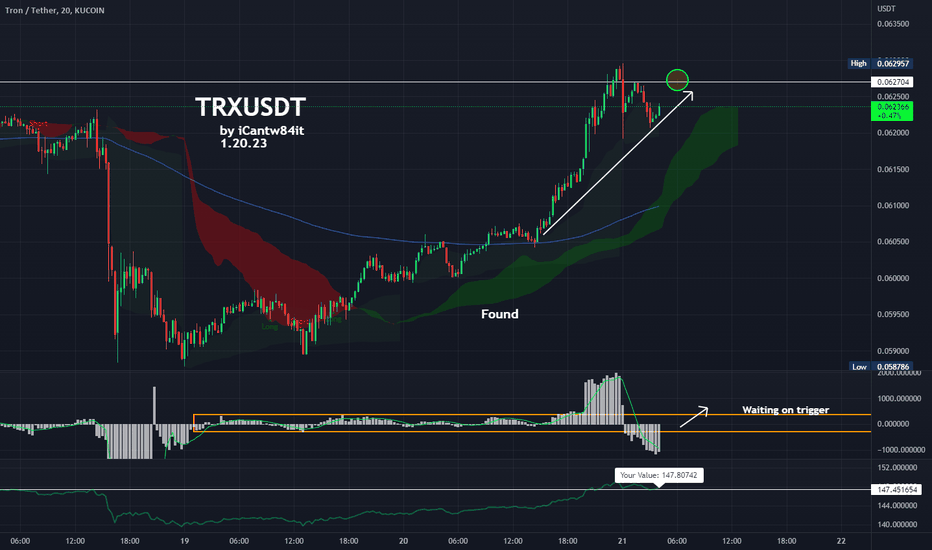
Tetikleyicimi 8 saatlik bir işlemde test ediyordum ve bu kriptoyla karşılaştım. Hareket güzel ve patlamaya hazır. Çok fazla patlama potansiyeli var. Hala Hacmin ortalamanın üzerine çıkıp tetikleyicimi tetiklemesini bekliyorum. Eğer tetiklerse güzel bir koşu olabilir. Bunu aynı tetikleyiciyle 20 dakikalık bir işlemde de sıraladım... fraktal büyük ve küçük zaman dilimleri sıralanıyor başka ne isteyebilirsiniz ki. iCantw84it tarafından 01/20/23
iCantw84it
LUNCUSDT just finished the bottom bounce Launch Time

LUNCUSDT dip sıçramasını yeni bitirdi. Genellikle dağıtımdan birikime doğru bir hareket, konsolide olan ve daha sonra sıçrayan ve taban çizgisinden daha yükseğe konsolide olan bir düşüşe benzer... (bu, dağıtımdan önce konsolidasyonun ortasındaki aşağı doğru itmedir) Daha sonra konsolidasyon yüksekliğinden sonra, stop loss'u kırmak ve daha fazla float'ı emmek için taban çizgisinin altında manipüle etmek üzere tekrar düşer. Daha sonra emilimden sonra grafikte gösterilen ve Hacim ile son 6 mumda 38 milyar hacim olduğunu belirten yükseğe geri dönüş... son mumda kendi başına 34 milyar vardı. Bu, emilimin tamamlandığının bir işaretidir ve şimdi daha önce geçemediği alanın hemen altında tekrar yüksekte konsolide olur. Daha sonra kırılmaya hazır olduğunda, herkesin stop loss'unu yerleştirmek için safe olduğunu düşündüğü yukarı doğru hareket ettiği çizgiyi kırmak için geri düşecektir... Geçemediği alanı kırmak için ihtiyaç duyduğu float'ın kalan son kısmını emmek için bu çizgiyi kırar. Bu bölgede bu kadar uzun süre kalmasının sebebi her zaman çizelgesinde bu kalıbı yapması ve her birinin bu hareketi tamamlamasını beklemesidir. Şimdi bu noktada olduğumuza göre kar için hareketine başlayabilir... Umarım bu aşamada bir öncekinde olduğu kadar uzun sürer... smhby iCantw84it10.31.22Sadece 4 gün gecikmeli ama yine de... Zamanlama, emilimin burada başarılı olup olmamasına bağlıdır. Son zamanlarda piyasanın hemen yükselişe yanıt vermediği tek zaman bu... Bunun ne anlama geldiğinden emin değilim ama bir tahminde bulunmam gerekirse iki şeyden biri. 1. Tüketici inancı sarsılıyor ve daha az insan yükselişe geçiyor ve kararlarından şüphe etmeye başlıyor ve korku yerleşiyor, bu da paralarını çektikleri anlamına geliyor. 2. Daha büyük balinalar istiyor ve tüm hisseler bizde ve hisseleri bizden almanın tek yolu, bir süredir olduğundan daha derine inmek ve perakende zayıf ellerini hisselerinden çıkarmak için mini boğa tuzakları oluşturmak. Böylece telefonla arayıp tüm karı elde edebilirler. Üçüncü bir şans vereceğim, her ikisinin de doğru olması çok olası çünkü ikinci fikir nihayetinde ilk fikrin gerçeğe dönüşmesini sağlayacaktır...........Normal bir piyasada, bu eğitimli tahminlerin ne zaman patlayacaklarına dair zamanlaması tam yerindedir...bu yüzden bundan çıkarabileceğiniz şey, önerilen zamandan hemen önce veya sonra bir mum içinde patladığında, manipülasyon düşük seviyededir ve perakende programlandığı şeyi yapmaktadır. Zamanlama yanlış olduğunda bunun nedeni perakendenin kurumsalların onlardan yapmasını istediklerini takip etmemesi veya manipüle edilmesidir. Zamanlamam, perakendenin algo'in perakendeyi maruz bıraktığı psikolojiye verdiği doğal tepkidir.Düşüncelerinizi bana bildirin. ve Mutlu ticaretler.. Manipülasyon azalıncaya kadar şu anda yalnızca uzun vadeli ticaret yapıyorum. Aşağıda son konsolidasyon döneminin ve mevcut durumun yeni bir resmini yayınlayacağım... Bu, perakendenin geçen seferki gibi yanıt vermesi ve kurumsalların hala perakendeyi cebinde tutması durumunda bunun ne kadar süreceği konusunda bize bir fikir vermeli. USDT tarafından onaylanan 1,6 Milyon, LUNC Geliştirmeye gidiyor ve bunu Tendermint ve vanilla Cosmos ve Casm Wasm'a bağlıyor..... Sürüm 2, Terra Rebels'ın güncelleme listesinde gördüğüm başka bir şey. Büyüme modeli ayrıca, LUNC için oluşturulan ve uygulanan dapp'lere dayalı bir Ödeme veya teşvik içeriyor. Az önce yaptığı en düşük seviyeye ayak basmak için aşağı iniyor... Az önce yaptığı en yüksek seviyeyi kırmak için bunu kullanmalı. Döngünün sonu 7 Kasım 2022 @ 7:57am burada yukarı doğru hareket etmeye başlamalı. Durduruyor ve son zirveyi kırabilmek için hisseleri serbest bırakıyor. Bunu görselleştirmenize yardımcı oluyorsa... tüm piyasanın şu 3 şeyden oluştuğunu hayal edin:ÇıkışÇöküşKonsolidasyonBazen çıkışlar, çöküşler ve bir sonraki çöküş, onu iten perakende miktarı nedeniyle birbirine gerçekten yakın olur... perakende algo'ye ne kadar fazla satır içi olursa, daha dikey desenlerde hareket eder... perakende satır içi ne kadar az olursa, bu deseni iğnelere daha az ve daha geniş gerilmiş W'ler ve M'ler gibi gösterecek şekilde gerer. Bu, perakendeyi çitin doğru tarafına geçirmek için manipüle eden algo'dir. Uzun süreler boyunca konsolidasyon gördüğünüzde, çitin hangi tarafında olduklarını görmek için perakendeyi değiştirmeye veya test etmeye hazırlanıyor demektir. eğer doğru tarafta olmazlarsa ya hemen ya da fiyat hareketindeki ani artıştan hemen sonra başarısızlığa uğrayacaklar... bu noktada algo'un daha ucuz hisseler bulması ve serbest dolaşımı absorbe etmek için daha fazla hisseyi serbest bırakması ve yapmak istediklerini destekleyecek daha fazla perakende alıcı bulması gerekiyor.
iCantw84it
LUNCUSDT Pop set up to launch

Bu mumu EST saat 20:00'de izleyin. Son yazımda farklı bir grafik kullandım. Aynı olmalı ama daha kısa bir zaman dilimi istedim. Döngü Teorisi, burada perakende satış için bir test olmalı ve patlamalı. iCantw84it09.12.22 tarafından
iCantw84it
LUNCUSDT Terra Classic setting up for a Pop @ 8pm est

Bu mumu 20:00 EST'de izleyin. Patlamaya ayarlı olmalı. iCantw84it tarafından 09.12.22
iCantw84it
LUNCUSDT about to pop again

Döngü teorisine ve 1 dakikalık bir grafiğe dayanarak, fiyat bulutun altına düşmeli ve sonraki 30 dakika içinde yeniden yüzeye çıkmalıdır. Yön değişikliği 19:59 est saatinde başlamalı ve ardından başka bir büyük itme gelmelidir. iCantw84it09.05.22 tarafından
Sorumluluk Reddi
Sahmeto'nun web sitesinde ve resmi iletişim kanallarında yer alan herhangi bir içerik ve materyal, kişisel görüşlerin ve analizlerin bir derlemesidir ve bağlayıcı değildir. Borsa ve kripto para piyasasına alım, satım, giriş veya çıkış için herhangi bir tavsiye oluşturmazlar. Ayrıca, web sitesinde ve kanallarda yer alan tüm haberler ve analizler, yalnızca resmi ve gayri resmi yerli ve yabancı kaynaklardan yeniden yayınlanan bilgilerdir ve söz konusu içeriğin kullanıcılarının materyallerin orijinalliğini ve doğruluğunu takip etmekten ve sağlamaktan sorumlu olduğu açıktır. Bu nedenle, sorumluluk reddedilirken, sermaye piyasası ve kripto para piyasasındaki herhangi bir karar verme, eylem ve olası kar ve zarar sorumluluğunun yatırımcıya ait olduğu beyan edilir.