
Trendoscope
@t_Trendoscope

Ne tavsiye etmek istersiniz?
önceki makale
پیام های تریدر
filtre
Trendoscope
HOW-TO: Auto Harmonic Screener - UltimateX
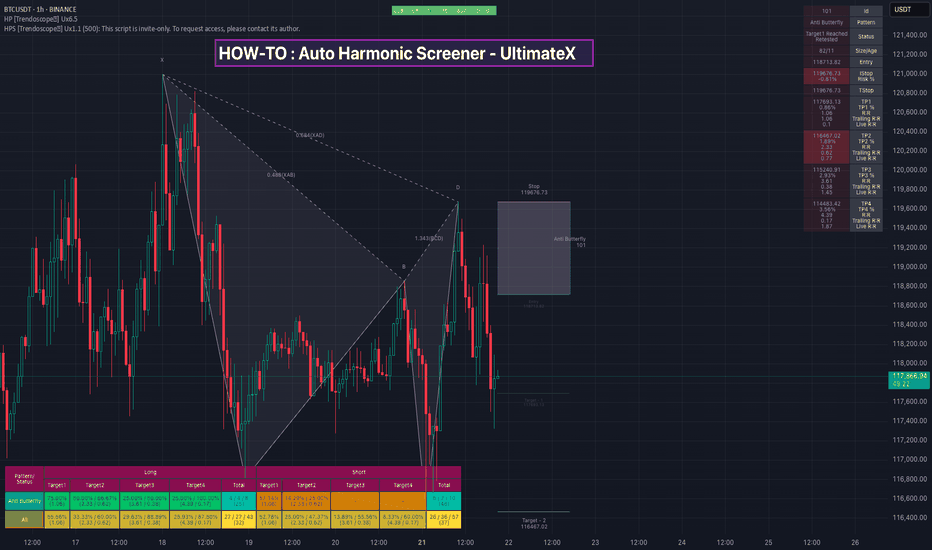
Herkese merhaba, Bu videoda, yeni otomatik harmonik ekranımız olan UltimateX'in nasıl kullanılacağı hakkında tartıştık. Aşağıdaki konuları ele aldık. Arasındaki fark Otomatik Harmonik Screener - UltimateX (Mevcut senaryo) ve Otomatik Harmonik Desen - Ultimatex ve her iki komut dosyasının birlikte nasıl kullanılacağı Arasındaki fark Otomatik Harmonik Screener - UltimateX (Geçerli komut dosyası) ve mevcut tarama Otomatik Harmonik Desen - Screener request. Güvenlik çağrıları üzerine kurulur. Eski senaryoların sınırlamalarının ve yeni senaryoyu nasıl kullanmanın Çam tarayıcısı Fayda bu sorunların üstesinden gelmeye yardımcı olacaktır. Gösterge ayarlarından geçtik (neredeyse otomatik harmonik desen Ultimatex'e benzeyen Senaryoyu nasıl kullanacağınıza dair kısa demo Çam tarayıcısı Ayrıca mevcut videomuzu kontrol edin Yeni Çam Ekrancı Yardımcı Programı Nasıl Kullanılır.
Trendoscope
Pine Screener - Powerful tool for building programmable screener
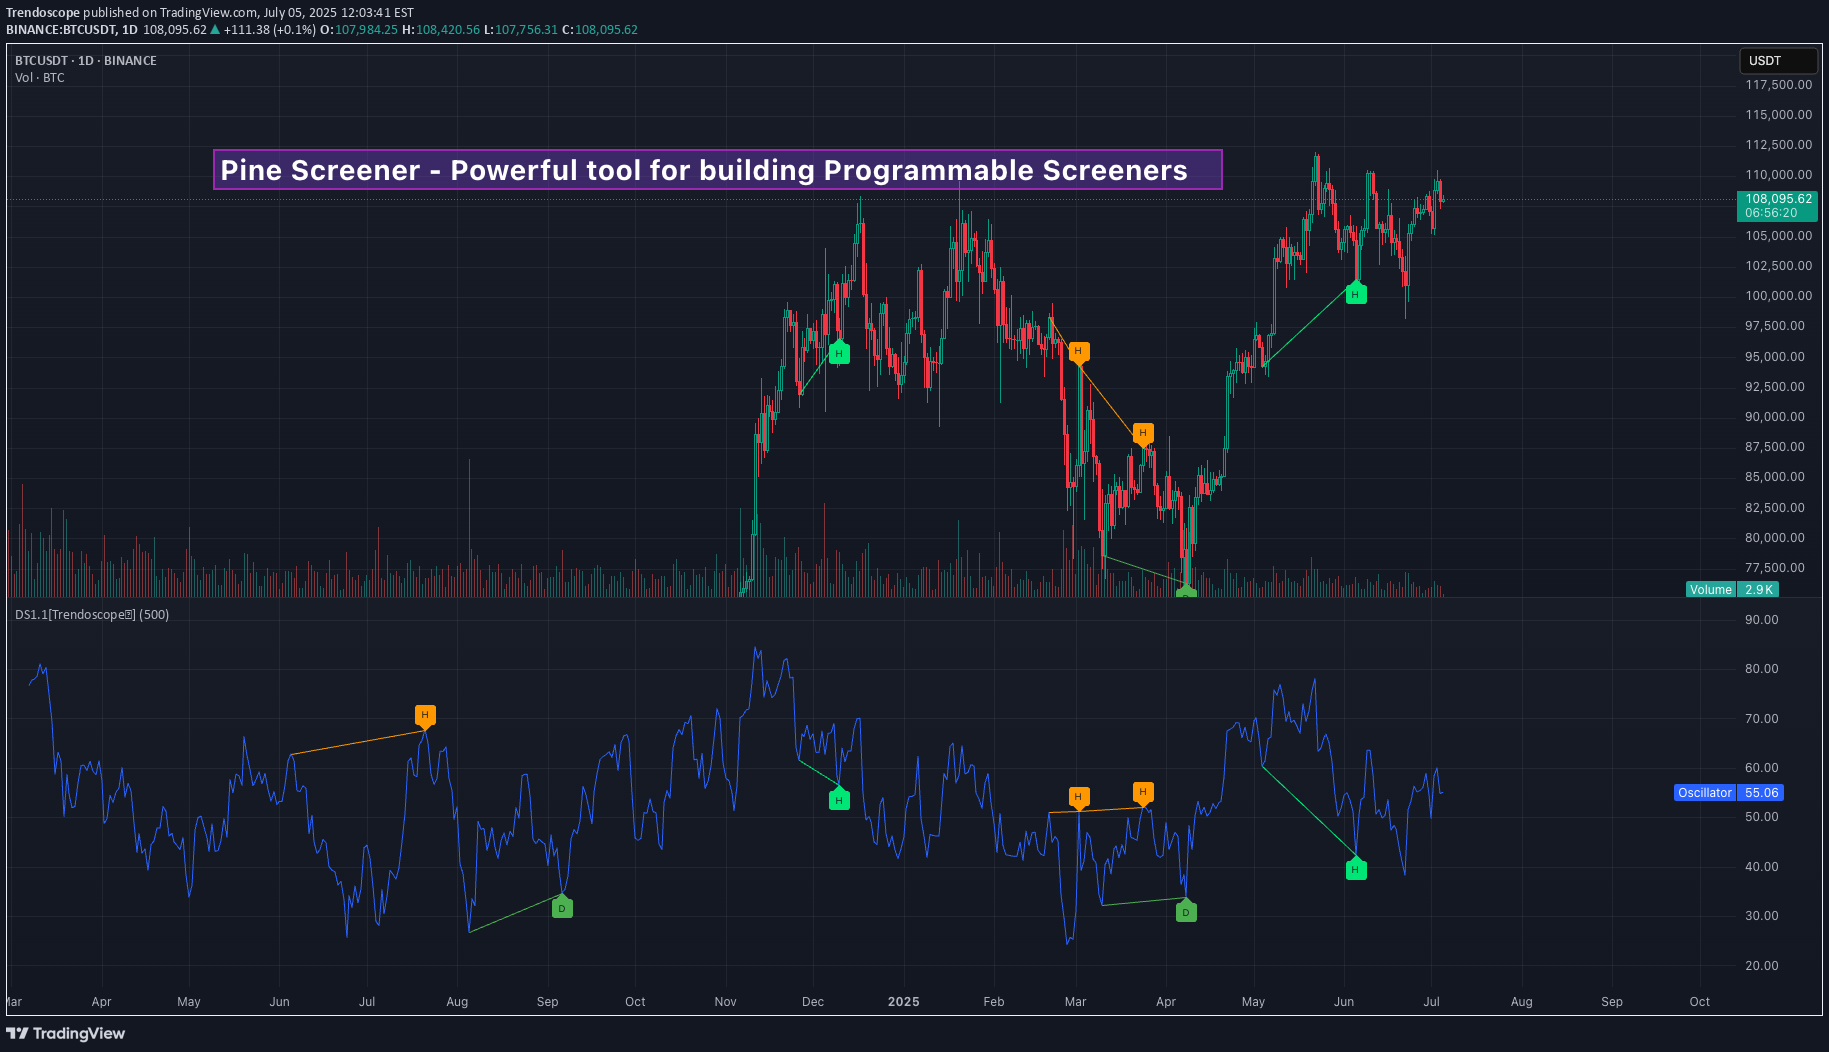
Herkese merhaba, bu videoda, TradingView'in Pine Screener yardımcı programının nasıl kullanılacağı hakkında tartıştık. Bu gösteri ve ekran stokları için yükseliş ve ekran stokları için gösterge sapma ekranından yararlanıyoruz. Kısaca, buradaki adımlar: 🎯 1000'den az sembollerden daha az izleme listesi oluşturmak için stok ekranını kullanın🎯 Pine ekranında kullanmak istediğiniz göstergeyi ekleyin. Tradingview.com/pine-screener/🎯 Pine listesini ve göstergesini çam ekranına ekleyin ve zaman dilimini ve gösterge ayarlarını ayarlayın🎯 Taranacak kriterleri seçin ve tarama tuşuna basın
Trendoscope
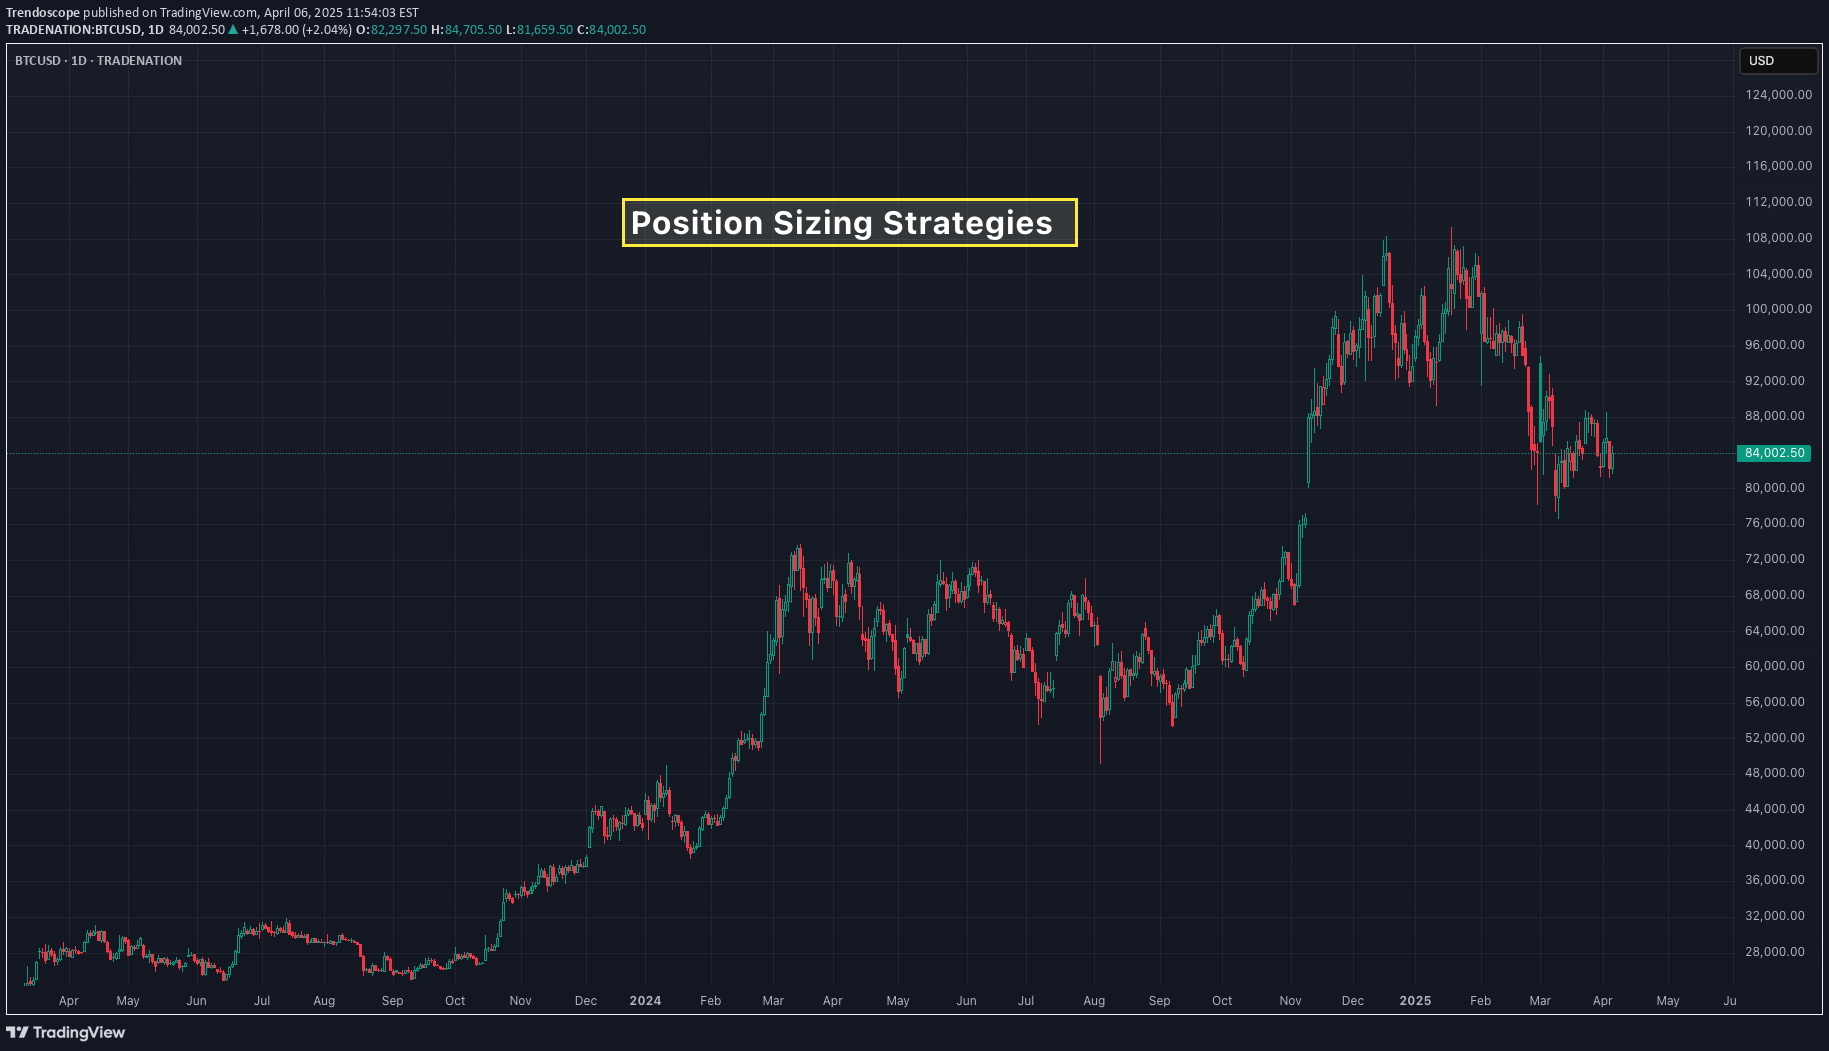
Position Sizing Strategies
Position sizing is one of the most important aspects in risk management for traders. Proper position sizing helps manage the risk effectively by maximizing profits and limiting the losses. In this publication, we will explore popular position sizing strategies and how to implement them in pinescript strategies 🎲 Importance of Position Sizing in Trading Let's take an example to demonstrate the importance of position sizing. You have a very good strategy that gives you win on 70% of the times with risk reward of 1:1. If you start trading with this strategy with all your funds tied into a single trade, you have the risk of losing most of your fund in the first few trades and even with 70% win rate at later point of time, you may not be able to recoup the losses. In such scenarios, intelligent position sizing based on the events will help minimize the loss. In this tutorial, let us discuss some of those methods along with appropriate scenarios where that can be used. 🎲 Position Sizing Strategies Available in Tradingview Strategy Implementation 🎯 Fixed dollar amount position sizing In this method, trader allocate a fixed value of X per trade. Though this method is simple, there are few drawbacks Does not account for varying equity based on the trade outcomes Does not account for varying risk based on the volatility of the instrument 🎯 Fixed Percentage of Equity In this method, percent of equity is used as position size for every trade. This method is also simple and slightly better than the Fixed dollar amount position sizing. However, there is still a risk of not accounting for volatility of the instrument for position sizing. In tradingview strategies, you can find the position sizing settings in the properties section. In both cases, Pinescript code for the entry does not need to specify quantity explicitly, as they will be taken care by the framework. Pine Script® if(longEntry) strategy.entry('long', strategy.long) if(shortEntry) strategy.entry('short', strategy.short) 🎲 Advanced Position Sizing Strategies There are not directly supported in Tradingview/Pinescript - however, they can be programmed. 🎯 Fixed Fractional Method The Fixed Fractional Method is similar to the fixed percentage of equity method/fixed dollar amount positioning method, but it takes into account the amount of risk on each trade and calculate the position size on that basis. This method calculates position size based on the trader’s risk tolerance, factoring in stop-loss levels and account equity. Due to this, the trader can use any instrument and any timeframe with any volatility with fixed risk position. This means, the quantity of overall trade may vary, but the risk will remain constant. Example. Let's say you have 1000 USD with you and you want to trade BTCUSD with entry price of 100000 and stop price of 80000 and target of 120000. You want to risk only 5% of your capital for this trade. Calculation will be done as follows. Risk per trade = 5% of 1000 = 50 USD Risk per quantity = (entry price - stop price) = 20000 So, the quantity to be used for this trade is calculated by RiskQty = Risk Amount / Risk Per Quantity = 50 / 20000 = 0.0025 BTC To implement the similar logic in Pinescript strategy by using the strategy order quantity as risk, we can use the following code Pine Script® riskAmount = strategy.default_entry_qty(entryPrice)*entryPrice riskPerQty = math.abs(entryPrice-stopPrice) riskQty = riskAmount/riskPerQty With this, entry and exit conditions can be updated to as follows Pine Script® if(longEntry) strategy.entry('long', strategy.long, riskQty, stop=entryPrice) strategy.exit('ExitLong', 'long', stop=stopPrice, limit=targetPrice) if(shortEntry) strategy.entry('short', strategy.short, riskQty, stop=entryPrice) strategy.exit('ExitShort', 'short', stop=stopPrice, limit=targetPrice) Expand 1 line 🎯 Kelly Criterion Method The Kelly Criterion is a mathematical formula used to determine the optimal position size that maximizes the long-term growth of capital, considering both the probability of winning and the payoff ratio (risk-reward). It’s a more sophisticated method that balances risk and reward in an optimal way. Kelly Criterion method needs a consistent data on the expected win ratio. As and when the win ratio changes, the position sizing will adjust automatically. Formula is as follows f = W - L/R f: Fraction of your capital to bet. W : Win Ratio L : Loss Ratio (1-W) R : Risk Reward for the trade Let's say, you have a strategy that provides 60% win ratio with risk reward of 1.5, then the calculation of position size in terms of percent will be as follows f = 0.6 - 0.4/1.5 = 0.33 Pinescript equivalent of this calculation will be Pine Script® riskReward = 2 factor = 0.1 winPercent = strategy.wintrades/(strategy.wintrades+strategy.losstrades) kkPercent = winPercent - (1-winPercent)/riskReward tradeAmount = strategy.equity * kkPercent * factor tradeQty = tradeAmount/entryPrice Expand 1 line 🎲 High Risk Position Sizing Strategies These strategies are considered very high risk and high reward. These are also the strategies that need higher win ratio in order to work effectively. 🎯Martingale Strategy The Martingale method is a progressive betting strategy where the position size is doubled after every loss. The goal is to recover all previous losses with a single win. The basic idea is that after a loss, you double the size of the next trade to make back the lost money (and make a profit equal to the original bet size). How it Works: If you lose a trade, you increase your position size on the next trade. You keep doubling the position size until you win. Once you win, you return to the original position size and start the process again. To implement martingale in Pine strategy, we would need to calculate the last consecutive losses before placing the trade. It can be done via following code. Pine Script® var consecutiveLosses = 0 if(ta.change(strategy.closedtrades) > 0) lastProfit = strategy.closedtrades.profit(strategy.closedtrades-1) consecutiveLosses := lastProfit > 0? 0 : consecutiveLosses + 1 Quantity can be calculated using the number of consecutive losses Pine Script® qtyMultiplier = math.pow(2, consecutiveLosses) baseQty = 1 tradeQty = baseQty * qtyMultiplier 🎯Paroli System (also known as the Reverse Martingale) The Paroli System is similar to the Anti-Martingale strategy but with more defined limits on how much you increase your position after each win. It's a progressive betting system where you increase your position after a win, but once you've won a set number of times, you reset to the original bet size. How it Works: Start with an initial bet. After each win, increase your bet by a predetermined amount (often doubling it). After a set number of wins (e.g., 3 wins in a row), reset to the original position size. To implement inverse martingale or Paroli system through pinescript, we need to first calculate consecutive wins. Pine Script® var consecutiveWins = 0 var maxLimit = 3 if(ta.change(strategy.closedtrades) > 0) lastProfit = strategy.closedtrades.profit(strategy.closedtrades-1) consecutiveWins := lastProfit > 0? consecutiveWins + 1 : 0 if(consecutiveWins >= maxLimit) consecutiveWins := 0 Expand 2 lines The quantity is then calculated using a similar formula as that of Martingale, but using consecutiveWins Pine Script® qtyMultiplier = math.pow(2, consecutiveWins) baseQty = 1 tradeQty = baseQty * qtyMultiplier 🎯D'Alembert Strategy The D'Alembert strategy is a more conservative progression method than Martingale. You increase your bet by one unit after a loss and decrease it by one unit after a win. This is a slow, incremental approach compared to the rapid growth of the Martingale system. How it Works: Start with a base bet (e.g., $1). After each loss, increase your bet by 1 unit. After each win, decrease your bet by 1 unit (but never go below the base bet). In order to find the position size on pinescript strategy, we can use following code Pine Script® // Initial position initialposition = 1.0 var position = initialposition // Step to increase or decrease position step = 2 if(ta.change(strategy.closedtrades) > 0) lastProfit = strategy.closedtrades.profit(strategy.closedtrades-1) position := lastProfit > 0 ? math.max(initialposition, position-step) : position+step Expand 3 lines Conclusion Position sizing is a crucial part of trading strategy that directly impacts your ability to manage risk and achieve long-term profitability. By selecting the appropriate position sizing method, traders can ensure they are taking on an acceptable level of risk while maximizing their potential rewards. The key to success lies in understanding each strategy, testing it, and applying it consistently to align with your risk tolerance and trading objectives.
Trendoscope
Trading Converging Chart Patterns
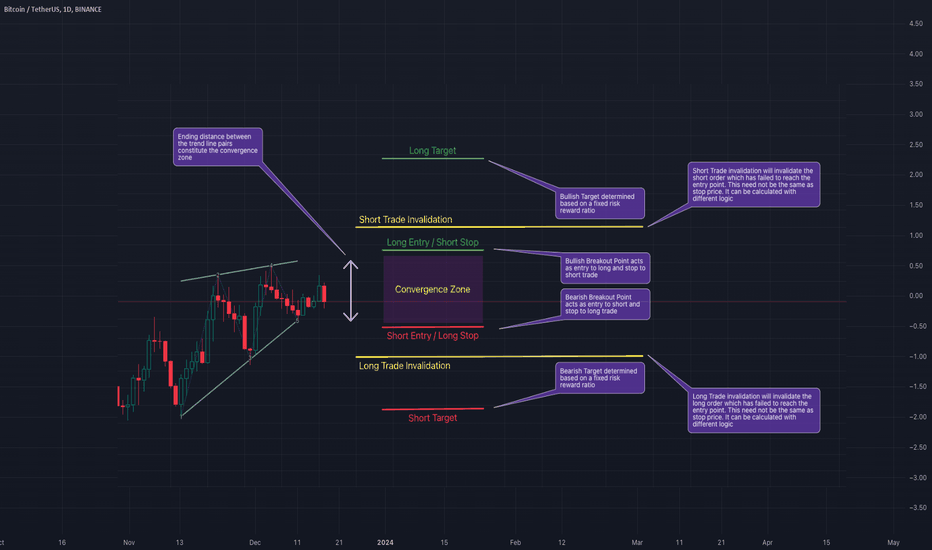
We discussed identification and classification of different chart patterns and chart pattern extensions in our previous posts. Algorithmic Identification of Chart Patterns Flag and Pennant Chart Patterns In this installment, we shift our focus towards the practical trading strategies applicable to a select group of these patterns. Acknowledging that a universal trading rule cannot apply to all patterns, we narrow our examination to those of the converging variety. We will specifically address the following converging patterns: Rising Wedge (Converging Type) Falling Wedge (Converging Type) Converging Triangle Rising Triangle (Converging Type) Falling Triangle (Converging Type) This selection will guide our discussion on how to approach these patterns from a trading perspective. 🎲 Historical Bias and General Perception Each pattern we've discussed carries a historical sentiment that is widely regarded as a guideline for trading. Before we delve into our specific trading strategies, it's crucial to understand these historical sentiments and the general market interpretations associated with them. 🟡 The Dynamics of Contracting Wedge Patterns Contracting Wedge patterns are typically indicative of the Elliott Wave Structure's diagonal waves, potentially marking either the beginning or conclusion of these waves. A contracting wedge within a leading diagonal may experience a brief retracement before the trend resumes. Conversely, if found in an ending diagonal, it could signal the termination of wave 5 or C, possibly hinting at a significant trend reversal. The prevailing view suggests that these patterns usually precede a short-term directional shift: Rising Wedges are seen as bearish signals, while Falling Wedges are interpreted as bullish. It's essential to consider the trend prior to the formation of these patterns, as it significantly aids in determining their context within the Elliott Wave cycles, specifically identifying them as part of waves 1, A, 5, or C. For an in-depth exploration, refer to our detailed analysis in Decoding Wedge Patterns 🎯 Rising Wedge (Converging Type) The Rising Wedge pattern, historically viewed with a bearish bias, suggests that a downward trend is more likely upon a breakout below its lower trend line. This perception positions the pattern as a signal for traders to consider bearish positions once the price breaks through this critical support. 🎯 Falling Wedge (Converging Type) The Falling Wedge pattern is traditionally seen through a bullish lens, indicating potential upward momentum when the price surpasses its upper trend line. This established viewpoint suggests initiating long positions as a strategic response to such a breakout, aligning with the pattern's optimistic forecast. 🟡 Contracting Triangle Patterns Contracting Triangles, encompassing Converging, Ascending, and Descending Triangles, are particularly noteworthy when they appear as part of the Elliott Wave's B or 2 waves. These patterns typically signal a continuation of the pre-existing trend that preceded the triangle's formation. This principle also underpins the Pennant Pattern, which emerges following an impulse wave, indicating a pause before the trend's resumption. 🎲 Alternate Way of Looking into Converging Patterns Main issue with historical perception are: There is no clear back testing data to prove whether the general perception is correct or more profitable. Elliott Waves concepts are very much subjective and can be often difficult for beginners and misleading even for experts. So, the alternative way is to treat all the converging patterns equally and devise a method to trade using a universal way. This allows us to back test our thesis and be definitive about the profitability of these patterns. Here are our simple steps to devise and test a converging pattern based strategy. Consider all converging patterns as bidirectional. Meaning, they can be traded on either side. Thus chose to trade based on the breakout. If the price beaks up, then trade long and if the price breaks down, then trade short. For each direction, define criteria for entry, stop, target prices and also an invalidation price at which the trade is ignored even without entry. Backtest and Forward test the strategy and collect data with respect to win ratio, risk reward and profit factor to understand the profitability of patterns and the methodology. Now, let's break it further down. 🟡 Defining The Pattern Trade Conditions Measure the ending distance between the trend line pairs and set breakout points above and beyond the convergence zone. 🎯 Entry Points - These can be formed on either side of the convergence zone. Adding a small buffer on top of the convergence zone is ideal for setting the entry points of converging patterns. Formula for Entry can be: Pine Script® Long Entry Price = Top + (Top - Bottom) X Entry Ratio Short Entry Price = Bottom - (Top-Bottom) X Entry Ratio Whereas Top refers to the upper side of the convergence zone and bottom refers to the lower side of the convergence zone. Entry Ratio is the buffer ratio to apply on top of the convergence zone to get entry points. 🎯 Stop Price - Long entry can act as stop for short orders and the short entry can act as stop price for long orders. However, this is not mandatory and different logic for stops can be applied for both sides. Formula for Stop Can be Pine Script® Long Stop Price = Bottom - (Top - Bottom) X Stop Ratio Short Stop Price = Top + (Top - Bottom) X Stop Ratio 🎯 Target Price - It is always good to set targets based on desired risk reward ratio. That means, the target should always depend on the distance between entry and stop price. The general formula for Target can be: Pine Script® Target Price = Entry + (Entry-Stop) X Risk Reward 🎯 Invalidation Price - Invalidation price is a level where the trade direction for a particular pattern needs to be ignored or invalidated. This price need to be beyond stop price. In general, trade is closed when a pattern hits invalidation price. Formula for Invalidation price is the same as that of Stop Price, but Invalidation Ratio is more than that of Stop Ratio Pine Script® Long Invalidation Price = Bottom - (Top - Bottom) X Invalidation Ratio Short Invalidation Price = Top + (Top - Bottom) X Invalidation Ratio 🟡 Back Test and Forward Test and Measure the Profit Factor It is important to perform sufficient testing to understand the profitability of the strategy before using them on the live trades. Use multiple timeframes and symbols to perform a series of back tests and forward tests, and collect as much data as possible on the historical outcomes of the strategy. Profit Factor of the strategy can be calculated by using a simple formula Pine Script® Profit Factor = (Wins/Losses) X Risk Reward 🟡 Use Filters and Different Combinations Filters will help us in filtering out noise and trade only the selective patterns. The filters can include a simple logic such as trade long only if price is above 200 SMA and trade short only if price is below 200 SMA. Or it can be as complex as looking into the divergence signals or other complex variables.
Trendoscope
Flag and Pennant Chart Patterns
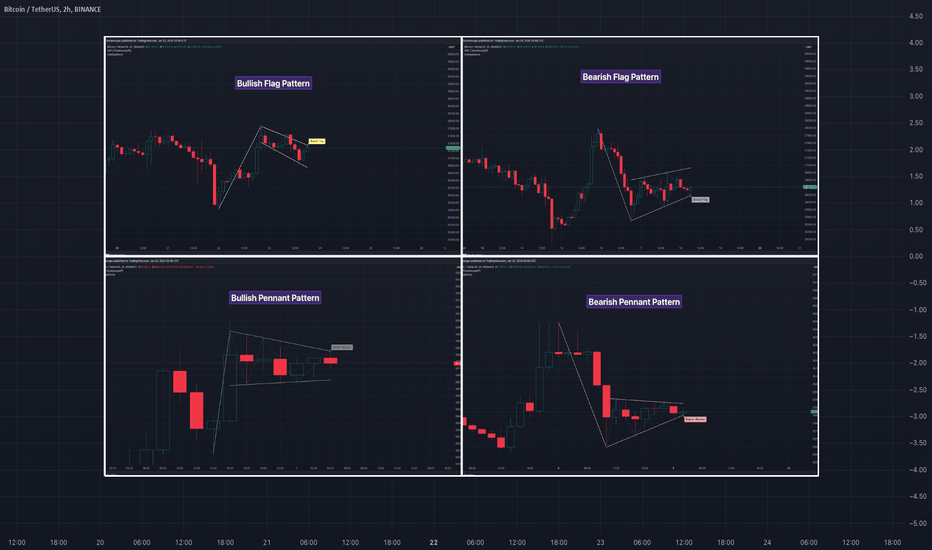
🎲 Trend Çizgisi Çiftlerine Dayalı Grafik Desenlerine Bir Uzantı - Bayraklar ve FlamalarGrafik Desenlerinin Algoritmik Tanımlanması ve Sınıflandırılmasını inceledikten sonra, şimdi bu desenlerin uzantılarına dalarak Bayrak ve Flama Grafik Desenlerine odaklanıyoruz. Bu desenler, genellikle önceki piyasa dürtülerinden etkilenen temel trend çizgisi çifti tabanlı yapılardan gelişir.🎲 Uzatma Desenleri için Tanımlama Kuralları🎯 Temel Grafik Desenlerinin Varlığını BelirlemeBayrak ve flama desenlerini belirlemeden önce, öncelikle temel trend çizgisi çifti tabanlı yakınsayan veya paralel desenlerin varlığını belirlememiz gerekir.Yükselen KanalAzalan KanalYükselen Kama (Daralma)Düşen Kama (Daralma)Yakınsayan ÜçgenAzalan Üçgen (Daralma)Yükselen Üçgen (Daralma)🎯 Uzatma Desenlerini Belirleme.Bu desenleri tam olarak belirlemenin anahtarı, bir temel desenden önce gelen güçlü bir dürtüsel dalgayı -bir bayrak direğine benzer- tespit etmektir. Bu kurulum bir uzatma deseni için potansiyel olduğunu gösteriyor: Bir Boğa Bayrağı, pozitif bir dürtüden sonra alçalan bir kanaldan veya düşen bir kamadan ortaya çıkar. Bir Ayı Bayrağı, negatif bir dürtüden sonra yükselen bir kanala veya yükselen bir kamadan sonra ortaya çıkar. Bir Boğa Bayrağı, birleşen bir üçgen veya yükselen bir üçgenden önce gelen pozitif bir itme ile gösterilir. Ayı Bayrağı, negatif bir dürtü ve birleşen veya alçalan bir üçgeni takip eder. 🎲 Desen Sınıflandırmaları ve Özellikleri 🎯 Boğa Bayrağı Deseni Boğa Bayrağı Deseninin özellikleri aşağıdaki gibidir Pozitif bir dürtü dalgasıyla başlar Hemen ardından kısa bir alçalan kanal veya düşen kama gelir İşte Boğa Bayrağı Deseninin bir örneği 🎯 Ayı Bayrağı Deseni Ayı Bayrağı Deseninin özellikleri aşağıdaki gibidir Negatif bir dürtü dalgasıyla başlar Hemen ardından kısa bir yükselen kanal veya yükselen kama gelir İşte Ayı Bayrağı Deseninin bir örneği 🎯 Boğa Flaması Deseni Boğa Flaması Deseninin özellikleri aşağıdaki gibidir Pozitif bir dürtü dalgasıyla başlar Hemen ardından yakınsayan üçgen veya yükselen üçgen deseni gelir. İşte Boğa Flaması Deseninin bir örneği 🎯 Ayı Flaması Deseni Ayı Flaması Deseninin özellikleri aşağıdaki gibidir Negatif bir dürtü dalgasıyla başlar dürtü dalgasıHemen ardından birleşen üçgen veya alçalan birleşen üçgen deseni gelir. İşte Ayı Flaması Deseni'ne bir örnek🎲 İşlem Uzatma DesenleriGüçlü bir piyasa trendinde, genellikle devam eden trend yönünün tersine, birleşen veya aralıklı desenler oluşturan geçici konsolidasyon dönemleri görmek yaygındır. Bu tür duraklamalar, kırılma sonrası trendin devam etmesi için zemin hazırlayabilir. Trendin devam edeceği varsayımı, Bayrak ve Flama desenlerinin altında yatan eğilimi şekillendirirAncak, kararları yalnızca geçmiş trendlere dayandırmamak önemlidir. Bu desenler için en etkili giriş ve çıkış stratejilerini belirlemek için kişisel geri test yapmak çok önemlidir. Unutmayın, bu desenlerin davranışı, varlığın oynaklığına ve analiz edilen belirli zaman dilimine göre önemli ölçüde değişebilir.Piyasa dinamiklerinin beklenen sonuçlardan sapma gösterebilecek çok çeşitli etki faktörlerine tabi olduğunu göz önünde bulundurarak, bu desenlerin yorumlanmasına ihtiyatlı yaklaşın. Yatırımcılar ve tüccarlar için, kapsamlı bir geri teste girmek, giriş noktaları, zarar durdurma emirleri ve bireysel işlem tarzınıza ve risk iştahınıza uyan hedef hedefler belirlemek esastır. Bu adım, bu kalıpların kişisel işlem stratejileriniz ve hedefleriniz doğrultusunda uygulanabilirliğini değerlendirmek için önemlidir. Bu kalıplar oluştuktan sonra bir kopuşu ve ardından hızlı bir fiyat tersine dönüşünü görmek oldukça yaygındır. Ek olarak, kopuş ters yönde gerçekleşirse, özellikle de kalıbın oluşumundan önceki trend kalıp önyargısına karşı olduğunda, önyargıya karşı giderek işlemde yenilik için yer vardır.🎲 Hile Sayfası
Trendoscope
Thinking in Pine - Study References Too Many Bars In the History
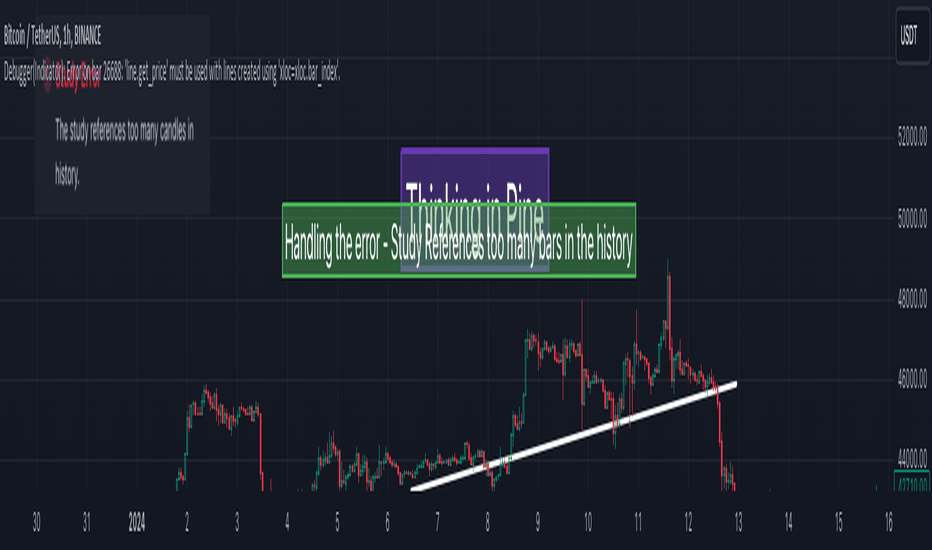
Pine Script konuları hakkında kısa video serisi olan "Thinking in Pine"a hoş geldiniz. Bugünün konusu "Çalışma geçmişte çok fazla mum referansı veriyor" hatasının ve diğer bar_index ile ilgili sorunların ele alınması. Pine Script zaman serisi kavramlarına aşina değilseniz lütfen önceki videolarımızı inceleyin. Thinking in Pine - Zaman SerisiThinking in Pine - Zaman Serisinin Özel Durumları🎲 Tartışılan Noktalar "Çalışma geçmişte çok fazla mum referansı veriyor" hatasını ne zaman alırız ve bu sorunun üstesinden nasıl geliriz. Grafikte nesne çizerken bar_index sınırlamaları.🎯 Örnek Program - Tarihsel Referans Alternatif UygulamaPine Script®🎯 Örnek Program - Bar Endeksi ile Nesne Sınırlamalarının ÇizilmesiPine Script®
Trendoscope
Thinking in Pine - Tricks and Tips of Debugging
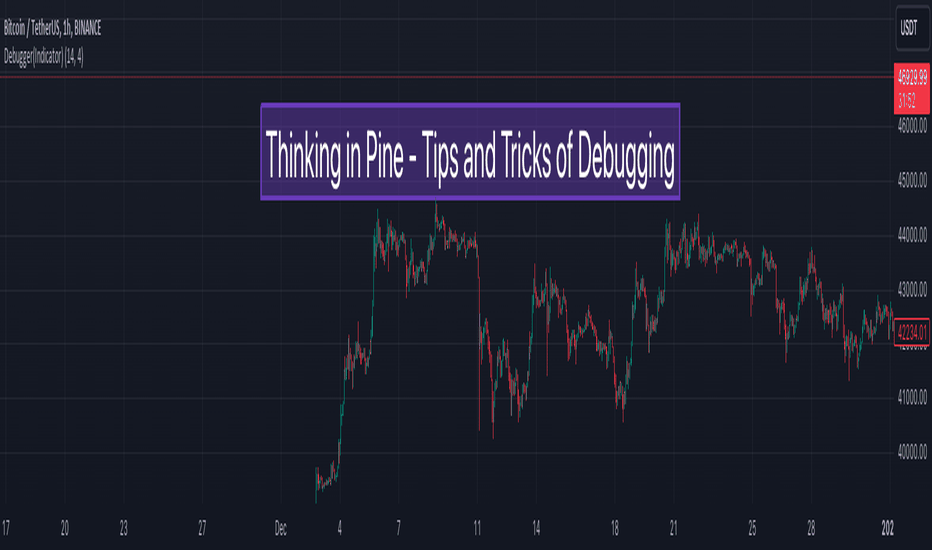
Pine Script konuları üzerine "Pine'de Düşünmek" adlı kısa video serisine hoş geldiniz. Bugünün tartışma konusu Pine Script'in programlarımızı hata ayıklamak için bize sağladığı hata ayıklama ve araçlardır. 🎲 Tartışılan Noktalar Sayısal seri değerleri için `plot` kullanarak hata ayıklama. `plot`'un uygun olmadığı durumlarda hata ayıklamak için Pine Logs'u kullanma 🎯 Örnek Program - plotPine Script® kullanarak hata ayıklama 🎯 Örnek Program - Pine LogsPine Script® 🎲 ReferanslarPine Logs - Referans Kılavuzuplot - Referans Kılavuzu
Trendoscope
Thinking in Pine - Execution Model and Rollback on Realtime Bars
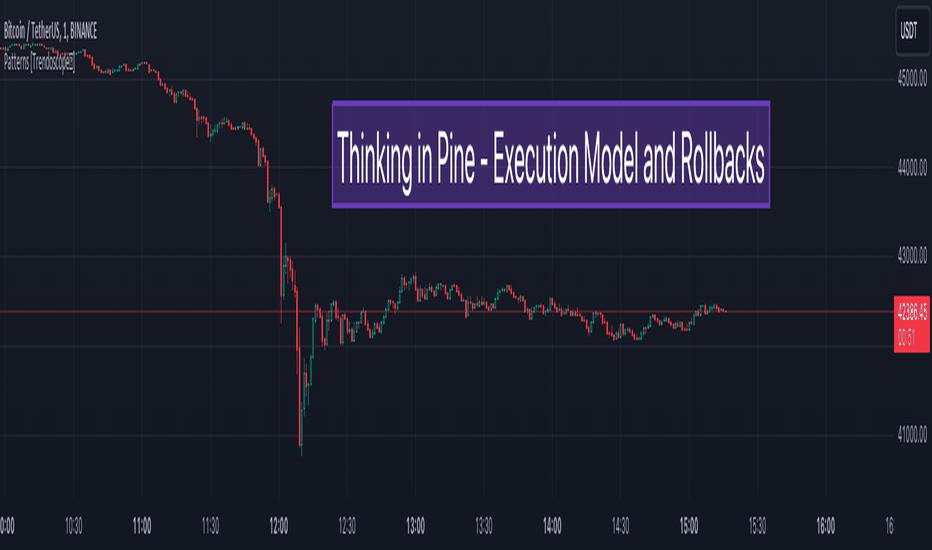
Herkese merhaba, "Pine'da Düşünmek"in bir başka oturumuna hoş geldiniz - Pine Script'te kısa video eğitimleri. Bu videoya devam etmeden önce, var, varip ve normal değişkenlere aşina değilseniz lütfen önceki videomuzu izleyin - "Pine'da Düşünmek - var, varip ve normal değişkenler"🎲 Bugünün tartışma noktaları Var, varip ve normal değişken değişiklik kodunun geçmiş ve gerçek zamanlı bar güncellemeleriyle nasıl çalıştığı. Var değişkenlerinin geri alma kavramı🎯 Kullanılan Örnek Program Pine Script®🎲 Referanslar Pine Script® Kullanıcı Kılavuzu - Yürütme Modeli
Trendoscope
Thinking in Pine - Functions Containing Var Variables
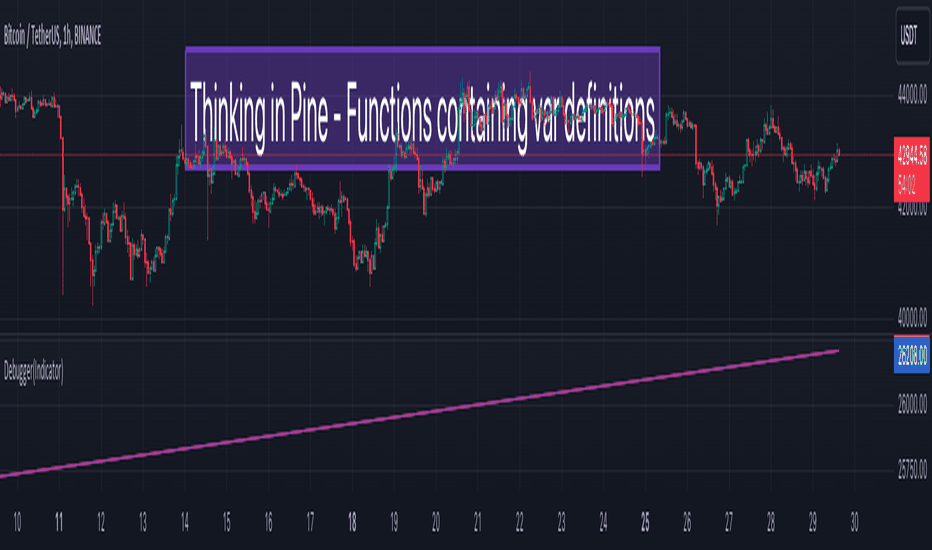
Herkese merhaba, "Pine'de Düşünmek" kısa video eğitimlerine tekrar hoş geldiniz. Bu videoda, fonksiyon tanımları içinde var değişkenleri kullanmanın özel durumlarını ele aldık. Var değişkenlerine aşina değilseniz, lütfen bir adım geri çekilip önceki videomuzu izleyin - "Pine'de Düşünmek - var, varip ve normal değişkenler"🎲 ÖzetBir fonksiyon kapsamında var kullanımı ve birden fazla çağrıyla nasıl davrandığı. Döngü içinde var değişken tanımları içeren fonksiyonları kullanma.🎯 Kullanılan Örnek Program Pine Script®🎲 Referanslar Pine Script® Kullanıcı Kılavuzu - Değişken bildirimleri Pine Script® Referans Kılavuzu - var
Trendoscope
Thinking in Pine - Time Series Special Cases
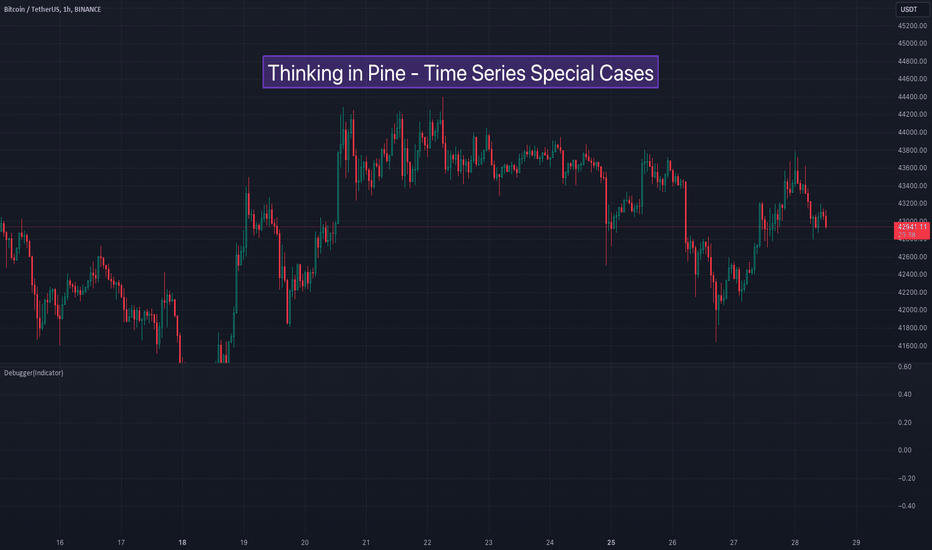
Herkese merhaba, "Pine'da Düşünmek" kısa video serisine hoş geldiniz. Bu oturumda, zaman serisi değişkenlerinin birkaç özel durumunu ve yerel kapsamda tarihsel operatör kullanımını ele aldık. Önceki videomuzu izlemediyseniz - "Pine'da Düşünmek - Zaman Serisi", request bu videoya devam etmeden önce bunu yapmanızı öneririz. 🎲 Bugünkü tartışmamızın özeti Tarihsel operatör, koşullu bir blok içinde tanımlanan değişkenler için nasıl çalışır Tarihsel operatör, bir döngüde tanımlanan değişkenler için nasıl çalışır. 🎯 Kullanılan Örnek Program Pine Script® 🎲 Referanslar: Pine Script® Kullanıcı Kılavuzu - Yürütme Modeli Pine Script® Kullanıcı Kılavuzu - Zaman Serisi Pine Script® Kullanıcı Kılavuzu - Geçmişe Başvuru Operatörü Pine Script® Referans Kılavuzu - Geçmişe Başvuru Operatörü
Sorumluluk Reddi
Sahmeto'nun web sitesinde ve resmi iletişim kanallarında yer alan herhangi bir içerik ve materyal, kişisel görüşlerin ve analizlerin bir derlemesidir ve bağlayıcı değildir. Borsa ve kripto para piyasasına alım, satım, giriş veya çıkış için herhangi bir tavsiye oluşturmazlar. Ayrıca, web sitesinde ve kanallarda yer alan tüm haberler ve analizler, yalnızca resmi ve gayri resmi yerli ve yabancı kaynaklardan yeniden yayınlanan bilgilerdir ve söz konusu içeriğin kullanıcılarının materyallerin orijinalliğini ve doğruluğunu takip etmekten ve sağlamaktan sorumlu olduğu açıktır. Bu nedenle, sorumluluk reddedilirken, sermaye piyasası ve kripto para piyasasındaki herhangi bir karar verme, eylem ve olası kar ve zarar sorumluluğunun yatırımcıya ait olduğu beyan edilir.