
TradeYourLogic
@t_TradeYourLogic

Ne tavsiye etmek istersiniz?
önceki makale
پیام های تریدر
filtre
TradeYourLogic
WAVES/USDT

Finansal tavsiye değil, lütfen kendi araştırmanızı yapın1D zaman dilimiAlım bölgeleri - 1,50$ - 1,54$Zarar durdurma - 1,48$(daha düşük dipler/trend değişikliği yapmaya başlarsak)Hedefler: - 1,67$- 1,85$1. hedef civarında kapalı pozisyon. Tekrar satın alma olasılığını arayacağımKâr +6%
TradeYourLogic
KDA/USDT

-- Not a financial advice, please, do your own research -- Finally, we are observing break out of our downward resistance(Falling Wedge, reversal pattern) with some significant volume and multiple RSI divergences. As for now, we need to await and see, how 1W candle gets closed(we still might end up with the fake break out). I have DCAed at different price levels: 0.77$, 0.52$ and hold it for long term If you have missed some recent KDA news and why I personally believe in project: - ledger support - increase of daily transactions volume(which signifies adoption) - constant technical developmentNeed to wait and check how 1W candle gets closed, however as for now, most probably, 0.3$ is incoming invalidation, if 1W gets closed above 0.52$4H time frame, we have a Falling Wedge pattern. If we break it out upward, then we can potentially see 0.51$ area, which at the same time will form Double Bottom pattern with the target around 0.6$As for now, Falling Wedge is in play on 4H timeframe and we also have a Double Bottom on 1D timeframe, in order to proceed, we need to break 0.51-0.53$ resistance area and retest it after P.S. I hold KDA for long term, as it is like ETH in 2015(not a financial advice, DYOR)3D timeframe, Double Bottom with the target 0.66-0.7$, if we break it and reach out target zone, then we can expect a re-test of our demand zone around 0.55$ and we should hold it in order to continue to growWaiting for 1W candle to get closed. As for now, price is 0.518$, per 12H timeframe I can observe some accumulation. Not a financial advise but there might be a pump soon up to 0.7$(daily 200MA zone)Short Update: if we break our 0.5$ support zone, we can dive to our support area at around 0.45$ P.S. I am holding it long term and I am accumulating, not sellingPrice dropped with significant volume probably due to the hacker, who stole it from CoinEx P.S. I keep holding and accumulatingBasically we are currently in our Triangle pattern and at our local support zone(0.48$). It will be amusing if we pump from here after this fuel(massive sell orders)As for now. in order to proceed with our uptrend we need to break and stay above 0.51$, otherwise we can go to 0.45$If we can't hold 0.47$ support, then we can drop to at least 0.45$. Additionally, if BTC decides to get dropped, we might see 0.3$ on KDA P.S as I mentioned before, I hold long term, only accumulate(solid tech project, decent team)Short update: As long as we hold 0.45-0.46$ level - we are fine(accumulation). As soon as we break and retest 0.54$ level - we can potentially visit 0.7$Please, like and subscribe as it motivates me to post more ideasSometimes simple "waiting" is the complexest thing. Patiently waiting until we break and successfully retest 0.54$Short Update: If we are not able to restore 0.475$ price level soon and afterwards break 0.54$ resistence within this week, then most probably we will drop to 0.36$ levelWe are BULLISHShort update: We are in a symmetrical triangle now(curr price is 0.512$), if we break 0.53$, then we can see KDA growing to 0.6$. P.S I am still holding long term and daily transaction volume is increasing(253k now), which signals adoption and continuous developmentAfter breaking out of symmetrical triangle we went to 0.59 - 0.60$ area, where our 200MA on 1D timeframe lays. As for now, we can see some correction, especially if BTC drops(I am not selling). If we break 200MA on daily timeframe(0.601$), then we can expect a movement up to 0.75$, which corresponds to the 100MA on 3D timeframeCrucial moment, we either break 0.6$(1D 200MA), gather liquidity and grow to 0.7$ or the price gets correctedShort update, for now I would expect a movement to 0.7$ and correction after(up to around 0.5$), especially if BTC gets corrected. If this scenario plays out, then we can potentially form Inverted Head and Shoulder with the potential up to 0.9$. Not a financial adviseAs I mentioned before, we have reached 0.7$, if you check 3D timeframe, you will notice we are kind of overbought( I am not selling!!! ), therefore, I am expecting some correction to happen soon. Additionally, if you open 1W timeframe you will observe tremendous buy volume, which is an extremely decent sign for upcoming future.Correction is in play as was mentioned above. We can see a drop to the 0.53$ level and bounce after, which will form our right shoulder in Inverse H&S pattern with the first target of 0.9$Short update: We might be forming our right shoulder, let's observe how our 3D candle gets closed, price now is 0.614$. If we get closed above 0.67$ we will have a BULLISH engulfing. In general, the local target I am waiting is 0.8$(our local H&S patter's target)Binance and CZ fud and correction after. As for KDA, 3D timeframe, we have inverted hammer candle(price is 0.58$). let's await and check the following 3D candle, whether we are forming a Right Shoulder now, if so, then we can see our 0.8$ target in the nearest time. Also be cautious(I am not selling!!!), because BTC has several bearish RSI divergences, so potentially it can drop in price, which will trigger market correctionShort Update: Once we break 0.69$ area with successful retest, our target will be 0.85-0.9$ P.S if you follow my IDEA, I would really appreciate if you LIKE it or SUBSCRIBEAnother Short Update: On KDA we've reached 0.74$, it is almost 2D 200MA. What are my expectations now? If you check USDT.D 1D chart you will see that we are kind of oversold now and we have a bullish divergence. For those who are not aware, when USDT.D chart drops in value - CRYPTO market grow, if USDT.D rises, then CRYPTO falls. As easy as it is. BTC chart, we are currently overbought, especially after the news that MicroStrategu bought another chunk of BTC supply. Additionally, we have open GAPs on BTC CME Futures chart, on 39,500$ and around 20,000$ !!! As for now, it makes sense if the market cools a bit down. therefore if you made some gains, do not forget to fix it. There is no trade in history who went bankrupt after taking his profits. Always keep it in mind and "don't marry your bags"I sold 40k+ of KDA and I will be waiting for BTC correction, not a financial advive and I might be wrong about selling, time will tell.Guess, I was right when I decided to sell. As for now, I am waiting for BTC correction, in long term BTC will grow, otherwise, why would MicroStrategy buy BTC, right? I will update this post, once I re-enter t\he marketI have rebought at 0.635$, expecting a move up to 0.96$Short update: I sold again at 0.72$ and I am expecting the market to correct soon, therefore I will stay outside for a while, not a financial advice.I have just re-bought at 0.7$ area and waiting BTC to retest 45k$Sold again at 0.72$, waiting for a correction after we could not break our 43.5k$ resistanceCongratulations to all who holded and manage to earn. I will publish a new post after the market correction.
TradeYourLogic
KDA/USDT pair

Şimdilik aşağı yönlü kanalda hareket ediyoruz, şu anda 0,35$ fiyat alanına doğru bir düşüş daha ve ardından yukarı yönlü bir kırılma bekliyorum. 0,7$'daki direnci kırmayı başarırsak ve R/S'yi çevirirsek geçersiz sayılacak.
TradeYourLogic
KDA/USDT

Finansal tavsiye değil, bir şey satın almadan önce her zaman kendi araştırmanızı yapın Yeni grafiğim ve KADENA için yeni vizyonum, en azından şimdilik 3D mumun önce nasıl kapanacağını görmek için bekliyorum, şimdilik BOĞA engulfing ile kapanıyor ve bu da boğa devamlılığımızı sağlayacak Ne yazık ki BOĞA engulfing ile kapanmadık, haftalık bir mum kapanışını bekleyeceğim Kısa güncelleme, günlük mum boğa engulfing ile kapanıyor, bu nedenle biraz yukarı yönlü hareket bekleyebiliriz, ayrıca haftalık mumu da bekliyorum, şimdilik tüm piyasa büyüyor, bu nedenle KDA yakında 1,5-1,6$ seviyesine dokunabilir BTC'in 27-28k seviyesine ulaşmasını ve ardından bir düzeltme yapmasını bekliyorum Her zamanki gibi, finansal tavsiye değil, lütfen kendi araştırmanızı yapın Hala 1W mumunun kapanmasını bekliyorum, 1,35$'ın üzerinde veya bu alanın bir yerinde kapanmayı başarırsak, haftalık mum önceki iki haftalık düzeltme mumunu yutacak ve bu son derece boğa işareti ve daha fazla yaklaşan hareketleri bekleyebiliriz3D grafik, şu anda yükselen üçgen örüntüsünün içindeyiz, yükseliş trendi çizgimizin (1,08$) üzerinde kaldığımız sürece - iyiyiz ve 100MA'mıza (1,4$) katılabiliriz, eğer 1,08$'ın altına kapanmayı başarırsak, buna göre 1$ ve 0,9$'ı da ziyaret edebilirizYerel desteğimizi kırdık, 1D zaman dilimi potansiyel Baş ve Omuzlar örüntüsü, boynu (1$'daki destek) kırarsak, TA'ya dayalı potansiyel hedefimiz 0,7$ civarında olacakŞimdilik her şey BTC'ye bağlıBTC 3D zaman diliminde Potansiyel Ters Baş ve Omuzlar 31-32k civarında hedefle, RSI aşırı satım alanındaBTC 19kUSDC.D ve USDT.D'nin altında kapanırsa geçersiz kılınır, RSI aşırı alım alanındaUmarım düşüşü satın almışsınızdırKısa güncelleme:Hala Haftalık mumun kapanmasını bekliyorum, BTC düşmezse, o zaman yerel direnç alanımıza doğru KDA'da bir yükseliş eğilimi göreceğiz Ayrıca KA3 madencilerinin serbest bırakılması nedeniyle madencilik zorluğu artıyor ve bu da sonunda günlük KDA üretimini azaltmalı, bu da Talep > Arz'a neden olabilir ve bu da fiyat artışına yol açabilir Son zamanlarda günlük üretim KDA'in yaklaşık 60.000'iydi ve şimdilik yaklaşık 45.000'e düştü KDA (Henüz %100 değil, hala iç istatistiklerim için bilgi topluyorum) Lütfen günlük üretim azalmasıyla ilgili önceki bilgileri dikkate almayın, yanılmışım BTC'de bir miktar toparlanmadan sonra, yaklaşık 25k alanında bir düzeltme beklerdim ve aynı zamanda BTC.D bazı AYI sapmaları yapıyor, bu da ALT'lerin potansiyel olarak büyümeye başlayabileceği anlamına geliyor KDA'ya gelince, 0,9$ alanını kaybedersek daha düşük dipler yapmaya başlayacağız, bu da AYI eğiliminin devamı anlamına geliyor, yine de sadece projenin nasıl geliştirildiğini gözlemleyerek uzun vadede tutuyorum Dürüst olmak gerekirse, KDA altında 1$ bir hediyedir ancak bunların hiçbiri finansal tavsiye değildir. Kısa bir güncelleme: yeni bir şey olmadı, sadece tutmaya devam edin. Şimdilik BTC'nin büyümesi ve USDT.D'nin aşağı doğru hareket etmesinden sonra ALT'lerin yükseldiğini görebiliyoruz. Bunun böyle devam etmesini bekliyorum ancak bence BTC gerçekten 32k alanını kırmayacak. KDA'ya gelince, 1,40$'a gitmeyi düşünebilmek için günlük zaman diliminde 1,10$'ın üzerinde kapanmamız gerekiyor. Sabır her zaman işe yarar.
TradeYourLogic
KDA/USDT

Finansal tavsiye değil4 saatlik zaman diliminde potansiyel Ters Baş ve Omuzlar deseniAşağı yönlü direnç çizgisini kırmayı başarırsak ve bunu başarılı bir şekilde tekrar test edersek, 1,2$ - 1,4$ başlangıç fiyat oranlarıyla gelecekte 2-3$ alanına büyümeye devam edebilirizBana gelince, KDA değerini yerinde tutacağım ve KADENA ekibinin bizi nereye götüreceğini bekleyeceğim, 2023 yılı umut vericiKısa bir yükselişin ardından fiyat düzeldi ve şimdilik, bence, 4 saatlik ve üzeri zaman diliminde 1,25$ civarında hedefle bir Kupa ve Kulp deseni varBunların hiçbiri finansal tavsiye değil, araştırmanız var mıŞimdilik, 1$ destek alanında sıkıştık, eğer kırarsak ve 0,97$ alanının altına düşersek, büyük olasılıkla 0,85$ seviyesinin tekrar ziyaret edilmesini bekleyebiliriz, gözlemleyelim4 saatlik zaman diliminde daha düşük bir düşük ve daha düşük bir yüksek bastık, bu iyi bir işaret değil ancak CPI data yayınlanmadan önce bir piyasa manipülasyonu olabilir, sabırla bekleyelimKısa güncelleme: yukarı doğru hareket etmeyi başarır ve 1,03$'ın üzerinde kalırsak, o zaman 1,2$ - 1,3$'a doğru yukarı yönlü hareketi sürdürmek için bazı iyi şanslarımız varHenüz yeni bir grafik yayınlamak istemiyorum, ancak daha fazla bilgi içerdiği için COINEX'teki KDA grafiğini kontrol ettim ve 3$'da ATH ile düşen bir kama yukarı doğru kırmış gibi görünüyor, bu nedenle şimdilik önümüzdeki aylar içinde buna ulaşabilirizYine de, hala Kupa ve Kulp modelimizi yukarı doğru kırmamız gerekiyorFinansal bir tavsiye değil4H zaman dilimi iyi görünmüyor, KDA ve tüm piyasa BTC'yi takip ediyorYükseliş trendinden önce BTC'te son bir dip kapitülasyonu görebilirizŞimdilik, büyük olasılıkla destek bölgemizi 0,85$'da yeniden test edeceğiz veya daha aşağıya düşeceğiz, hatta 0,5$ bile mümkün, bekleyelim ve görelimAyrıca BTC 16450$'ı korursa bir ayı tuzağına düşebilirizKupa ve Kulp geçersiz kılındı, ancak sonunda 1D zaman diliminde 1. hedef 1,35$ ve 2. hedef 1,7$ civarında olacak şekilde Çift Dip oluşuyor. Bunun gerçekleşip gerçekleşmeyeceğini bekleyelim. Henüz %100 emin değiliz ancak aşağı yönlü direnç çizgimizi kırmak üzere olabiliriz, 3$ potansiyeli olan büyük Düşen Kama paterni ve yerel olarak 1D zaman diliminde Çift Dip oluşumumuzu oluşturabilir ve kırabiliriz. Hala aşağı yönlü direnci kıramadık, BTC daha düşük dipler yaparsa 0,85$ veya daha düşük seviyeleri ziyaret edebiliriz. Şimdilik BTC 16500$ altına düşmezse 1D zaman diliminde ilk hedef 1,3$ olacak şekilde Çift Dip oluşturmak için makul şansımız var. Ayrıca 1W zaman diliminde Boğa Ayrışması var ve 0,91$+ seviyesinin üzerinde kapatmayı başarırsak 1W'de Boğa Yutma mumu da olacak ki bu son derece iyi bir işaret. 1W Boğa Yutma mumu, yakında 1,07$ bekliyorum, finansal tavsiye değil. finansal tavsiye, şimdilik BTC trendini takip ediyoruz ve BTC aşırı alım yapılıyor, USDC.D ve USDT.D grafikte aşırı satım yapılıyor, bu da yakında bir düzeltmeyle karşılaşabileceğimizin sinyalini veriyor, karı kilitlemeyi unutmayın Finansal tavsiye değil BTC CME vadeli işlemlerinde açık bir BOŞLUK var ve onu yakında kapatma olasılığımız yüksek, ayrıca USDT.D ve USDC.D'ye göre (her ikisi de RSI'ye göre aşırı satım yapılmış) potansiyel yerel düzeltme gösteriyor Umarım biraz kar elde ettiniz ve daha düşük bir seviyeden tekrar satın aldınız, CME BTC boşluğu henüz dolmadı, daha yükseğe tırmanmadan önce bunun dolmasını bekliyorum Finansal tavsiye değil Yanılıyor olabilirim ama karı kilitlemek için KDA paketimi 1,31$'dan sattım, şu anda USDC.D'ye göre destek bölgesinde olduğumuz için düzeltmeyi bekleyeceğim Ayrıca CME'de doldurulmamış 2 boşluk var Bu nedenle yaklaşık 1,18$ seviyesinden tekrar satın almaya çalışacağım Finansal tavsiye değil Karar verdim 1,28$ civarından yeniden satın alın ve tutun, 1M grafikte 1M mum çubuğunda MFI (para flow endeksi) başına potansiyel bir boğa yutma ve derin aşırı satış var Finansal bir tavsiye değil 3D mum çubuğu kapanana kadar bekliyorum, şimdilik üst fitil ile kapanıyor, bu da satıcıların şimdilik kontrolü ele geçirdiği anlamına geliyor ve bu noktada daha fazla ilerlemeden önce bir miktar düzeltme bekliyorum Günlük zaman diliminde 200MA olan 1,35$'ın üzerinde kapanmamız gerekiyor, bunu yaparsak bir yükseliş trendi yaşayacağız. BTC için orta vadede 30k görmeyi bekliyorum 1,7$ bir sonraki olabilir ancak henüz doğrulanmadı, haftalık mum kapanana kadar beklemem gerekiyor Ayrıca grafikle birlikte yeni bir vizyon yayınlayacağım
TradeYourLogic
KDA/USDT

Başarılı bir yeniden testle bu aşağı yönlü direnç çizgisini kırmayı başarırsak, 1,5$, 2$ ve hatta 3$'u (BTC'a bağlı) görmeyi bekliyorum. Şimdilik fiyatın 12H 200 MA'mıza eşit olan 1,55$ seviyesine ulaşmasını bekliyorum ve biraz geri çekilmeden sonra 12H 100MA'nın üzerinde kalıyoruz, bu iyi bir işaret, yine de en azından 200MA'ya (1,5$) dokunacağımızı bekliyorum. Sadece bir öneri, ancak yukarı çıkmadan önce önce 0,9$ seviyesine ulaşabiliriz. Piyasa manipülasyonu... Umarım satmamışsınızdır.
TradeYourLogic
KDA/USDT

1D zaman diliminde potansiyel ters Baş&Omuzlar, ayrıca 1H zaman diliminde yükseliş yönlü RSI ayrışmasıBTC fiyatı 25l+ seviyesine geri dönerse, ayrıca CME borsasında 28k ve 35k seviyelerinde kapatılmamış boşluklarımız olduğunu unutmayın, bu nedenle KDA fiyatının BTC'yi takip etmesini ve potansiyel olarak 3$ veya 4$ seviyesine ulaşmasını bekleyebilirim Ayrıca 2. KDA kohortunun veya gelecekteki projelerin duyurulmasını bekliyorum, genel olarak Kadena uzun vadeli bir yatırımdır, harika bir ekibimiz var, bu nedenle KDA'in parlak bir geleceği olduğuna içtenlikle inanıyorum Hazırlıklı ve sabırlı olun, BTC düşmeye devam ederse, 1,2$ seviyesine ve hatta daha da altına ulaşabiliriz ancak unutmayın, satın almak için en iyi zaman herkesin korktuğu ve her şeyin düştüğü zamandır, temelde ucuz varlıklar satın alırsınız, özellikle de KDA gibi umut verici bir projeye atıfta bulunduğunda
TradeYourLogic
KDA/USDT Cup&Handle?

Burada fiyatı tersine çevirip sonunda 2,7$ oranında sonlanacak bir Kupa ve Kulp deseni oluşturabilir miyiz? Henüz %100 emin değilim ama daha önce de belirttiğim gibi uzun vadede gerçekten KDA'a inanıyorum ve girişimi DCA'lıyorum. ECO sistemimizi ve DEFI TVL'mizi genişlettiğimizde fiyat büyük ölçüde yükselecek, kesinlikle uzun vadede tutmaya değer. Ne yazık ki direncimizi kırdık, 1,4$ seviyesini tutabilir miyiz diye kontrol edelim. DCA'lıyorum ve uzun vadede tutuyorum. 1D zaman diliminde ters H&S deseni oluşturabilir miyiz?
TradeYourLogic
KDA/USDT

Finansal bir tavsiye değil KDA ile ilgili küçük bir araştırma yaptım ve dürüst olmak gerekirse bunun muazzam bir potansiyeli olduğuna inanıyorum (EGLD, Harmony, Solana fiyat zirvelerinden önce benzer), bu nedenle DCA yapmaya karar verdim. Gördüğünüz gibi şu anda RSI'ye göre aşırı alım bölgesinde, bu nedenle düzeltme gerçekleşecek ancak haftalık mumunu kontrol ederseniz boğa yutması göreceksiniz. Olağanüstü bir şey olursa bu gönderiyi güncelleyeceğim. Umarım makul kazançlar elde etmeyi başardınız, düzeltmeyi unutmayın, ayrıca RSI'ye ve USDT'ye göre oldukça aşırı alım bölgesinde olduğumuzu unutmayın. D grafiğinde potansiyel düzeltme geliyor olabilir. Daha önce de söylediğim gibi, düzeltme devrede, DCA yapmaya ve uzun vadede tutmaya devam edin. 2 - 2,2$ seviyesini korursak ve 12 saatlik zaman diliminde 50MA'nın 200MA'yı geçtiğini görürsek başka bir yükseliş dalgası görmeyi bekliyorum.
TradeYourLogic
CLV/USDT
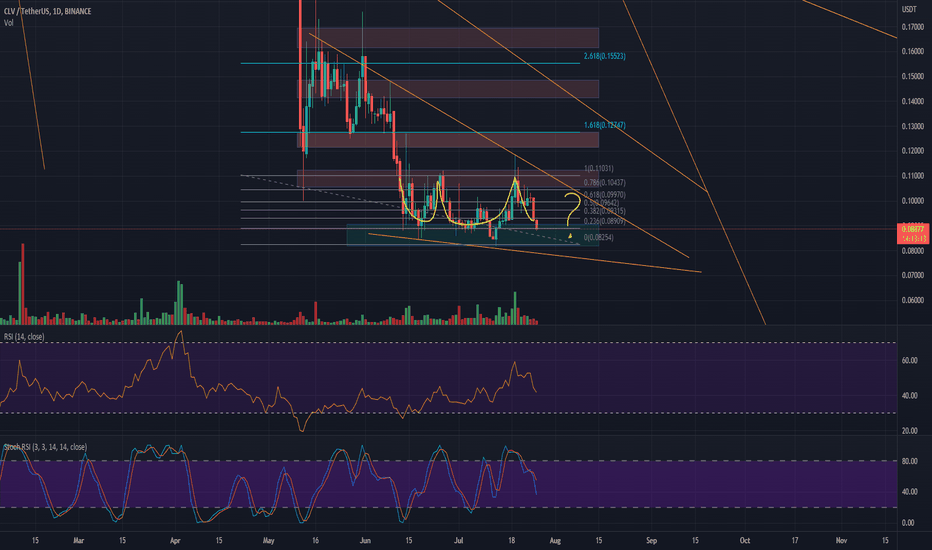
Talep bölgemizde destek bulursak 1D zaman diliminde olası Üçlü DipGrafikteki hedeflerUSDT ve USDC hakimiyet grafiği nedeniyle, aşırı satım seviyesine ulaştığı için CLV pozisyonumu kapattım, BTC ve ALT'ler başına bir miktar düzeltme bekliyorum, bu nedenle gerçekleştiğinde yeni fikirler yayınlayacağımYerel pompalardan sonra CLV'yi yeniden satın aldığımı ve miktarını artırdığımı belirtmeyi unuttumŞimdilik 12H zaman diliminde 200MA'ya yaklaşıyoruz, bunu kırıp üzerinde kalmayı başarabileceğimizi görelimAyrıca 10 Ağustos'ta yeni enflasyon rakamları göreceğiz, bu nedenle piyasada biraz oynaklık bekliyorum, ayrıca USDT.D grafiğinde aşırı satım alanındayız, bu nedenle tersine dönüş gelebilir, bu nedenle uzun vadeli tutmuyorsanız (benim gibi) sıkı stop loss tutmanızı öneririmCLV ticaretini kapatmaya ve toplam piyasa düzeltmesini beklemeye karar verdim
Sorumluluk Reddi
Sahmeto'nun web sitesinde ve resmi iletişim kanallarında yer alan herhangi bir içerik ve materyal, kişisel görüşlerin ve analizlerin bir derlemesidir ve bağlayıcı değildir. Borsa ve kripto para piyasasına alım, satım, giriş veya çıkış için herhangi bir tavsiye oluşturmazlar. Ayrıca, web sitesinde ve kanallarda yer alan tüm haberler ve analizler, yalnızca resmi ve gayri resmi yerli ve yabancı kaynaklardan yeniden yayınlanan bilgilerdir ve söz konusu içeriğin kullanıcılarının materyallerin orijinalliğini ve doğruluğunu takip etmekten ve sağlamaktan sorumlu olduğu açıktır. Bu nedenle, sorumluluk reddedilirken, sermaye piyasası ve kripto para piyasasındaki herhangi bir karar verme, eylem ve olası kar ve zarar sorumluluğunun yatırımcıya ait olduğu beyan edilir.