Pepperstone
@t_Pepperstone

Ne tavsiye etmek istersiniz?
önceki makale
پیام های تریدر
filtre
Pepperstone
پیناسکنر تریدینگویو: اسکن قدرتمند برای یافتن بهترین فرصتهای معاملاتی
TradingView'in PineScreener işlevselliğini uygulamaya koyduk ve özel taramalar içindeki göstergeleri doğrudan yatırımcıya yüzey hareketini, volatiliteyi ve momentumu tanımladık. İyi bir şekilde tarayan kurulumları parçalara ayırıyoruz ve bunların en etkili şekilde nasıl alınıp satılabileceğini araştırıyoruz. Bir göz atın…
Pepperstone
بیت کوین در کف ترس؛ آیا قیمت هم به همین اندازه سقوط کرده است؟
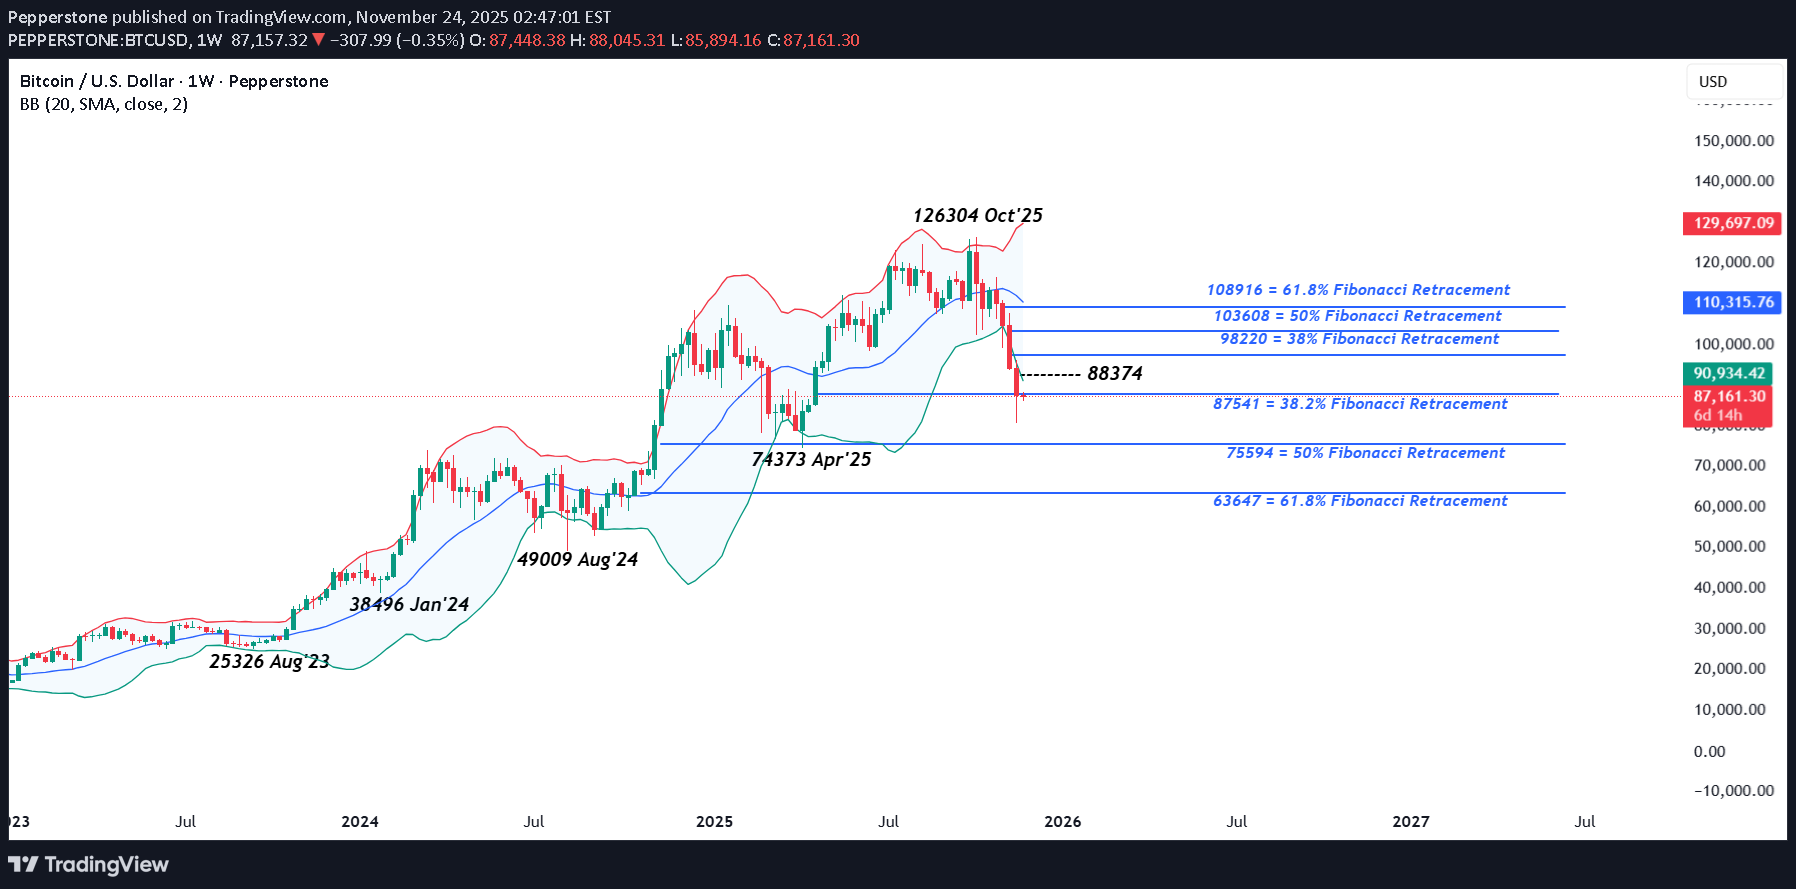
Bitcoin Cuma günü 80498'e geriledi; bu, Nisan ayının sonundan bu yana en düşük işlemi ve Kasım ayının başındaki 110.000 civarındaki açılış seviyesinden %27'lik bir düşüş. Ancak olumsuzluk yalnızca Bitcoin ile sınırlı kalmadı, kripto para piyasası aynı dönemde 1 trilyon dolardan fazla değer kaybetti; bu move, CoinMarketCap'in korku ve açgözlülük endeksini 100 üzerinden 10'luk bir okumayla aşırı korku bölgesine gönderdi. move'nin ne kadar hızlı gerçekleştiği göz önüne alındığında bu belki de şaşırtıcı değil. Piyasa gözlemcileri büyük düşüşün tek bir nedenini göstermekte zorlandılar ancak bu, 2025'te güçlü kazançlar sağlayan çeşitli varlık sınıflarındaki popüler kaldıraçlı işlemlerde kar elde edilmesiyle bağlantılı olabilir. Örneğin, Ekim ayında Altın 4381 gibi rekor bir yükseklikten %11 düşerek 3886'ya düştü ve AI alanında, Kasım ayında Palantir Technologies %33 düşüşle 221,75'ten 147,50'ye geriledi. Bitcoin'in ana akıma geçişi de önemli olabilir. Kurumsal yatırımcılar, riskten kaçınma dönemlerinde düşük performans gösteren pozisyonları kesmekten korkmuyor ve Kasım ayında Bitcoin borsa yatırım fonlarından (ETF'ler) milyarlarca doların çekildiği kaydedildi. Yatırımcıların aynı anda dışarı çıkma telaşı likiditeyi azaltabilir ve hamleleri daha aşırı seviyelere taşıyabilir. Hafta sonu boyunca, geleneksel finans piyasalarından farklı olarak haftanın 7 günü 24 saati işlem gören Bitcoin fiyatları, Pazartesi sabahı erken saatlerde kısa vadeli işlemlerde 86.000 seviyesinin üzerinde istikrar kazandı. Şimdi soru şu: 'Sırada ne olacak?' Buna cevap vermek için yatırımcılar Bitcoin için bir sonraki yön hareketlerini gösterebilecek potansiyel olarak önemli seviyeleri belirlemek üzere grafiklere bakıyor olabilir. Teknik Güncelleme: Odaktaki Geri Çekilme Destek Seviyeleri: Düşüş mü yoksa Tutma mı? Bitcoin, Ekim ayındaki tüm zamanların en yüksek seviyesi olan 126304'ten %36 düşerek fiyatta keskin bir düzeltmeye işaret etti. Tarihsel olarak bu tür dalgalanmalar kripto piyasalarında tipiktir ve Yatırımcılar şu anda bu düşüşün daha da uzun süre devam edip edemeyeceğini veya yakın geçmişte olduğu gibi fiyatlardaki toparlanma öncesinde geçici bir geri çekilme olup olmadığını değerlendiriyor olabilir. Yukarıdaki grafiğin de gösterdiği gibi, Bitcoin boğalar için bir endişe, %38,2 Fibonacci geri çekilmesi olan 87541 desteğinin kapanış bazında kırılması olabilir. Normalde bu seviyenin düşüşleri sınırlandırması, hatta yükselişin yeniden başlamasını teşvik etmesi beklenebilir, ancak mevcut riskler, geçen hafta bunun yapılmamasının daha fazla zayıflık potansiyeline yol açabileceği yönünde. Olası Destek Seviyeleri: %38,2 Fibonacci geri çekilme desteğinin altındaki bir kapanış, daha fazla aşağı yönlü hareket için bir fırsat olarak görülebilir. Bunun önümüzdeki hafta Bitcoin için doğru olup olmadığı belirsizliğini koruyor ancak 87541'in altındaki kırılma, daha düşük destek seviyelerinin test edilmesi olasılığını artırıyor. Bu gerçekleşirse yatırımcılar dikkatlerini Nisan 2025'in en düşük seviyesi olan 74373 ile bağlantılı olan 75594'teki %50 Fibonacci geri çekilmesine çevirebilir. Bu seviyelerin altında kapanış kırılmaları meydana gelirse, aşağı yönlü potansiyel daha derin %62'lik geri çekilmeye işaret eden 63647'ye doğru uzayabilir. Potansiyel Direnç Seviyeleri: Böylesine keskin bir düşüşün ardından, aşırı uzayan koşulların giderilmesine yardımcı olmak için kısa vadeli bir toparlanma mümkün. Ancak bunun daha sürdürülebilir bir toparlanmaya dönüşmesi için 88374 seviyesinin (geçen haftaki aralığın yarısı) üzerinde kapanışlar gerekli olabilir. Doğrudan olumlu bir sinyal olmasa da 88374'ün üzerindeki kapanışlar, Ekim/Kasım düşüşlerinin %38'lik geri çekilmesine eşit bir seviye olan 98220'nin test edilmesine yol açabilir. 98220'nin üzerinde kapanış kırılmaları elde edilirse, bu da %50 geri çekilme seviyesi olan 103608'e doğru daha fazla güçlenmenin yolunu açabilir. Burada sağlanan materyal, yatırım araştırmasının bağımsızlığını teşvik etmek amacıyla tasarlanmış yasal gerekliliklere uygun olarak hazırlanmamıştır ve bu nedenle bir pazarlama iletişimi olarak değerlendirilmektedir. Yatırım araştırmasının yayılmasından önce işlem yapma konusunda herhangi bir yasağa tabi olmasa da, bunu müşterilerimize sunmadan önce herhangi bir avantaj elde etmeye çalışmayacağız. Pepperstone burada sağlanan materyalin doğru, güncel veya eksiksiz olduğunu beyan etmez ve bu nedenle bunlara bu şekilde güvenilmemelidir. Üçüncü bir taraftan gelsin ya da gelmesin bilgiler tavsiye olarak değerlendirilmemelidir; veya satın alma veya satma teklifi; veya herhangi bir menkul kıymetin, finansal ürünün veya enstrümanın satın alınması veya satılması için teklifte bulunulması; veya herhangi bir belirli ticaret stratejisine katılmak. Okuyucuların mali durumu veya yatırım hedefleri dikkate alınmaz. Bu içeriğin okuyucularına kendi tavsiyelerini almalarını tavsiye ederiz. Pepperstone'un onayı olmadan bu bilgilerin çoğaltılmasına veya yeniden dağıtılmasına izin verilmez.
Pepperstone
وضعیت سهام انویدیا قبل از گزارش درآمد: اصلاح جزئی یا تغییر کامل بازار؟
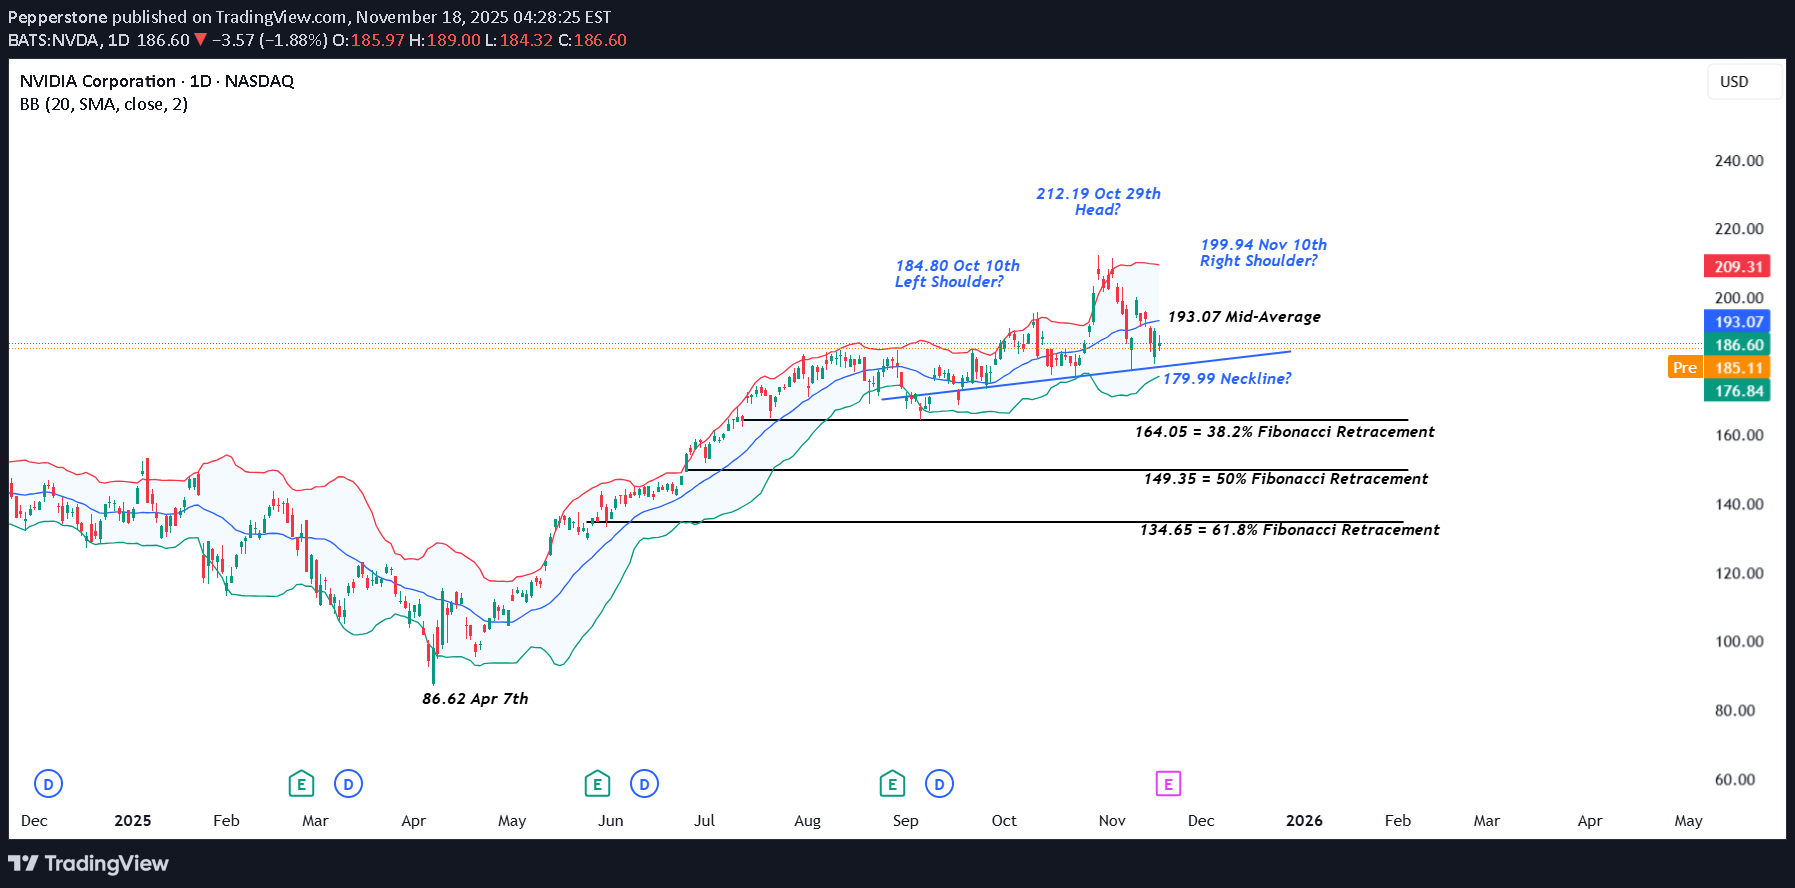
There is no getting away from it, NVIDIA’s earnings, which are due on Wednesday after the close are making traders nervous. The problem with being the largest company in the world by market capitalisation (approx.$4.53 trillion) with a roughly 7.5% weighting in the S&P 500 and closer to 10% weighting in the Nasdaq 100 is that everything related to your company matters, especially when you are seen as the global AI benchmark at a time when traders are wondering if lofty valuations given to the leading companies in the space are justified or not. Suddenly, stories like Softbank selling its entire NVIDIA stake of $5.8 billion last week, gets more headline space in the financial press and now your Q3 earnings are potentially being seen as important to the direction of market sentiment and risk appetite as whether the Federal Reserve decides to cut interest rates again at its final meeting of the year on December 10th. The earnings, when they are released are anticipated to be strong, with Reuters reporting analysts expecting an average 54% year on year rise on Q3 earnings per share. However, while traders may be judging the actual results against market expectations, they may also be keen to hear the updates from CEO Jensen Huang regarding future revenue and chips sales moving forward. With the potential for extra volatility in NVIDIA’s share price across the next 48 hours being apprised of the technical backdrop could be important. Technical Update: Limited Correction or Sentiment Shift? It has been a choppy period for the Nvidia share price since mid-September 2025, activity that has seen 3 distinct highs in price posted. As the chart below shows, these stand at 184.80 on October 10th, 212.19 from October 29th and 199.94, scored on November 10th. As you can also see on the chart, the 2nd of these 3 peaks at 212.19, is higher than the other 2, which is important from a technical perspective. This may lead some analysts to suggest this activity could be forming a potential Head and Shoulders top pattern. It is important to stress that a Head and Shoulders pattern must be completed by a close below the ‘neckline’ or the trend connecting recent price lows, which in the case of Nvidia currently stands at 179.99. Even then, completion of such a pattern isn’t a guarantee of a sentiment shift, but as we approach Nvidia earnings on Wednesday, risks may turn towards increased price volatility, and being aware of potentially relevant support and resistance levels may prove useful. [bWhat if Closes Below 179.99 Support are Seen?: Having seen recent price weakness held and reversed to the upside by the uptrend currently standing at 179.99, this could now be viewed as the first support focus. However, with it also possibly being the neckline of a potential Head and Shoulders pattern, it may prove to be pivotal moving forward. While there is no guarantee closes that below the support at 179.99 may lead to a further phase of price weakness, it might skew risks towards continued declines. Focus may then turn towards 164.05, a level equal to the 38.2% retracement level of April to October strength, possibly even towards 149.35, which is the 50% retracement. What if 179.99 Support Remains Intact?: As already said, any Head and Shoulders pattern must see closes below neckline support to suggest a completion and risks for further price declines. For Nvidia the 179.99 support is still intact on a closing basis, and it could be argued this is not yet a valid reversal pattern. As such, while the 179.99 level holds, traders may view recent price declines as a limited correction within what could still be classed as an uptrend in price. However, if a further phase of price strength is to materialise, traders may require closes back above the still rising Bollinger mid-average currently at 193.07. Such moves if seen, could then lead to tests of 199.94 the November 10th high, even on towards 212.19, the October 29th extreme. The material provided here has not been prepared accordance with legal requirements designed to promote the independence of investment research and as such is considered to be a marketing communication. Whilst it is not subject to any prohibition on dealing ahead of the dissemination of investment research, we will not seek to take any advantage before providing it to our clients. Pepperstone doesn’t represent that the material provided here is accurate, current or complete, and therefore shouldn’t be relied upon as such. The information, whether from a third party or not, isn’t to be considered as a recommendation; or an offer to buy or sell; or the solicitation of an offer to buy or sell any security, financial product or instrument; or to participate in any particular trading strategy. It does not take into account readers’ financial situation or investment objectives. We advise any readers of this content to seek their own advice. Without the approval of Pepperstone, reproduction or redistribution of this information isn’t permitted.
Pepperstone
صعود انفجاری طلا: چرا آرامش سیاسی بازار آمریکا قیمتها را به اوج رساند؟
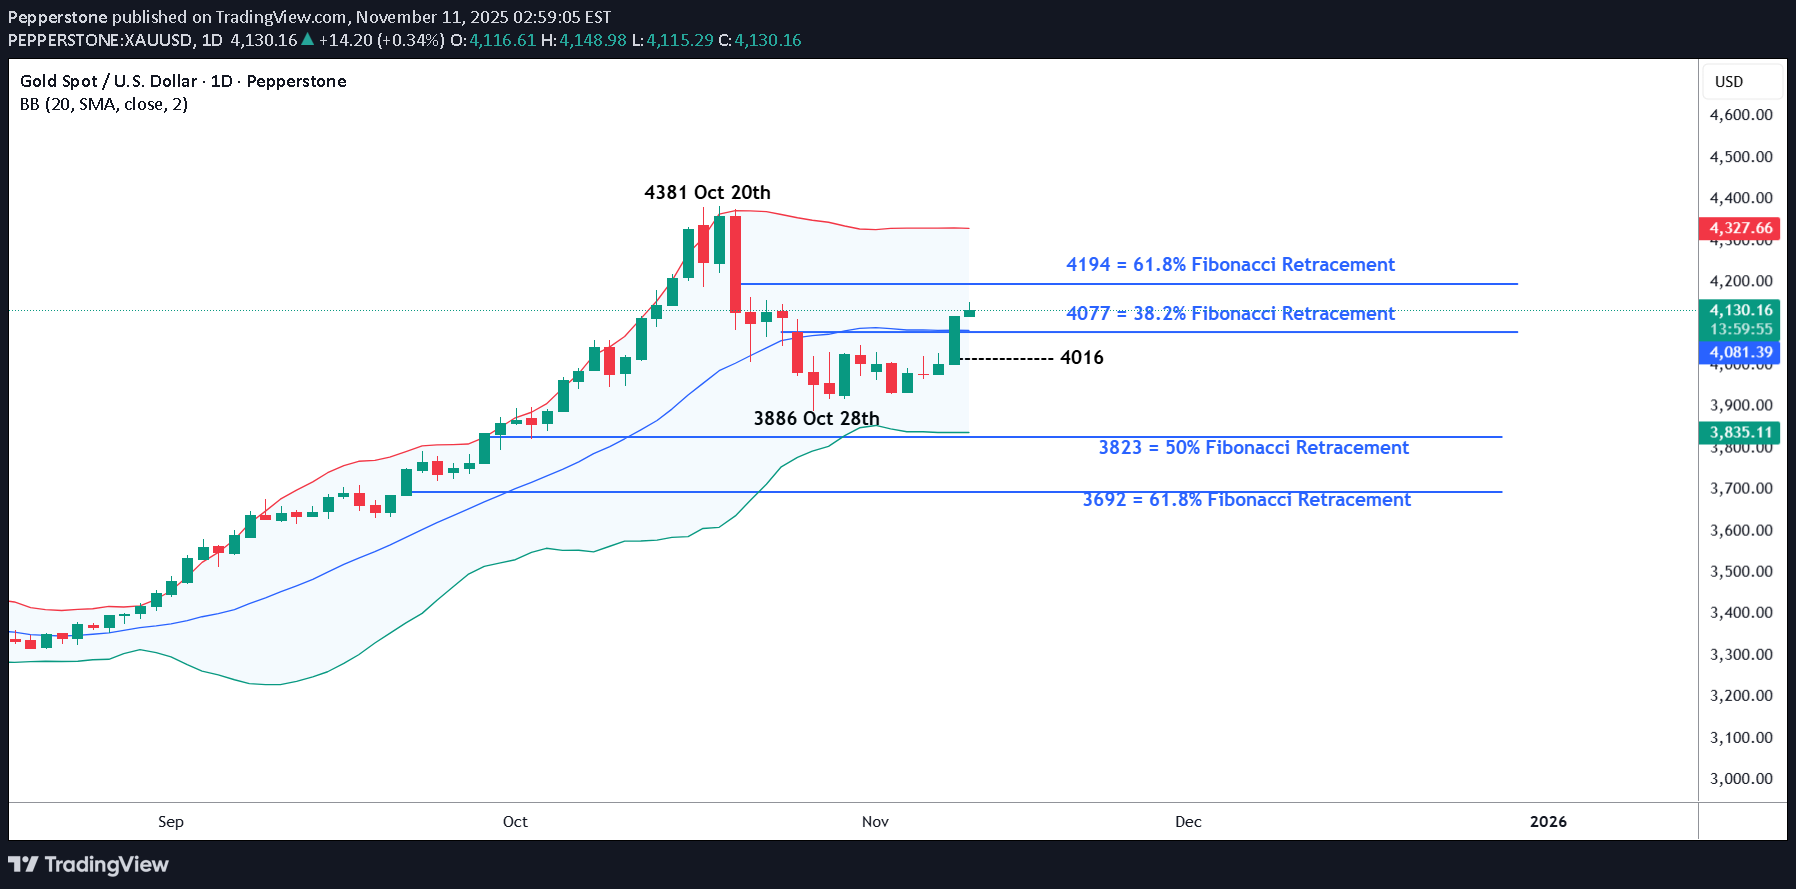
Demokrat ve Cumhuriyetçi milletvekilleri arasında ABD tarihindeki en uzun süren federal hükümet kapanmasına son verilmesi konusunda hafta sonu kaydedilen ilerlemenin, Altında Pazartesi günü 4000 civarındaki açılış seviyelerinden 2 haftanın en yüksek seviyesi olan 4116'ya kadar %2,6'lık bir artışa yol açtığını görmek ilginçti; bu move bu sabah 4149'a kadar yükseldi. Yatırımcılar move'in Federal Rezerv'in (Fed) mevcut faiz oranına getirebileceği potansiyel netliğe odaklanmayı seçtiler. Altın risklerini azaltmak yerine, ekonomik belirsizliğe ve uzun süren kapanmanın ABD ekonomisine yol açtığı potansiyel hasara karşı safe sığınağı olarak tutuluyorlar. ABD hükümetinin yeniden açılmasının, ABD işgücü piyasasının sağlığı ve enflasyonun yönü hakkında zamanında güncellemeler sağlayarak, Fed politika yapıcılarının 10 Aralık'ta yılın nihai faiz kararı öncesinde karar almalarını etkilemek üzere ekonomik durumu data flow düzeltebileceği umulmaktadır. Bu toplantıda 25 baz puanlık bir faiz indirimi daha yapılması ihtimalinin kabaca %65 olduğu mevcut piyasa fiyatlandırması, faiz getirmeyen bir varlık olarak altının move yükselişini desteklemeye yardımcı oldu. Kapatmanın sona erdirilmesine yönelik ilerleme, Senato'nun hükümetin büyük bölümünü Ocak ayı sonuna kadar ve bazı bakanlıkları Eylül ayı sonuna kadar açık tutacak bir harcama paketini onaylaması ile hızlanıyor gibi görünüyor. Tasarı şimdi imza için Başkan Trump'a gönderilmeden önce onay için Temsilciler Meclisi'ne gidiyor. Haftanın geri kalanında Altın fiyatlarına daha fazla dalgalanma katabilecek iki potansiyel engel. Teknik görünüm, dünkü kapanışın Ekim ayı fiyat düşüşünün %38,2'lik gerilemesi olan 4077 direncinin üzerinde gerçekleşmesinin ardından da etkili olabilir. Altın Teknik Güncellemesi: Yükselişin Yeniden Başlama İşaretleri mi? Fiyatın 28 Ekim'in en düşük seviyesi olan 3886'ya gerilemesinin ardından Altın, son seanslarda yatay konsolidasyonun hakim olduğu daha dengeli bir fiyat hareketi aşamasına girdi. Bu, tüccarların düşüşün normal seyrinde devam edip etmediğini veya fiyat zayıflığının devam edip etmeyeceğini değerlendirmeleri nedeniyle yön momentumunda bir duraklama olduğunu gösteriyor. Ancak hafta sonu potansiyel ABD hükümetinin yeniden açılacağı haberlerinin ardından Pazartesi günü yeni destek ortaya çıktı. Sonuç olarak, Altın 28 Ekim'in en düşük seviyesinden (3.886) %6,7'nin üzerinde bir artış göstererek son zamanlardaki zayıflıktan kayda değer bir toparlanmaya işaret ediyor. Yatırımcılar artık Pazartesi günü, Ekim ayındaki zayıflığın %38,2'lik Fibonacci geri çekilmesine eşit olan 4077 direncinin üzerindeki kapanış kırılmasına odaklanabilir. Fiyatların daha da güçleneceğinin garantisi olmasa da, bu move bir toparlanma aşamasına yol açabilir. Bu nedenle, bir sonraki yön verici temalara dair olası ipuçları için son fiyat hareketinden sonra destek ve direnç seviyelerini ölçmek faydalı olabilir. Potansiyel Direnç Seviyeleri: Gelecekteki fiyat hareketleri altının bir sonraki hamlesini belirleyecek olsa da, 4077 seviyesinin üzerindeki son kapanış fiyatta daha fazla artışa işaret edebilir. Bu, Ekim ayındaki düşüşün %61,8'lik yüksek geri çekilme seviyesi olan 4194'ün test edilmesi ihtimalini artırabilir. 4194'teki %61,8'lik geri çekilme seviyesi potansiyel olarak fiyat gücüne güçlü bir engel teşkil ediyor ve eğer test edilirse Altın burada daha sert bir dirençle karşılaşabilir. Ancak bu seviyenin üzerinde bir kapanış, 20 Ekim'deki en uç nokta olan 4381'e doğru daha derin yukarı yönlü hareketler için alan açabilir. Potansiyel Destek Seviyeleri: Dünkü yükseliş hareketinin hızından sonra yatırımcıların izleyebileceği ilk potansiyel destek 4016 olabilir; bu seviye, 3886 seviyesindeki (27 Ekim'in en düşük seviyesi) son yükselişin yarısına işaret ediyor. Bu seviyeye bir geri çekilme, son zamanlardaki güçlenmeye karşı rutin bir tepki olabilir ancak bu seviyenin altında kapanışlar, yeni bir aşağı yönlü baskının sinyali olabilir. Yenilenen zayıflığın kesin bir sinyali olmasa da, 4016'nın altındaki bir kapanış, 28 Ekim'in en düşük seviyesi olan 3886'yı ve hatta Ağustos'tan Ekim'e kadarki ilerlemenin %50 Fibonacci geri çekilmesine eşit bir seviye olan 3823'ü yeniden test etmek için kapıyı açabilir.
Pepperstone
شاخص US 500: آیا پایان تعطیلی دولت، اخبار خوب را تمام کرد؟
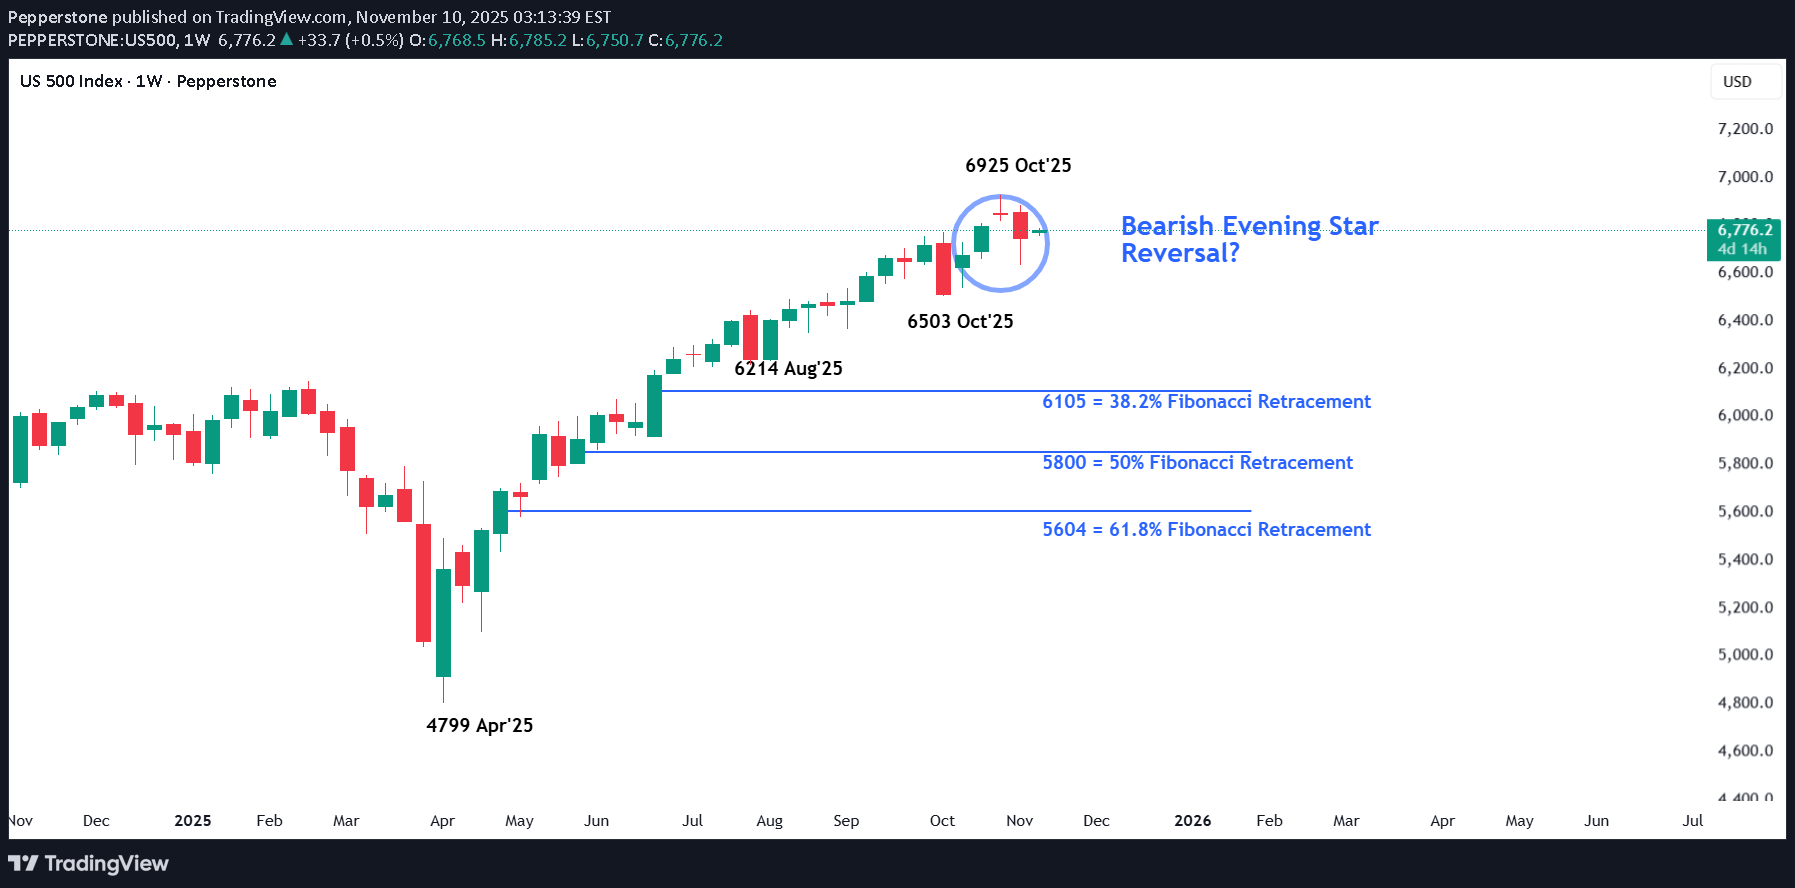
After a volatile and nervy 5 days for US stock indices the week ended on a slightly more stable and positive footing. In relation to the US 500 index this volatility saw it open on Monday November 3rd around 6885, trade down to a low of 6633 early on Friday November 7th, before rallying by over 1% late in the session to close the week at 6742. The driver for the rally was news that Democrats and Republican lawmakers had restarted negotiations to try and resolve what has become the longest US government shutdown in history. This shutdown has been reported by Bloomberg to be costing the US economy around $15 billion per week in lost productivity and has stopped the release of key US economic data readings, leaving Federal Reserve (Fed) policymakers in the dark regarding the health of the US labour market (Non-farm Payrolls) and the direction of inflation (CPI/PPI/PCE). Two areas which are crucial in helping them decide whether they have room, or the need to cut interest rates again at their next meeting in December. Perhaps unsurprisingly, after a jittery week where the lofty valuations of AI firms were called into question and weighed on the price of the US 500 index, traders may now be looking at whether a resolution to the shutdown, which would restart the economic data flow again ahead of the Fed’s next rate decision on December 10th could be possible, bringing with it a potentially much needed boost to flagging sentiment. On Sunday, traders received the news that the Senate had moved closer to an agreement, an update which has helped the US 500 to register an early gain of 0.5% (6790 at 0700 GMT) to start this new trading week. However, even if the agreed bill is eventually passed by the Senate, it must be approved by the House of Representatives and signed by President Trump (Reuters), meaning there could be more volatility ahead for the US 500. Technical Update: Conflicting Signals Within Weekly & Daily Perspectives Since the October 30th all-time high at 6925, the US 500 index has slipped just over 4.2%, reflecting an unwind of potentially over-extended upside conditions. Looking at the charts there appears to be conflicting technical signals between the weekly and daily perspectives at present, leaving the directional bias uncertain heading into the new week. Upcoming sessions could offer clarity on whether the constructive themes emerging on the daily chart or the possibly negative developments evident in the weekly view may take control. Weekly Chart – Potential Negative Outlook?: Over the past three weeks, a possible Evening Star pattern has emerged on the weekly chart, a potentially negative development. Last week’s price weakness may have completed a sentiment shift, and if downside momentum builds, it could lead to further declines in the sessions ahead. It remains to be seen whether this leads to further price weakness, but downside pressure may now build. If developed further, breaks below support at 6503, the October 2025 low could materialise, opening the door to a deeper phase of weakness toward 6214, a level equal to the August 2025 low, potentially even 6105, the 38.2% Fibonacci retracement of the April to October 2025 rally. Daily Chart – Potential Positive Sentiment Shift?: Following the recent sharp price decline, the daily chart presents a dilemma for traders, especially against the backdrop of a potentially negative weekly setup. Friday’s session initially extended recent downside moves but found support at 6647, the 38.2% Fibonacci retracement of the April to October rally. From there, fresh strength emerged, and the session closed near its opening level at the upper end of the day’s range. Candlestick analysis suggests a potentially positive Dragonfly Doji has formed, hinting at an attempt to resume price strength. Confirmation is key, a positive candle on Monday, seen with a close above todays 6769 opening level, would offer weight to this pattern. While not a guarantee of further upside, such activity might also see a close above resistance at 6779 (half the latest decline) a level at present being tested (0700 GMT), to potentially suggest a retest of 6925, the October 30th high. Initially it is unclear whether the weekly or daily outlook will gain the upper hand in the US 500 index, but next week’s price action, especially the moves on Monday, could be important. With the weekly chart hinting at a negative reversal risk and the daily chart showing signs of potential stabilisation, even possible positive risks, Monday’s candle direction may offer clues, and traders may be watching closely for evidence of the next directional themes. The material provided here has not been prepared accordance with legal requirements designed to promote the independence of investment research and as such is considered to be a marketing communication. Whilst it is not subject to any prohibition on dealing ahead of the dissemination of investment research, we will not seek to take any advantage before providing it to our clients. Pepperstone doesn’t represent that the material provided here is accurate, current or complete, and therefore shouldn’t be relied upon as such. The information, whether from a third party or not, isn’t to be considered as a recommendation; or an offer to buy or sell; or the solicitation of an offer to buy or sell any security, financial product or instrument; or to participate in any particular trading strategy. It does not take into account readers’ financial situation or investment objectives. We advise any readers of this content to seek their own advice. Without the approval of Pepperstone, reproduction or redistribution of this information isn’t permitted.
Pepperstone
بیت کوین در آستانه سقوط عمیقتر؟ تحلیل تکنیکال حمایتها و مقاومتها
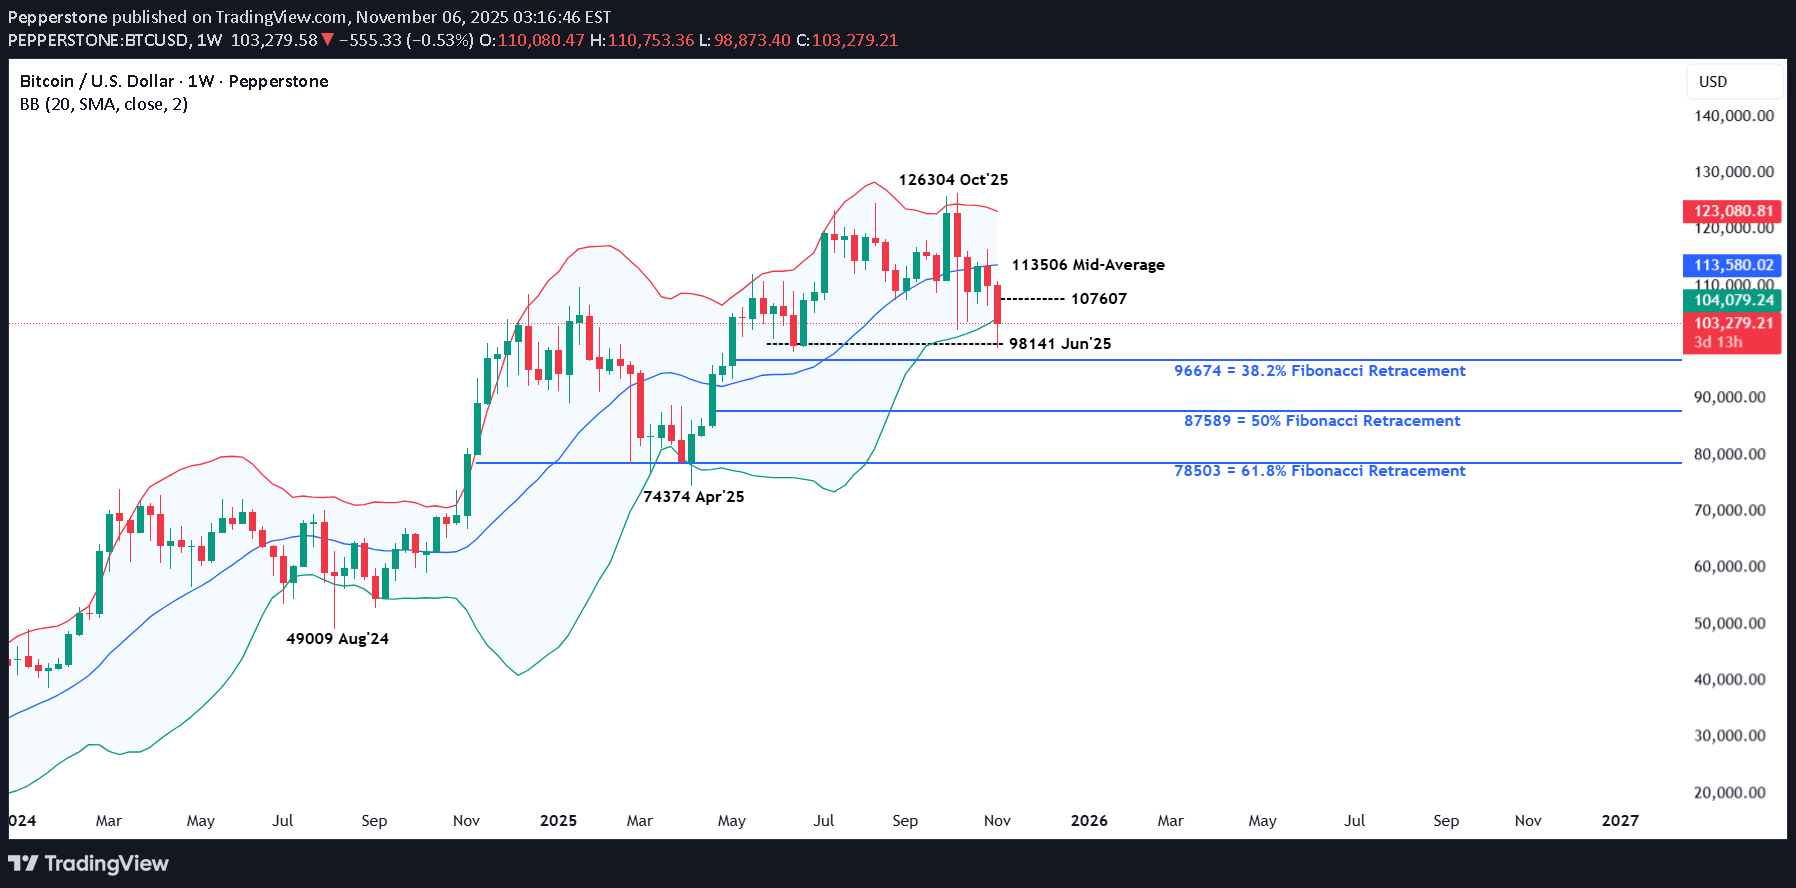
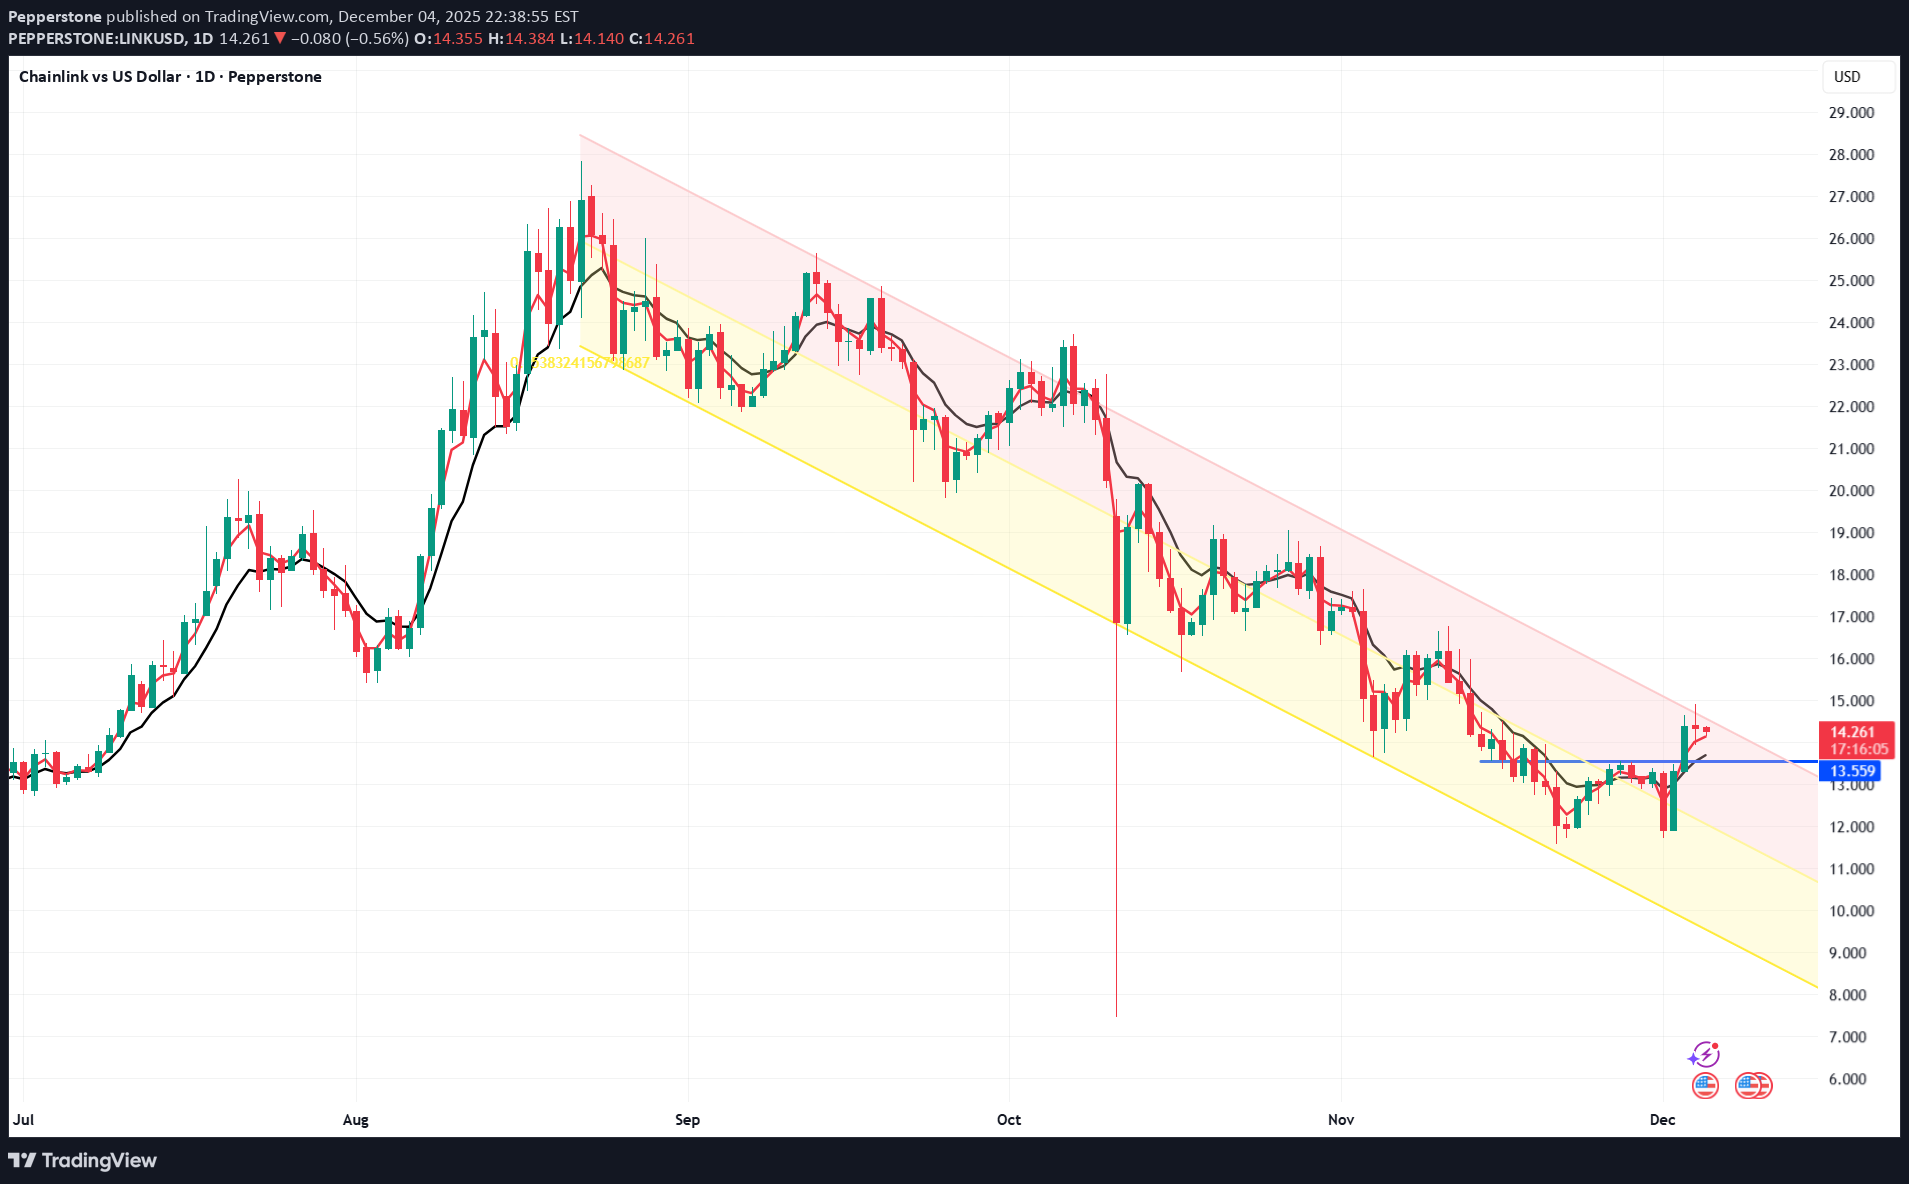
Bitcoin ve daha geniş anlamda kripto para piyasası, bu hafta finansal piyasalarda görülen riskten kaçınma eğilimine karşı bağışıklık kazanmadı; zira tüccarlar, çeşitli varlıklardaki yüksek değerlemelerin ve aşırı konumlandırmanın hala geçerli olup olmadığını veya bir ayarlama yapılması gerekip gerekmediğini yeniden değerlendiriyor. Fiyatlandırmanın bu yeniden değerlendirmesinde Bitcoin ticaretin 6 Ekim'deki 126000 üzerindeki en yüksek seviyesinden sadece dün en düşük 98873'e düştüğü görüldü; bu %21,7'lik bir düşüş anlamına geliyor. Tabii ki, dünyanın 1 numaralı kripto para birimi kısa vadeli dalgalanma dönemlerine yatkın olabilir, ancak bu sefer yatırımcıları endişelendiren şey, düşüşün nedenlerinin spekülatörlere veya aşırı kaldıraca değil, 6 aydan fazla uzun vadeli sahiplerinin pozisyonlarını tasfiye etmesine atfedilmesidir. Eğer doğruysa, bu durum, yeni alım ilgisi hızla piyasaya geri dönmediği sürece, mevcut en yüksek seviye olan 126304'ün uzun bir süre yerinde kalabileceği teorisine ağırlık kazandırabilir. Popüler bir varlıkta bu tür durumlar ortaya çıktığında, potansiyel bir yön değişikliğini destekleyip desteklemediklerini görmek için mevcut teknik eğilimleri kontrol etmek amacıyla move grafiklere geri dönmek genellikle yararlı olur. Bu ilk değerlendirme tamamlandıktan sonra, bir sonraki aşama potansiyel temel destek veya direnci belirlemeye çalışmaktır. Bunlar, daha fazla satış ilgisi tutmasına, alım ilgisini sınırlamasına veya daha büyük bir yönlü move'ün devrede olabileceğini göstermek üzere kapanış bazında kırılmasına bağlı olarak, Bitcoin'ün ilerlemesi üzerinde yönsel bir etkiye sahip olabilecek seviyelerdir. Aşağıda Bitcoin'in mevcut teknik değerlendirmesi yer almaktadır. Teknik Güncelleme: Bitcoin Yaz Kazanımlarını Siliyor Ekim ve Kasım başı, Bitcoin için şu ana kadar zorlu geçti; fiyatı, 6 Ekim'deki tüm zamanların en yüksek seviyesi olan 126304'ten dünkü en düşük seviye olan 98873'e %21,7 düştü. Bu düşüş, Haziran'ın en düşük seviyelerinden bu yana biriken fiyat gücünün %100'ünü etkili bir şekilde geri çekti ve yatırımcıların istikrar veya daha fazla fiyat zayıflığı işaretleri beklemesine neden olabilir. Bu hız ve büyüklükteki düzeltmeler kriptoda alışılmadık bir durum değil ve yatırımcılar artık son düşüşün uzun vadeli bir yükseliş trendi içindeki sınırlı bir geri çekilme mi yoksa daha geniş bir duyarlılık değişiminin erken bir işareti mi olduğunu tartacak. Belki teknik resim bir sonraki yön verici temalara dair ipuçları sunabilir… Olası Destek Seviyeleri: Pek çok şey gelecekteki fiyat trendlerinin nasıl gelişeceğine bağlı olmaya devam edecek ancak trader'lar artık son Bitcoin düşüşünü 96674/98141 seviyesindeki potansiyel destek bölgesine doğru bir düzeltme olarak görüyor olabilir. Bu alan, Ağustos 2024 ile Ekim 2025 arasındaki rallideki %38,2 Fibonacci geri çekilmesine ve Haziran 2025'teki aylık en düşük seviyeye eşit olup, potansiyel olarak istikrar işaretleri veya daha fazla aşağı yönlü risk için önemli bir odak noktası haline geliyor. Bu 96674/98141 desteği band şu anda kapanış bazında izlenebilir ve mevcut fiyat hareketinin olası bir pivotu olarak sınıflandırılabilir. Daha fazla fiyat zayıflığı garantisi olmasa da, 96674'ün altındaki kapanışlar, %50 geri çekilme olan 87589'a, hatta daha derin %61,8 seviyesine eşit olan 78503'e doğru daha derin bir geri çekilmenin mümkün olduğunu gösterebilir. Potansiyel Direnç Seviyeleri: 96674/98141 desteği band mevcut fiyat zayıflığını sınırlamaya devam ederken, özellikle son %21,7'lik düşüşün ardından reaktif bir toparlanmanın gerçekleşmesi mümkün. Yatırımcılar şu anda 27 Ekim ile 5 Kasım arasındaki zayıflığın %38,2 Fibonacci geri çekilmesine eşit olan 105585 seviyesine odaklanıyor olabilir. Test edilirse kapanışta bu seviyenin nasıl savunulduğu, fiyat gücünün daha da artacağına dair ipuçları verebilir. Önümüzdeki seanslarda 105585 seviyesinin üzerinde kapanış kırılmaları ortaya çıkarsa, bu durum daha yüksek seviyelere çıkma girişimlerini yenileyebilir. Bu tür hareketler görülürse, %50'lik geri çekilme olan 107607'ye, hatta %61,8'lik daha yüksek seviyeye eşit olan 109775'e kadar olasılıkları açabilir. Burada sağlanan materyal, yatırım araştırmasının bağımsızlığını teşvik etmek amacıyla tasarlanmış yasal gerekliliklere uygun olarak hazırlanmamıştır ve bu nedenle bir pazarlama iletişimi olarak değerlendirilmektedir. Yatırım araştırmasının yayılmasından önce işlem yapma konusunda herhangi bir yasağa tabi olmasa da, bunu müşterilerimize sunmadan önce herhangi bir avantaj elde etmeye çalışmayacağız. Pepperstone burada sağlanan materyalin doğru, güncel veya eksiksiz olduğunu beyan etmez ve bu nedenle bunlara bu şekilde güvenilmemelidir. Üçüncü bir taraftan gelsin ya da gelmesin bilgiler tavsiye olarak değerlendirilmemelidir; veya satın alma veya satma teklifi; veya herhangi bir menkul kıymetin, finansal ürünün veya enstrümanın satın alınması veya satılması için teklifte bulunulması; veya herhangi bir belirli ticaret stratejisine katılmak. Okuyucuların mali durumu veya yatırım hedefleri dikkate alınmaz. Bu içeriğin okuyucularına kendi tavsiyelerini almalarını tavsiye ederiz. Pepperstone'un onayı olmadan bu bilgilerin çoğaltılmasına veya yeniden dağıtılmasına izin verilmez.
Pepperstone
خبرهای خوب بازار سهام آمریکا تمام شده است؟ تحلیل US 500
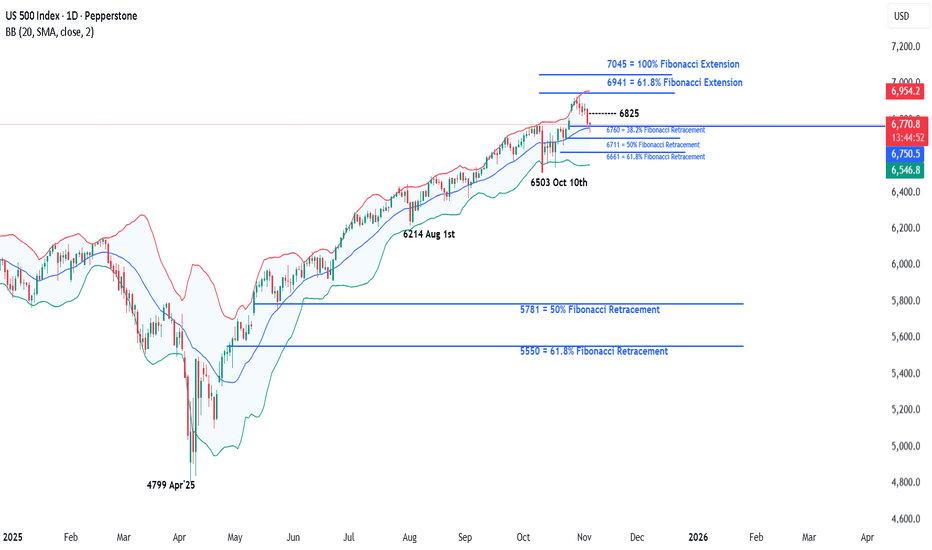
Concerns about excessive stock market valuations, especially when talking about AI focused companies, isn’t something new. In fact, it has been an on-going theme over the last 6 months of the year leading to bouts of risk aversion. This was again the case late on Monday evening, and throughout the day yesterday when the earnings of Palantir Technologies were in the spotlight. The strange thing was that the earnings from this company, released after the close on Monday, beat analysts’ expectations, however a lack of clarity on future revenue needed to justify a market capitalisation of over $600 billion was what brought the latest concerns of an AI bubble back to the attention of traders, leading to a negative sentiment shift for the wider sector and the US 500 index in general. Now, this may or may not be the start of a wider correction and much will depend on future risk events, price action and technical trends (more on this below), however the question for traders this time around is whether the positive news flow for US indices in the short term has already been priced? After all the US 500 index only hit a new record of 6925 on October 30th, 5 days ago. November and December are historically strong performance months for the US 500, however currently traders are faced with several issues to navigate. Only a week ago the Federal Reserve cast some doubt over whether a rate cut in December would happen or not, with policymakers maintaining this stance in their comments at various events since then. This wasn’t expected and has led to some disappointment for traders which weighed on US 500 sentiment. Q3 earnings have generally beaten expectations but then valuations were already high to reflect this, leading to some potential fatigue. Trade tensions between the US-China have cooled, but concerns still remain about economic growth in both countries, especially in the US, where a US government shutdown has led to the delay of key data releases such as CPI, retail sales and the all-important Non-farm Payrolls update on the current health of the US labour market, a key factor influencing the decision making of the Fed on potential interest rate cuts. This means the release of today’s US ADP Private Payrolls data at 1315 GMT and the US ISM Services PMI survey at 1500 GMT could have a bigger influence over the direction of the US 500 moving across the week. Technical levels and trends may also become increasingly important. Technical Update: Back to Fibonacci Retracement Support After reaching a new all-time high of 6925 on October 30th, the US 500 index has corrected by 2.9%, easing short-term overextended upside conditions. This pullback may reflect a healthy pause within a broader uptrend, but the question now appears to be whether this marks the extent of corrective downside moves or is the beginning of a phase of further price weakness. As the chart below shows, latest declines in the US 500 index have now returned to a potential support zone at 6750/6760, marking the 38.2% Fibonacci retracement of the October 10th to 30th rally and the current level of the Bollinger mid-average. This possible support band may limit current declines, but closing behaviour around this area could be important in determining whether buyers can regain the upper hand or if deeper corrective risks can emerge. Traders could now be watching this 6750/6760 support closely, as closing break below might see increased downside pressure. Such moves could then mean focus shifts to 6711, even 6661, marking the deeper 50% and 61.8% Fibonacci retracement levels. That said, while the support is currently under pressure, the 6750/6760 range still holds on a closing basis and may help limit further selling pressure, even possibly see renewed attempts at price upside. However, traders may also now be monitoring 6825, equal to half the recent price decline, as a resistance level in the sessions ahead. If momentum is to shift back toward attempts to renew price strength, a closing break above 6825 may be required to suggest scope to retest the 6925 October 30th all-time high. The material provided here has not been prepared accordance with legal requirements designed to promote the independence of investment research and as such is considered to be a marketing communication. Whilst it is not subject to any prohibition on dealing ahead of the dissemination of investment research, we will not seek to take any advantage before providing it to our clients. Pepperstone doesn’t represent that the material provided here is accurate, current or complete, and therefore shouldn’t be relied upon as such. The information, whether from a third party or not, isn’t to be considered as a recommendation; or an offer to buy or sell; or the solicitation of an offer to buy or sell any security, financial product or instrument; or to participate in any particular trading strategy. It does not take into account readers’ financial situation or investment objectives. We advise any readers of this content to seek their own advice. Without the approval of Pepperstone, reproduction or redistribution of this information isn’t permitted.
Pepperstone
طلا در آستانه ۴۰۰۰ دلار: مسیر بعدی صعود یا سقوط؟ (تحلیل تکنیکال)
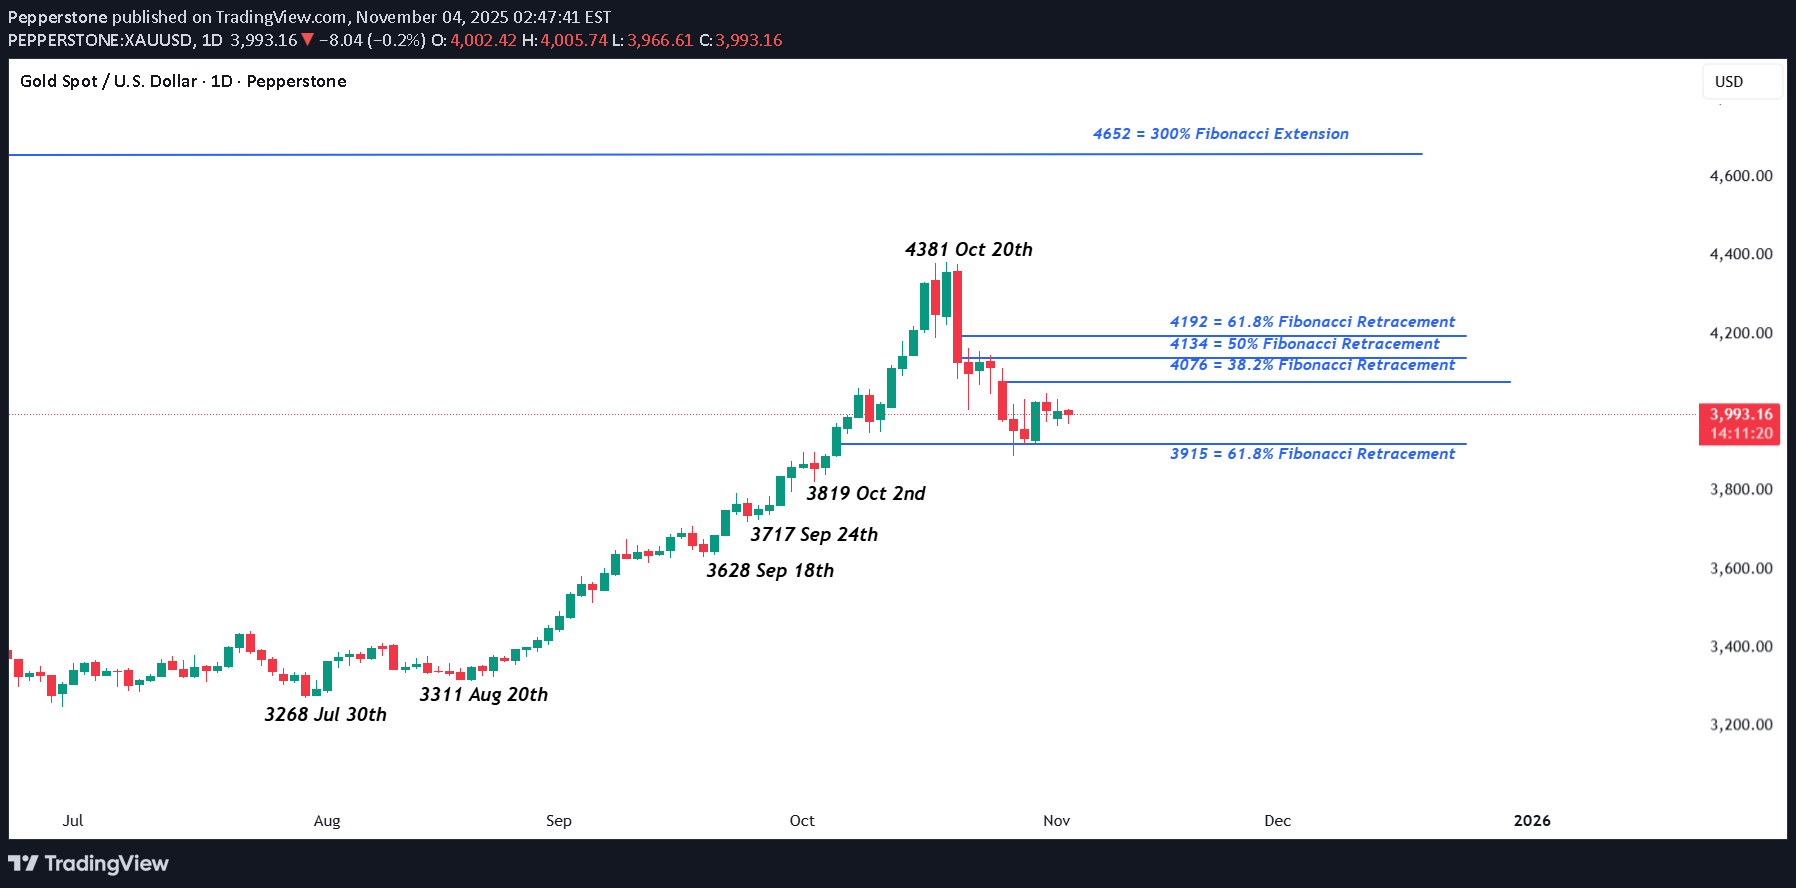
Altın fiyatları, 20 Ekim'de tüm zamanların en yüksek seviyesi olan 4381'den 28 Ekim'de 3887'ye kadar keskin bir düzeltmenin ardından istikrar kazanmış olabilir, ancak traderlar hala popüler metal'in 4000'in her iki yanında %3'lük bir aralıkta dans etmesine neden olan aşırı ve değişken move'ın izlerini taşıyor. Altın fiyatlarının bir sonraki aşamada move nerede olabileceğine karar vermek, Federal Reserve politikacılarının Aralık ayındaki bir sonraki toplantıda piyasanın daha fazla faiz indirimi beklentilerini soğutmaya çalışmasıyla daha da zorlaştı. Genel bir kural olarak, düşük faiz oranları, getirisi olmayan bir varlık olan Altın fiyatlarının desteklenmesine yardımcı olabilir. Sadece bu da değil, Fed'in değişen görünümü de ABD dolarının move son 3 ayın en yüksek seviyesine çıkmasına neden oldu ve bu durum, dolar cinsinden fiyatlanan safe liman varlığını küresel yatırımcılar için daha pahalı hale getirerek Altın fiyatları üzerinde daha da baskı oluşturdu. Bununla birlikte, Ukrayna'daki jeopolitik riskler, kredi riski ve küresel ekonomik büyümenin yönüne ilişkin belirsizlik gibi tüccarların portföylerine Altın eklemesini sağlayan etkenlerin çoğu varlığını sürdürüyor. Bu tür bir ortamda teknik görünüme dikkat etmek, makro risk değerlendirmesini sürdürmek kadar önemli olabilir. Teknik Güncelleme: 3915 Düzeltici Hareketlerin Kapsamını Belirtiyor mu? Altın, 20 Ekim'deki tüm zamanların en yüksek seviyesinden 28 Ekim Salı gününün en düşük seansına kadar %11,25'in üzerinde bir düzeltme yaparak, 20 Ağustos ile 20 Ekim arasındaki keskin fiyat yükselişi sırasında oluşan olası aşırı uzun vadeli yukarı yönlü koşulları ortadan kaldırdı. Yatırımcılar için şu anki temel ikilem, son zamanlardaki zayıflığın sağlıklı bir piyasa düzeltmesine mi işaret ettiği yoksa duyarlılıkta daha derin bir değişime mi işaret ettiğidir. Eğer birincisi ise, yenilenen satın alma ilgisini ve daha geniş bir yükseliş trendinin yeniden başladığını görebiliriz. Ancak eğer ikincisi ise, riskler fiyat zayıflamasının daha ileri bir aşamasına yol açabilir. Altın için bir sonraki yön verici tema belirsizliğini korurken, teknik analiz potansiyel ipuçları sunabilir. Yatırımcılar, temel destek ve direnç seviyelerini belirleyerek, özellikle bu seviyelerin kapanış bazında kırılması durumunda, yönlü risklerin nerede ortaya çıkabileceğini tahmin edebilir. Desteğin ihlali daha derin bir düzeltme riskine işaret edebilirken, direncin üzerinde bir kapanış pozitif ivmeyi sürdürebilir. Potansiyel Direnç Seviyeleri: Altının 20 Ekim'in en yüksek seviyesinden %11,25'lik düşüşü, 18 Eylül ile 20 Ekim arasındaki yükselişin %61,8 Fibonacci geri çekilmesi olan 3.915 seviyesinde destek bulmuş görünüyor. Fiyat hareketinin o zamandan beri bu seviye civarında istikrar kazanması, yukarı yönlü yeni girişimler için potansiyel olduğunu gösteriyor. Yatırımcılar artık odak noktalarını kilit direnç seviyelerine kaydırabilir ve bu seviyelerin üzerindeki kapanış kırılmaları, fiyatın daha da güçlendiğini göstermek için gerekli olabilir. 3915 geri çekilme desteğine ilişkin testlerin ardından yukarı yönlü gelişmeler yaşanırken, yatırımcılar artık Ekim fiyat zayıflığının %38,2 Fibonacci geri çekilmesi olan 4076 seviyesini izliyor olabilir. 4076'nın üzerindeki başarılı kapanış kırılmaları, %50 seviyesi olan 4134'ün, hatta %61,8'lik daha yüksek bir geri çekilme olan 4192'nin testleriyle sonuçlanabilir. Potansiyel Destek Seviyeleri: Yukarıda da belirtildiği gibi, fiyat zayıflığının son aşaması 3915 geri çekilme seviyelerinde devam ederken, tüccarlar muhtemelen bunu mümkün olan ilk destek olarak izleyecekler. Bu seviyenin altındaki kapanışlar fiyat düşüşlerinin devam etmesi için katalizör olabilir. Bu tür hamleler, fiyatta daha fazla zayıflama olacağının garantisi olmasa da, 2 Ekim seansının en düşük seviyesi olan 3819'un, hatta 24 Eylül'ün en düşük noktası olan 3717'nin testlerini başlatabilir. Burada sağlanan materyal, yatırım araştırmasının bağımsızlığını teşvik etmek amacıyla tasarlanmış yasal gerekliliklere uygun olarak hazırlanmamıştır ve bu nedenle bir pazarlama iletişimi olarak değerlendirilmektedir. Yatırım araştırmasının yayılmasından önce işlem yapma konusunda herhangi bir yasağa tabi olmasa da, bunu müşterilerimize sunmadan önce herhangi bir avantaj elde etmeye çalışmayacağız. Pepperstone burada sağlanan materyalin doğru, güncel veya eksiksiz olduğunu beyan etmez ve bu nedenle bunlara bu şekilde güvenilmemelidir. Üçüncü bir taraftan gelsin ya da gelmesin bilgiler tavsiye olarak değerlendirilmemelidir; veya satın alma veya satma teklifi; veya herhangi bir menkul kıymetin, finansal ürünün veya enstrümanın satın alınması veya satılması için teklifte bulunulması; veya herhangi bir belirli ticaret stratejisine katılmak. Okuyucuların mali durumu veya yatırım hedefleri dikkate alınmaz. Bu içeriğin okuyucularına kendi tavsiyelerini almalarını tavsiye ederiz. Pepperstone'un onayı olmadan bu bilgilerin çoğaltılmasına veya yeniden dağıtılmasına izin verilmez.
Pepperstone
انفجار ارزش انویدیا به ۵ تریلیون دلار: جهش تاریخی و مسیر بعدی سهام غول هوش مصنوعی
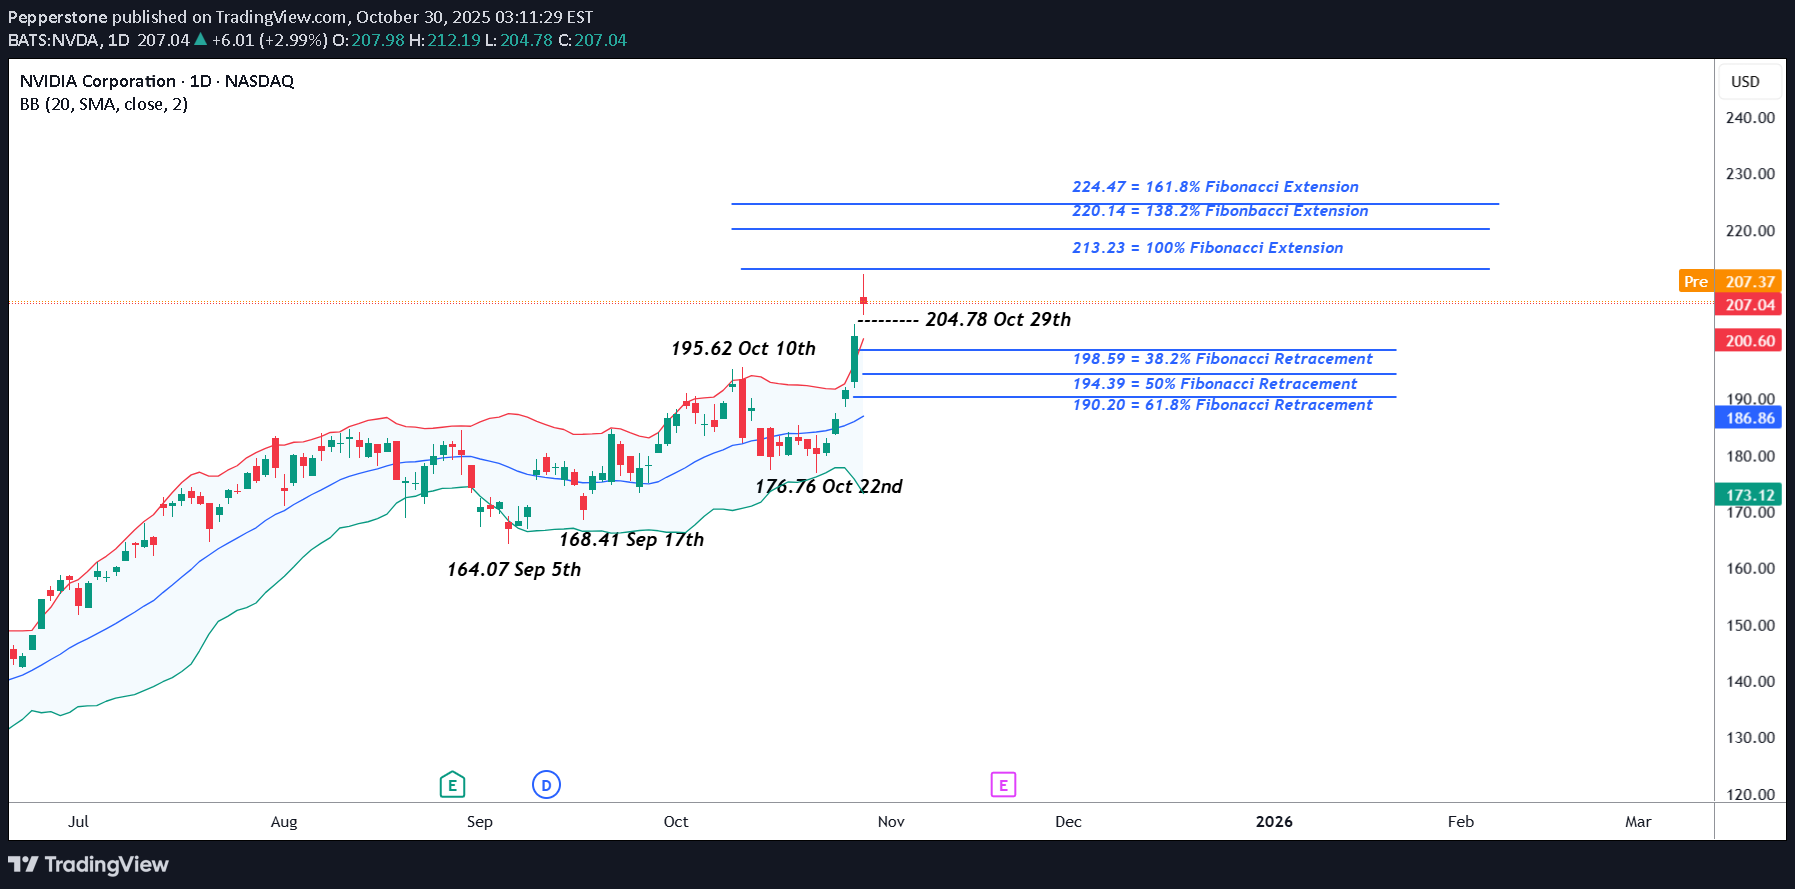
Apple'ın tarihte 4 trilyon dolarlık değerlemeye ulaşan üçüncü şirket olmasından yalnızca 24 saat sonra NVIDIA, 5 trilyon dolarlık piyasa değeri kaydeden ilk şirket olarak yeni bir referans noktası belirledi. Değerlemelerin aşırı uzatılmasına ilişkin endişelere rağmen, NVIDIA'nın flow haberi, şirketin geleceğini potansiyel AI devriminin merkezinde sağlamlaştırmaya çalıştığı bu yeni haftaya başlama konusunda başlangıçta olumluydu. CEO Jensen Huang, şirketin ABD hükümeti için süper bilgisayar üretmeye yönelik sözleşmeler de dahil olmak üzere 500 milyar dolarlık AI çip siparişi aldığını açıkladı ve ardından Başkan Trump Çarşamba günü yaptığı açıklamada, Perşembe günü Güney Kore'de yapılacak zirvede Başkan Xi ile buluştuğunda NVIDIA'nın en yeni Blackwell çiplerinin bir tartışma noktası olabileceğini söyledi. Rakamlarla ifade edersek, Pazartesi günü 189,25'te açıldıktan sonra hisse senedi ilk 3 işlem gününde %12 artışla Çarşamba günü 212,19'a yükseldi. Bu move, yılbaşından bugüne yükselişini %54'e çıkardı, gerçekten çok etkileyici! Ancak fiyatların geri çekilerek günü 207,04 seviyesinde kapattığını da söylemek gerekiyor. Ancak bir gecede olumlu hava biraz durmuş olabilir, Fed beklendiği gibi faiz oranlarını 25 baz puan düşürdü ancak Başkan Powell gelecekteki kesintilere ilişkin beklenenden daha temkinli bir görünüm sergiledi. Ayrıca Çarşamba günü geç saatlerde açıklanan Alphabet, Microsoft ve Meta'nın kazançları da karışıktı; güçlü karlar artan maliyetlerle dengelendi. İleriye baktığımızda, Başkan Trump ve Başkan Xi toplantısından gelen ilk güncellemeler haber kanallarına ulaşmaya başladı ve tüccarlar, iki ülke arasındaki NVIDIA yonga satışları hakkında tartışılanların gerçek ayrıntılarını değerlendirme konusunda istekli olacaklar. Önemli bir husus, NVIDIA'nın en son Blackwell çipinin satışının tartışılıp tartışılmadığı ve tartışılmadıysa bunun nedenleri neler olduğu olabilir. Ardından, bu geceki kapanıştan sonra Amazon ve Apple kazançlarının açıklanması bekleniyor; bu, ya son yükseliş hareketlerini doğrulayabilir ya da hafta sonu konumlandırmayı olumsuz yönde etkileyebilecek bir duyarlılık eğrisi oluşturabilir. Teknik Güncelleme: Daha Yüksek Hızlanma Odağı Uzatma Direncine Kaydırır Yalnızca altı işlem seansında NVIDIA'nın hisse fiyatı %20'nin üzerinde artış göstererek tüm zamanların en yüksek seviyelerine ulaştı. Bu kadar hızlı bir hızlanma genellikle güçlü bir momentumun sinyali olabilir ancak aynı zamanda kısa vadede yukarı yönlü tükenme riskini de artırır; ancak bu tür hareketlerin nerede yavaşlayabileceğini veya hatta olası geri dönüş risklerini görebildiğini belirlemek zordur. Bu ortamda tüccarlar destek ve direnç seviyelerini izleyebilir; direnç bölgeleri kar alma potansiyeline işaret ederken, desteğin altındaki kırılmalar fiyatların daha da zayıflamasına neden olabilir. [b Potansiyel Direnç Seviyeleri: Fiyat hareketi, tüm zamanların en yüksek seviyeleriyle keşfedilmemiş bölgelere doğru ilerlerken, direnci belirlemek bir zorluk haline geliyor. Ancak yatırımcılar, yukarı yönlü momentumun yavaşlayabileceği ve hatta tersine dönebileceği potansiyel alanları vurgulamak için sıklıkla en son düzeltmeden elde edilen Fibonacci uzatma seviyelerine yöneliyor. Yukarıdaki grafiğin gösterdiği gibi, NVIDIA için bu son düzeltme 10 Ekim ile 22 Ekim arasında gelişti ve son güç, kısa vadede %100 Fibonacci uzantısına eşit bir seviye olan 213,23'ün öncesinde duraklayacak gibi görünüyor. Bu tür uzatma seviyelerinin fiyat gücünü sınırlamada başarılı olacağının garantisi yok ve 213,23 direncinin üzerindeki kapanış kırılmaları, odağı %138,2'lik daha yüksek uzatma seviyesi olan 220,14'e kaydırabilir. Potansiyel Destek Seviyeleri: NVIDIA'nın mevcut fiyat gücünü korumak için yatırımcılar artık kısa vadeli destek olarak Çarşamba gününün en düşük seviyesi olan 204,78'e odaklanabilir; Fiyat zayıflığı bu seviyeyi test ederse savunması izlenecek, zira 204,78'in altındaki kapanış daha fazla aşağı yönlü baskıyı tetikleyebilir. 204,78'in altında bir kapanış, 22-29 Ekim rallinin %38,2'lik Fibonacci geri çekilmesi olan 198,59 testine yol açabilir, ancak bu destek bozulursa, riskler daha derin olan %50 geri çekilme seviyesi olan 194,39'a doğru uzayabilir. Burada sağlanan materyal, yatırım araştırmasının bağımsızlığını teşvik etmek amacıyla tasarlanmış yasal gerekliliklere uygun olarak hazırlanmamıştır ve bu nedenle bir pazarlama iletişimi olarak değerlendirilmektedir. Yatırım araştırmasının yayılmasından önce işlem yapma konusunda herhangi bir yasağa tabi olmasa da, bunu müşterilerimize sunmadan önce herhangi bir avantaj elde etmeye çalışmayacağız. Pepperstone burada sağlanan materyalin doğru, güncel veya eksiksiz olduğunu beyan etmez ve bu nedenle bunlara bu şekilde güvenilmemelidir. Üçüncü bir taraftan gelsin ya da gelmesin bilgiler tavsiye olarak değerlendirilmemelidir; veya satın alma veya satma teklifi; veya herhangi bir menkul kıymetin, finansal ürünün veya enstrümanın satın alınması veya satılması için teklifte bulunulması; veya herhangi bir belirli ticaret stratejisine katılmak. Okuyucuların mali durumu veya yatırım hedefleri dikkate alınmaz. Bu içeriğin okuyucularına kendi tavsiyelerini almalarını tavsiye ederiz. Pepperstone'un onayı olmadan bu bilgilerin çoğaltılmasına veya yeniden dağıtılmasına izin verilmez.
Pepperstone
نوسانات طلا تمام شد؟ تحلیل کلیدی حمایت و مقاومت برای هفته آینده
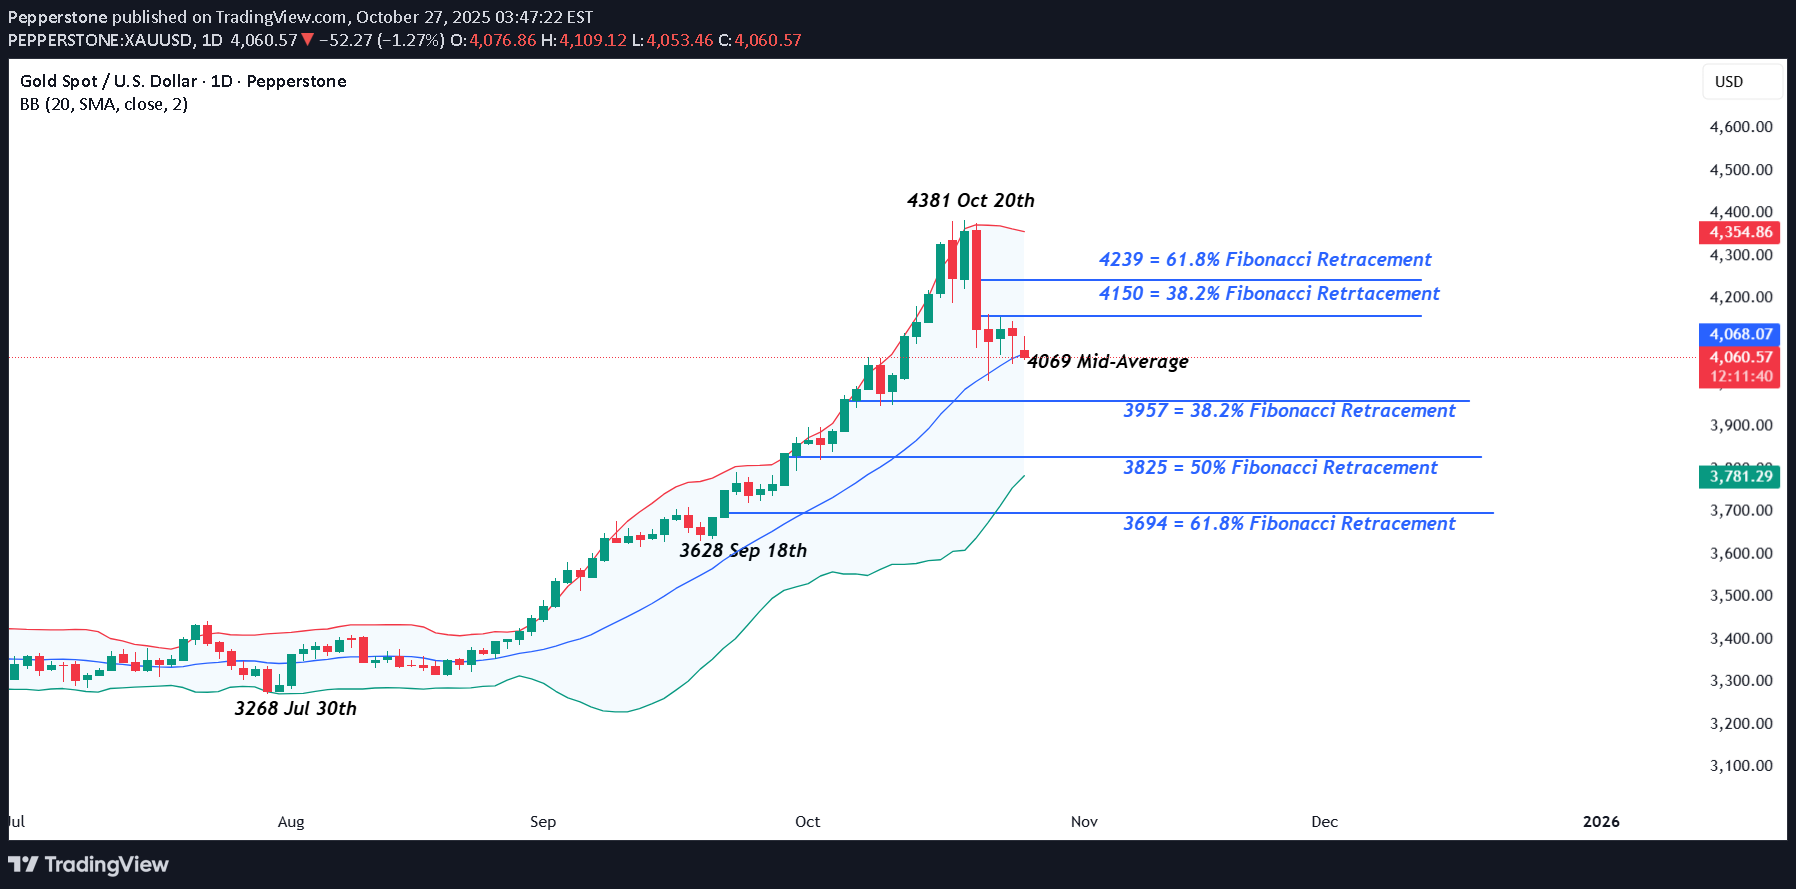
Gold volatility hit new heights last week when a push from opening levels at 4243 on Monday (Oct 20th) up to a new record high of 4381 was immediately followed on Tuesday (Oct 21st) by a crash back to lows at 4004 as traders were forced to liquidate weak long positions after key short term technical support levels gave way. If price moves last week were dominated by positioning, moves in the week ahead could be more events driven providing traders with a lot for to focus on and potentially further excessive volatility to navigate. Weekend news has so far provided positive soundbites on progress towards de-escalating trade tensions between the US and China. President Trump has stated he is confident of a deal after US and Chinese trade representatives concluded a 2-day meeting in Malaysia (Reuters), while US Treasury Secretary Scott Bessant commented that he believes the two negotiating teams have agreed on a successful framework for President Trump and President Xi to discuss when they meet on Thursday (Oct 30th), their first face to face meeting in 6 years. This has already led to a sell-off in Gold prices from Friday’s closing level at 4112 to a low of 4053 this morning. Geo-politics remains in focus as Ukrainian and Russian forces trade drone strikes in Ukraine, while a Kremlin spokesperson said it was too early to talk about the cancellation of a meeting between President’s Putin and Trump, despite the White House’s blacklisting of Russia’s main 2 oil producers, Rosneft and Lukoil last Wednesday complicating the issue. Also on Wednesday evening, the Federal Reserve announce their next interest rate decision at 1800 GMT, with the press conference led by Chairman Jerome Powell commencing at 1830 GMT. While a 25bps (0.25%) rate cut is expected from Fed policymakers, the press conference could be the main volatility driver for Gold prices, as Chairman Powell provides traders with an update on whether a further rate cut is likely in December as anticipated, or if an on-going US government shutdown, which has stopped key US economic growth and labour market data releases, has clouded the issue. Technical trends may also have a significant impact on where Gold moves next. Technical Update: Is the Bollinger Mid-Average Key? Gold’s sharp 8.60% sell-off from the October 20th all-time high at 4381 prompted speculation over a possible sentiment shift that could mean an end to the recent strong advance. However, the rising Bollinger mid-average has so far contained the decline as can be seen on the chart below. This rising Bollinger mid-average, currently at 4069, held the latest Gold decline, suggesting it might be a key support focus again this week. How the Gold price behaves around this level on a closing basis may offer clues to the next directional bias, either marking stabilisation or opening the risk of a deeper phase of weakness. If the Bollinger Mid-Average Holds Price Weakness: If the support at 4069 continues to hold on a closing basis, Gold may see renewed attempts at strength. Traders could then be focused on how potential resistance at 4150, which is the 38% Fibonacci retracement of the latest decline, is defended. While the mid-average support remains intact, a closing break above 4150, could lead to further upside possibilities, shifting focus to 4239, the 61.8% retracement of the recent decline, or even extending toward 4381 the October 20th all-time high again. If the Bollinger Mid-Average Support is Broken: While 4069 has so far contained Gold’s recent selling pressure, it may not hold indefinitely. A closing break below this level might raise the risk of a more extended phase of weakness, opening deeper corrective themes. Closes below 4069 in Gold could shift trader focus to 3957, which is the 38.2% Fibonacci retracement of the July 30th to October 20th rally. If this support gives way, downside risks may in turn extend toward 3825, a level which marks the deeper 50% retracement level. The material provided here has not been prepared accordance with legal requirements designed to promote the independence of investment research and as such is considered to be a marketing communication. Whilst it is not subject to any prohibition on dealing ahead of the dissemination of investment research, we will not seek to take any advantage before providing it to our clients. Pepperstone doesn’t represent that the material provided here is accurate, current or complete, and therefore shouldn’t be relied upon as such. The information, whether from a third party or not, isn’t to be considered as a recommendation; or an offer to buy or sell; or the solicitation of an offer to buy or sell any security, financial product or instrument; or to participate in any particular trading strategy. It does not take into account readers’ financial situation or investment objectives. We advise any readers of this content to seek their own advice. Without the approval of Pepperstone, reproduction or redistribution of this information isn’t permitted.
Sorumluluk Reddi
Sahmeto'nun web sitesinde ve resmi iletişim kanallarında yer alan herhangi bir içerik ve materyal, kişisel görüşlerin ve analizlerin bir derlemesidir ve bağlayıcı değildir. Borsa ve kripto para piyasasına alım, satım, giriş veya çıkış için herhangi bir tavsiye oluşturmazlar. Ayrıca, web sitesinde ve kanallarda yer alan tüm haberler ve analizler, yalnızca resmi ve gayri resmi yerli ve yabancı kaynaklardan yeniden yayınlanan bilgilerdir ve söz konusu içeriğin kullanıcılarının materyallerin orijinalliğini ve doğruluğunu takip etmekten ve sağlamaktan sorumlu olduğu açıktır. Bu nedenle, sorumluluk reddedilirken, sermaye piyasası ve kripto para piyasasındaki herhangi bir karar verme, eylem ve olası kar ve zarar sorumluluğunun yatırımcıya ait olduğu beyan edilir.