
PegasusTechCharts
@t_PegasusTechCharts

Ne tavsiye etmek istersiniz?
önceki makale
پیام های تریدر
filtre
sinyal türü
PegasusTechCharts
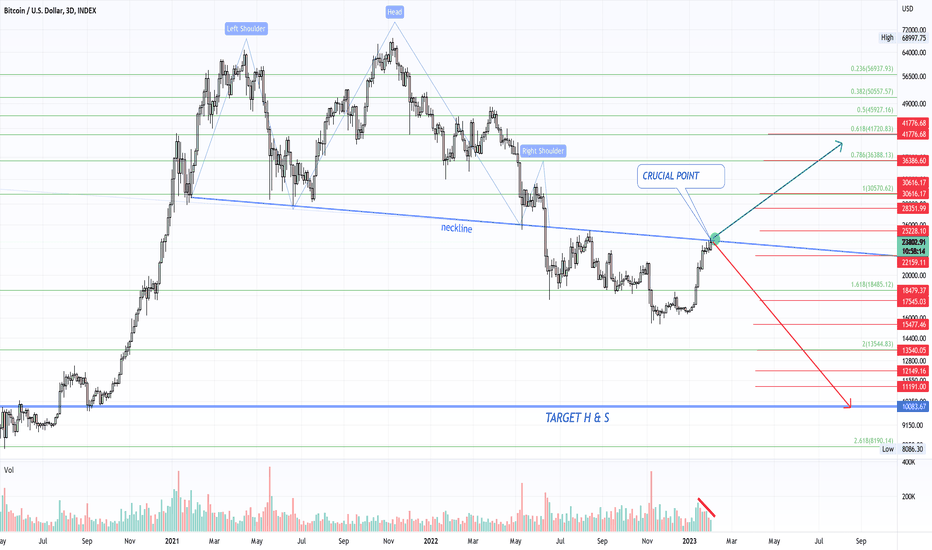
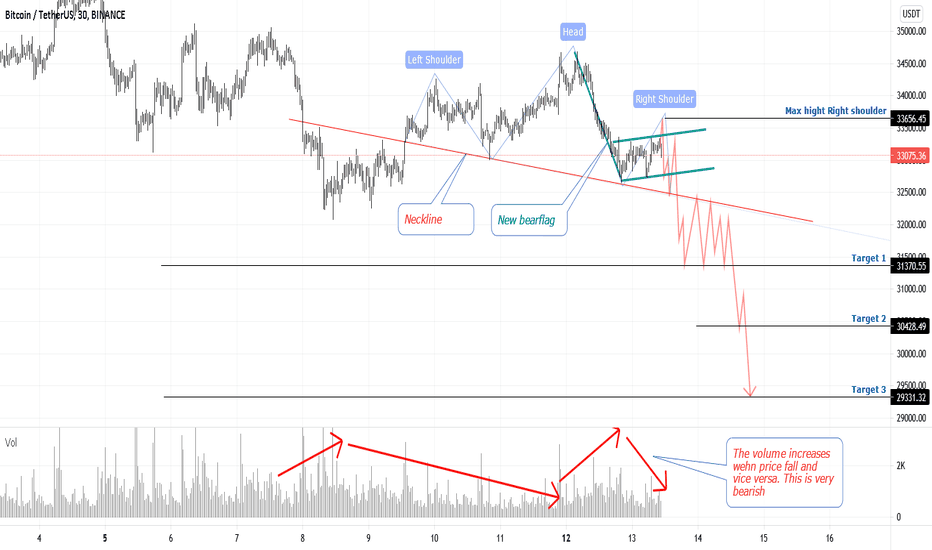
Merhaba arkadaşlar, Son yayınladığım fikrimden bu yana zaten biraz zaman geçti, işte yeni bir fikir! Burada bu 3 günlük grafikte bir kafa omuz oluşumunun oluştuğunu görebilirsiniz. Boyun hemen çok önemli bir noktadır. Gördüğünüz gibi hacim ve fiyatla bir farklılık var. Diğer birkaç osilatör üzerinde de ıraksamalar vardır. Bir resim bin kelimenin daha fazlasını söylüyor, bu yüzden hepsini grafikte görüyorsunuz Şimdilik fiyat hedefi Bitcoin için 10.000 ABD Doları ve buradaki anahtar elbette sabır. Faiz oranı artışları bitmekten çok uzak ve makroekonomik çok kötü görünüyor. Savaş da artan görünüyor ve dünyada başka gerilimler de var. Örn. Çin/ ABD, İsrail ve İran. Gıda fiyatları artmaya devam ediyor. Gıda fiyatları şiddetle artmaya devam ediyor. Kısacası, her yerde rahatsızlık görüyoruz. Benim fikrim, Euro ve doların son derece manipüle edildiği, aynı zamanda genel olarak pazarların merkez bankaları tarafından. Hisse senedi fiyatları dünyada olanlara kıyasla çok yüksektir ve normalde bu konuda keskin bir düzeltme olacaktır. SP-500, fikrim çok yakında tekrar aşağı doğru yola çıkacak. Mutlu ticaret ve iyi şanslar! Feragatname Bu benim görüşüm, satın alma veya satma tavsiyesi yok. Ayrıca, her zaman kendi araştırmanızı yapın! --- >> Sevgili dostlar, lütfen güncellemeler için beni takip edin ve bu çalışmaya devam etmemi isterseniz 👍 👍 ile destek verin. Teşekkürler 💚
PegasusTechCharts
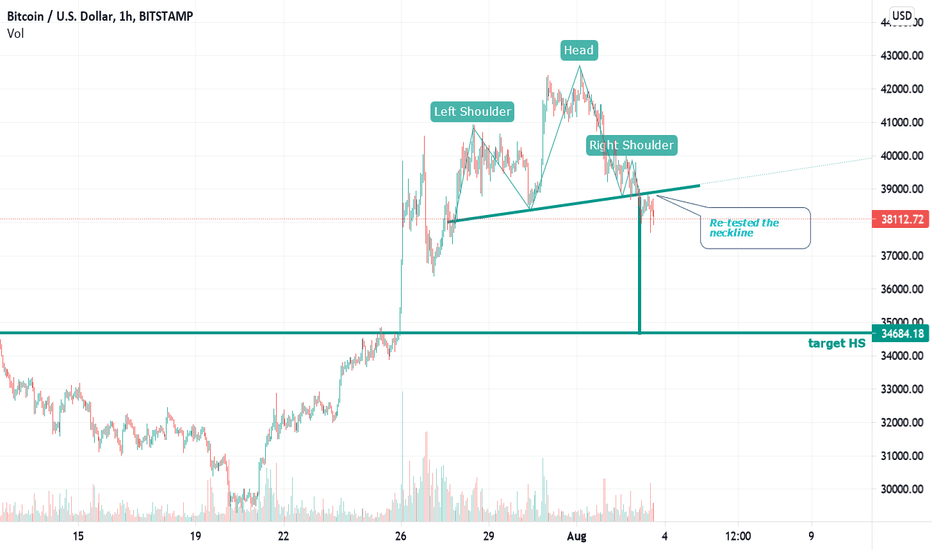
تشکیل الگوی سر و شانه دوستان عزیز، یک بهروزرسانی سریع و مختصر در مورد نمودار ساعتی. به وضوح یک الگوی سر و شانه (Bitcoin) شکل گرفته و خط گردن این الگو قبلاً دوباره تست شده است. هدف اکنون 34684 است و از آنجا دوباره دید که ساختار چگونه توسعه مییابد. حتماً بهروزرسانیهای قبلی من در مورد Bitcoin را نیز بررسی کنید زیرا آنها به هم مرتبط هستند. بقیه اهداف میانمدت را نشان میدهند. --- > در این بازار توصیه میکنم از حد ضررهای (Stop Loss) سختگیرانه استفاده کنید. <--- لطفاً نظرات و ایدههای خود را در زیر با دوستان عزیز به اشتراک بگذارید. به نظر شما چه اتفاقی میافتد و چرا اینطور فکر میکنید، با نمودار یا بدون نمودار. برای همه شما در معاملات آرزوی موفقیت دارم! سلب مسئولیت: این دیدگاه من است، هیچ توصیهای برای خرید یا فروش نیست. همچنین همیشه تحقیقات خود را انجام دهید! --->> دوستان عزیز، لطفاً برای بهروزرسانیها من را دنبال کنید و با یک لایک 👍 از من حمایت کنید اگر میخواهید به این کار ادامه دهم. ممنون 💚 تشکیل شانه راست یک الگوی سر و شانه بزرگتر ممکن است اتفاق بیفتد... دوستان عزیز، 2 سناریو ممکن است اتفاق بیفتد. لطفا توجه داشته باشید که اینها فرضیه هستند! سناریو 1: قیمت تا خط گردن سبز در 39000 جهش میکند و به هدف 34379 ادامه میدهد. سناریو 2: قیمت از خط گردن سبز عبور میکند و اولین الگوی سر و شانه را باطل میکند، اما سپس شانه راست الگوی سر و شانه نارنجی را تشکیل میدهد. هدف در این صورت 32125 بود. جالب اینجاست که در سناریو 1 این سطح 0.618 فیبوناچی و در سناریو 2 سطح 0.786 است. اگر قیمت به زیر 0.786 برود، به سمت پایین ترین سطح قدیمی رفت. این گاهی اوقات با تشکیل الگوهای سر و شانه اتفاق میافتد. میتوانید آن را با دو خط گردن که از هم عبور میکنند، ببینید. بنابراین باز هم، اینها ایدههای من هستند و البته ممکن است شکست بخورند، زیرا همه چیز در تحلیل تکنیکال (TA) ممکن است شکست بخورد. گوه نزولی صعودی دوستان عزیز، من معامله را بستم زیرا به نظر من BTC ابتدا سطح 0.618 فیبوناچی را که دقیقاً هدف گوه نزولی صعودی است، دوباره آزمایش میکند. هدف 40580 و سطح حد ضرر 37377 است. سپس همانطور که در بهروزرسانیهای من دیده میشود، یک الگوی سر و شانه نزولی جدید برای موقعیت فروش (Short) تشکیل دادهایم. دوستان عزیز، معامله طبق انتظار پیش میرود. اکنون باید ببینیم چگونه تکامل مییابد. ما اکنون در حال تشکیل شانه راست این الگوی سر و شانه هستیم. الگوی سبز که کامل نبود باطل شده است، اما این الگوی نارنجی شانس دارد. الگوی نارنجی زمانی باطل میشود که قیمت بالاتر از 41-42600 برود، زیرا شانه راست نمیتواند بالاتر از سر باشد. شکست (Outbreak) با حجم خوبی رخ داد، بنابراین همیشه آن را تایید میکند. موفق باشید دوستان عزیز و لطفا ایدههای خود را اینجا به اشتراک بگذارید. بستن موقعیت خرید (Long) دوستان عزیز، من موقعیت خرید را بستم. حجم در حال کاهش است، قیمت در حال افزایش است. هدف تقریباً محقق شد. یک سناریو احتمالی این است که ما form شانه راست الگوی سر و شانه ذکر شده در بهروزرسانیهای قبلی را تشکیل دهیم. در این صورت، الگوی سر و شانه هدفی در حدود 33000 داشت. من BTC موقعیت فروش (Short) باز نمیکنم، مگر اینکه به زیر خط گردن برویم و دوباره آن را آزمایش کنیم. برای همه شما دوستان آرزوی موفقیت و معاملات پر سود دارم! بهروزرسانی گوه (wedge) سطوح محدوده معاملاتی همچنان معتبر هستند و در این بین اگر وقت دارید که البته به صورت روزانه آن را زیر نظر داشته باشید، میتوانید در بازههای زمانی کوتاهتر معامله کنید. در حال حاضر میبینیم که قیمت با حجم خوبی در حال جهش است. این هنوز الگوی سر و شانه را باطل نمیکند، اما مستقیماً زیر خط گردن نیز سقوط کرد. ایده من این است که قیمت حتی میتواند دوباره به بالای محدوده برود زیرا BTC در حال تشکیل یک گوه نزولی است. برای شما دوستان عزیز سودهای بسیار خوبی آرزو میکنم! بهروزرسانی مختصر ما یک الگوی سر و شانه و یک گوه صعودی نزولی تشکیل شده را میبینیم. اگر قیمت BTC بالاتر از 42600 افزایش یابد، الگوی سر و شانه باطل میشود و گوه نزولی صعودی از بهروزرسانی قبلی وارد بازی میشود. سطوح سایر ایدهها در محدوده تا زمانی که قیمت به سمت بالا یا پایین شکسته نشود، همچنان معتبر هستند. موفق باشید دوستان عزیز!
PegasusTechCharts
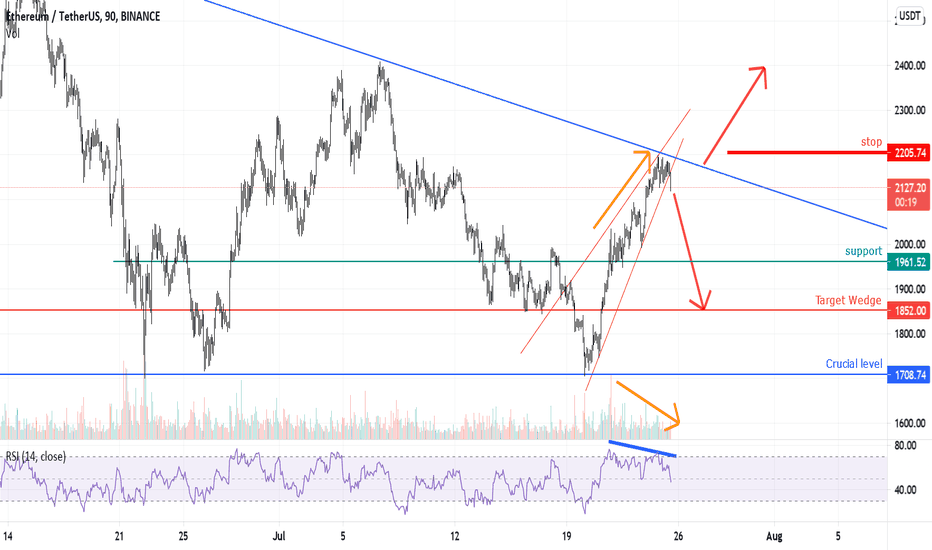
Sevgili dostlar, Ethereum düşen bir kama oluşturdu ve dezavantajı kırıldı. Kama hedefi 1852 USD. olmak. İşlerin değişmesi durumunda her zaman bir B planı için hazır olun. Bu pazarda sıkı durakları kullanmayı tavsiye ederim. Ne düşünüyorsunuz ve neden bir grafikle veya bir grafik olmadan düşünüyorsunuz. Ticarette hepinize iyi şanslar diliyorum! Feragat Bu benim görüşüm, satın alma veya satma tavsiyesi yok. Ayrıca her zaman kendi araştırmanızı yapın! --- >> Sevgili arkadaşlar lütfen güncellemeler için beni takip edin ve bu çalışmaya devam etmem için beni seviyorsanız, 👍 👍 ile destek verin. Teşekkürler 💚 Arkadaşlar da mavi trend çizgisini yakından takip ediyor. Bu eğilim çizgisinin bir molası, satın almak için ortalama hacimden daha fazlasına ihtiyaç duyar. İdeal olarak bir yeniden test beklemektir. Eğer olursa, çok güzel bir yükseliş sinyali olurdu, ancak her zaman boğa tuzaklarının farkında olmalıyız. Sıkı bir durakla yeniden test, iyi şanslar sevgili dostlar ve hepinize büyük karlar dilerim! Bestte vrienden, burada bir kez daha kriptolarda pazar manipülasyonunun ne kadar güçlü olduğunu görmeliyiz. Neyse ki, sıkı bir durak yaptık ve bu potansiyeli bir ticaretti. Neden? Çünkü geç Bitcoin 'in tüm yükselen takozları şimdi dışında yapmaları gereken şeyi yaptı. Ancak, düşük hacimler olduğunda sıklıkla gerçekleşen manipülasyona karşı, durma kaybınız dışında buna karşı yapılacak bir şey yoktur.Relfles, durumun nasıl geliştiği açık olana kadar şu anda bir pozisyon almıyorum. Tek bir önyargım yok çünkü boğa ve ayı pazarlarında kar elde edebiliriz. Yeni tüm zamanların en yüksek seviyelerine sahip borsalarda gördüğümüz şey, sadece sınırsız baskı Dolalrs ve Euro'lardan, pazarlara büyük bir parçanın enjekte edildiği trilyonlardan kaynaklanıyor. Bu, gerçek bir borsa çarpması şansı benim görüşüme göre sıfır. Kripto pazarları borsalardan farklıdır, ancak fonlardaki tüm yeni inşaatlarla gittikçe daha fazla ilişkilidir. Yani bu, orta ila daha uzun vadede akılda tutulması gereken bir şey. İyi şanslar sevgili arkadaşlar
PegasusTechCharts
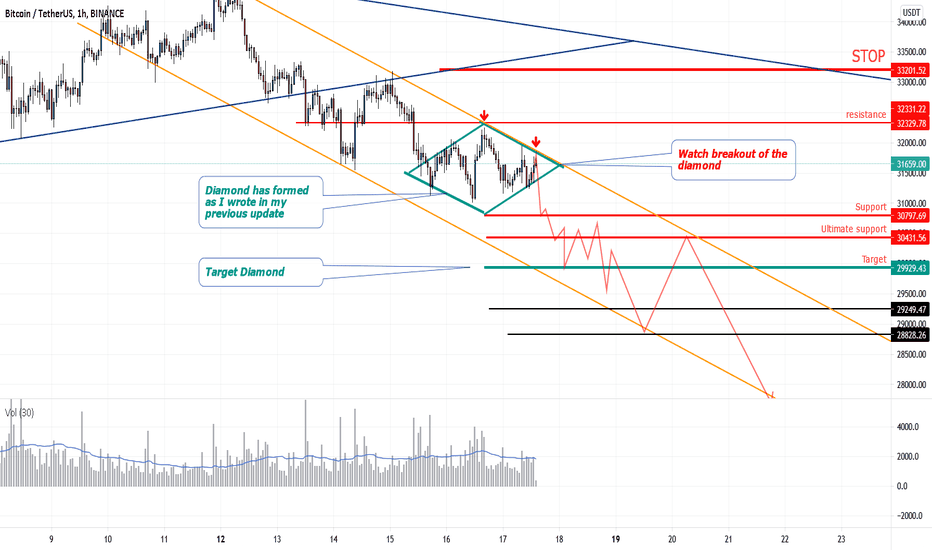
Bitcoin Diamond pattern formed. Watch the breakout!Diamond pattern formed as expected. Dear friends,As I wrote in my previous update, a diamond pattern has indeed been formed. Now look at the breakout. It is expected to be down but if not then the stop level is at 33200.I expect at least 25000 USD as a price target for Bitcoin but it could easily go lower based on the chart at that time. Step by step instead of too long targets. The price and market is dynamic so as a trader you need to adjust yourself continuously.The head and shoulder formations from previous analysis are all valid but they all points to the same target. So be sure to check out the previous updates as well.If you appreciate my work then it's nice to get a like and please follow me for new uodates. Please share your thoughts and idea's below dear friends. What do you think and why do you think it with or without a chart.I wish you all good luck with trading!Disclaimer This is my view, no advice to buy or sell. Also always do your own research!--->> Dear friends please follow me for updates and give me support with a like 👍 if you like me to continue this work. Thanks 💚Of course if the Diamond break to the upside, we possibly get a short pauze in the decline of Bitcoin. The chart will show the direction. Watch always for HH HL LH LL patterns for the trend. Important is that you look for this a t the right timeframe. For example; higher highs and higher lows on a 5 minute chart is not the same as on a 1 hour, 4 hour time frame. Good luck dear friends!Here you see the valid and already re-tested Head and shoulder pattern. What is happening now is that we are on the way to the target.So most patterns you see will be just continuation patterns. Even if not, they will probably just pause the declining price.I redrew the diamond a little bit. That's exactly how it is! Now we just have to wait and see what will happen and what direction the breakout will be. If it is upwards keep in mind a bull trap because we get to see those on a regular basis. Also the trend is still down by the LH and LL.Good luck dear friends!There is no breakout yet and look at the volume. It is declining while price rise.Bearish sign is this.Abreakout must be with good volume and a more than average candle.You can also see a bearish wedge on the right side of the triangle.UpdateDear Friends,The diamond from the previous uodate has broken out upwards but as I already wrote, this is probably a bull trap as we have seen so many. This is because the trend is still down. HH HL LL LH method 4 hour charts. New patterns are formed, a bearflag / bearish rising wedge and a triangle. On you to think about which direction it will go. Wish you all succes and good profits!Good evening dear friends,The diamond is now no longer important. The pattern has now been transformed into a bearflag. This happens constantly, patterns change.For example, a sysmetrical triangle can transform to a ascending triangle. A wedge to a trend channel. A failing head shoulder formation to a wedge etc. I trade what I see and not what I think. No biases, not bearish not bullish either. I don't care at all if it goes up or down as long as you follow the trend!Too many signals and too much information from different sources make it also difficult in special for new traders. However the market is complex and 50% thinks it goes up and 50 % thinks it goes down. That is why the price is in balance.So when does this trend change then? I have indicated that in the chart. When the level of 33129 is broken through with the close of a 4 hour candle things are going to look different. As long as that has not happened there is no rising trend. There can be a rising trend on a shorter time frame. For example on the 15 minute chart but I am talking about the 4 hour timeframe here.The shorter the time frame the more noise and the smaller the moves.Also the volume is low and cannot sustain a rising trend. For that, the volume has to grow while the price is rising. Everything can happen, we will just see what happens and then act as the chart show the direction itselfGood luck dear friends!Weekly candle Here is a weekly chart of Bitcoin. What do you guys think of this red weekly candle. It is a full candle with almost no wick. A wick below the candle is a rejected level.The monthly looks also the same.When in doubt about a trend, zoom out for another look io the price.The neckline of the HS formation and the lower trendline of the bearflag has been broken and the first target is now USD 30000.Good luck dear friendsWhat is next with Bitcoin?Bitcoin has reached our SHORT target and even went down to 29249 usd. Personally, I do not expect the trend to turn positive now. We will see that by the price movement. If Bitcoin sets a higher high then that could be the start of a short-term uptrend but again, I don't expect that.In short:If bitcoin manages to rise above 30000 then the next level is 30430 to max 31000. After that the trend should continue downwards.If bitcoin does not manage to break through the 30000 level then the decline will continue. Don't buy too soon friends because in my opinion the decline is not over yet.Do not forget that 16 months ago the price of one bitcoin was 3850 and this is not a type error;-) As an advice, always do your own research and never trade blindly on any idea!If you use a max risk of 1-2% with automatic stop loss then you have so much less risk to end with a liquidation or zero account. It is maybe not spectacular this 2% max risk but it protect your account! Good luck with trading dear friends and if you like my work please follow me and give me a like which is good for my motivation to continue this work!updateDear friends,This pullback was expected as the 29-30k level is a strong support level. The falling trendline is a strong resistance.Only on a breakout with volume and a pullback to test the red trendline is a LONG position recommended up to 36600. From there, another very heavy resistance awaits.However, I expect a deeper decline from the red descending trend line to at least 28810. Then we should see if this level is broken downwards and we enter a new analysis with much lower targets.If Bitcoin breaks out above the red trend line we can expect a rise to 36600. There I still expect a continuation of the decline again unless the price breaks through upwards there as well. Then the top of the range will come into view again. Eventually we will get another bull market if the price can break through the 42k level with high volume,We are not that far yet and it is also very questionable whether this will happen but the chart and the price dictate the direction. I am not a bull nor a bear just follow and anticipate what can happen. I have not a single bias or emotion if it goes up or down.Eventually we will get another bull market if the price can break through the 42k level with high volume,Good luck dear friends!Short update.Not much changed since the last update. The levels are still valid, the older analysis also.Bitcoin is forming now an inversed Head and shoulders but this is probably not working out because there is no volume anymore. Only with a break trough the blue trendline and a retest the situation improves for the very short time.So it looks like the trend will continue as it was untill we see a move with volume to the upside.Wish you all good trading dear friends!An updateDear friends,If Bitcoin goes through the 33600 then I expect at least a target of 36600 usd. Beware though because bull traps have been many and it could happen here too. The big boys make a game out of it to mislead every trader, therefore, also keep an eye on the trading volume.On a break down from the rising wedge I see the old low again as a target at 28800 but if Bitcoin goes below that, we will get an acceleration to 25000 as the first target. Note an uptrend there is a pullback, not a trend reversal.In short- Upon breakout of the orange trendline and ONLY after a re-test of this tread line LONG to 36600. Risk exists for a bulltrap.- Upon breakout of the wedge downwards AND the black trendline a continuation of the decline to the old low at 28800.Friends, do not go long before a re-test of broken trendline is my advice! The orange trandline is not yet broken but it is very close. Prices always re-test so no need for any fomo or emotions.Watch out for beartraps and that is why a re-test is the only way to play this more safe. Then there are many resistance levels to break as seen in the chart. Once a resistance is broken it become a support level and so the next resistance will be next target.First 33600 then 36600 then 41-42000. After that it will be a nice bullish scenario. But below 28800 we will see a very nasty dive. Just be aware of this!By the way, I have no bias, not bullish, not bearish. Just trade what you see and certainly not what you are thinking of. Succes dear friends!updateDear Friends,To buy or not to buy? That, of course, is entirely everyone's personal choice. In my analysis, my target was almost reached at 400 points. Since then we have again seen a similar price trend as we have seen recently.A divergence has now occurred on the 1 hour chart with the RSI in overbought condition. A pullback is to be expected now. We are also seeing a bearish rising wedge. Be aware that all previous wedges caused a pullback. Will it this time be different? My advice for now is patience until a pullback to at least the neckline of the inversed head and shoulders pattern, then a tight stop loss and target to 36600. Then as explained in the previous update see if this resistance is broken. If yes then Bitcoin will go to the next resistance.We are still in the trading range and will have to deal with complex rises and falls. That is the consequence of this long trading range which in my opinion in Wyckoff means a re-distribution and not an accumulation. Nevertheless there are movements which you can profit from but I only see a solid rise above 42000. One of the things we have seen also in the past is the bull and bear traps. Will it happen this time or not is difficult to say now but you can protect yourself with tight stops. About trends rising or falling an important thing to remember. Which timeframe do you use. On a 15 minute there can be a rising trend perfect to trade where it is on the 4 hour a clear downtrend. The best thing to do is keep it simple! Look at one higher time frame, what is the trend on this higher timeframe and than on the short timeframe wait for a counter trade. That is a pullback. This way you trade with the larger timeframe in your direction and buy pullbacks. That is a very good method only the timeframe sets to trade is personal. Do not forget that the smaller you go the more noise and the more you need constant for your pc to monitorLast but not least, I only give idea's here and not advice to trade because you always have to do your own analysis. Any idea can be helpfull in this but to many idea's will be confusing because at any moment there will be traders who are go for Long setups and others for short setups. Good luck dear friends!Update - Hello friends,Bitcoin is still moving upwards in the wedge with a target 36600. There was no pullback to the neckline yet and there is a bearish divergence so that can happen today. IF Bitcoin cross the level of 36600 then we will probably see the old level 41k however this tradingrange is getting weaker with time a lot of time passing nd there are a lot of resistances to take. Just use tight stops in this market to minimalize the risk for a sudden drop!Succes dear friends and if you like my work please give me a like or follow for updates!Dear friends,On the daily timeframe we see there is a wedge in combination with declining volume. That is a bearish sign. The neckline still need to be re-tested so that would come in not as surprise.
PegasusTechCharts
Bitcoin Birçok kafa ve omuz oluşumunun etkisi! Burada Bitcoin sevgili arkadaşların 90 dakikalık grafiğine bakıyoruz. Trend arkadaşınızdır ve trend düştü! red yörünge nasıl gidebilecek ama daha hızlı gidebilir. Gerçek panik, 28805'te alttan düşene kadar gerçekleşmeyecek. Kesinlikle bunun olduğunu görüyorum çünkü çoğu tüccar dibin burada olduğunu düşünüyor. Sanmıyorum ama zaten alışkın olduğunuz gibi, uzun vadeli tahminler yapmamayı tercih ediyorum çünkü bir tüccar olarak onlarla hiçbir şey yapamazsınız. Sadece adım adım ve durumu her seferinde gözden geçirin. Bitcoin yükseliş işaretleri gösterirse ve form Bottem paterni uzun süre daha fazla zaman olurdu. Bitcoin 'ın şu anda sineklere gittiğini düşünmeyin. Tot piyasa değeri de hep birlikte düşüyor. Birinci taget ve ikinci hedef 30500 ve 30000. Daha sonra 28805volumun ana hedefine gidiyoruz, düşüşte artıyor ve sadece düşüş fiyat eylemini doğrulamaktadır. Daha büyük kafa omuz oluşumları ile önceki analizlerim hala geçerli değildir, ancak bu grafikte daha iyi bir şekilde takip edemezsiniz, ancak bu grafikte daha iyi bir şekilde takip edemezsiniz! Çatışmalar! Lütfen düşüncelerinizi ve fikrinizi paylaşın sevgili dostlar. Ne düşünüyorsunuz ve neden bir grafikle veya bir grafik olmadan düşünüyorsunuz. Ticarette hepinize iyi şanslar diliyorum! Feragat Bu benim görüşüm, satın alma veya satma tavsiyesi yok. Ayrıca her zaman kendi araştırmanızı yapın! --- >> Sevgili arkadaşlar lütfen güncellemeler için beni takip edin ve bu çalışmaya devam etmem için beni seviyorsanız, 👍 👍 ile destek verin. Teşekkürler 💚BTC daha küçük zaman diliminde düşen bir kama oluşturuyor. Eğilim düştü. Arkadaşlar! Boyun çizgisini test etmek ve sonra düşüş ;-) Önemli! Sevgili dostlar, Bitcoin düşüş bir kama ve aynı zamanda genişleyen bir üçgen yaptığını görüyoruz. Bence genişleyen üçgen bir elmas desenine dönüşebilir, ancak hala çok erken. Zamanla daha net olacak. Bitcoin Bir uyarı olabilecek trend kanalını kırırsa, ancak düşüş trendini değiştirmek için 4 saatlik grafiğe ve son yüksekliğin çıkarılması gerekir = 33300. Bu düşük alçak, 4 saatlik bir şamdan, bir çift dip vb. İle teyit edilebilir. Beklemiyorum ama sadece fiyat anlatacak. Ticaretle Başarılı! Sevgili dostlar, şimdi en yeni yazıda uodatlara devam ediyoruz.
PegasusTechCharts
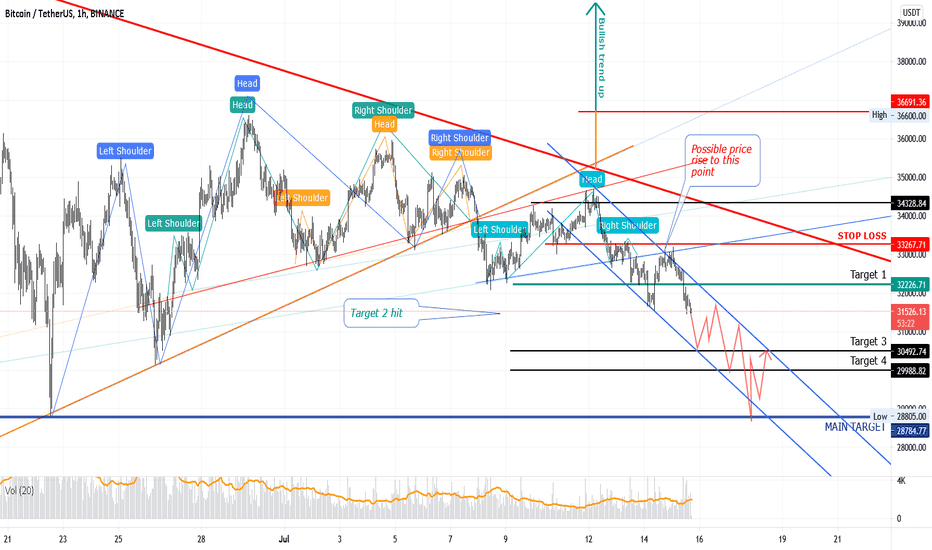
Bticoin 30 Dakikalık Grafik Yeni Desenler - Bak! Merhaba Sevgili Arkadaşlar ve Tüccarlar, Bitcoin'in 30 dakikalık grafiğinde bazı yeni gelişmeler var. Ayrıca bir kafa omuz oluşumu oluşumunu da görüyoruz. Sağ omuz için en yüksek nokta olarak 33700'e kadar bekliyorum, boyun çizgisini kırdıktan sonra aşağıdaki hedefleri görüyoruz: 314003050029400 Birkaç daha büyük kafa omuz oluşumlarına sahip önceki analizler hala geçerlidir! Uzun vadeli tahmin yok, zihninizde kolay olan ve hiçbir çatışma veren şeyleri görüyoruz! Lütfen düşüncelerinizi ve fikrinizi paylaşın. Ne düşünüyorsunuz ve neden bir grafikle veya bir grafik olmadan düşünüyorsunuz. Ticarette hepinize iyi şanslar diliyorum! Feragat Bu benim görüşüm, satın alma veya satma tavsiyesi yok. Ayrıca her zaman kendi araştırmanızı yapın! --- >> Sevgili arkadaşlar lütfen güncellemeler için beni takip edin ve bu çalışmaya devam etmem için beni seviyorsanız, 👍 👍 ile destek verin. Teşekkürler 💚 Fiyat her yükseldiğinde hacmin düştüğünü görebilirsiniz. Fiyat düştüğünde hacim yükselir. Fiyat yükselmesi durumunda, bunu doğrulamak için hacmi görmemiz gerekir, aksi takdirde devam etmeyecek bir harekettir.Bu davranış son derece düşüştür, bu yüzden gerçekten işlerin yükseleceğini ummam. Eğer olursa iyi bir hacim ve bazı seviyeler önce kırılmışız. Günlük bir mum ile tercih edilir, daha da iyi 2 tanesi sevgili dostlarım! Duraklarınızı yerinde unutmayın;-) Bitcoin yeni bir küçük ayıfla oluşturdu ve şimdi daha düşük trend çizgisini test ediyor. HS oluşumu şu anda henüz kırılmamıştır. Fiyat yükseldiğinde hacim düşmesi nedeniyle hacim düşüştür ve bunun tersi de geçerlidir. Grafikteki red okları görün ve yukarıdaki fiyatla karşılaştırın. Şimdi 3'ümüz var ve önceki analizimden 3'ün yanı sıra 2 ekstra HS'den de görüyoruz! 3 daha büyük de geçerli. Bu tablodaki ilk hedefler 32226 - 31512 - 30492. + Önceki gönderilerden hedefler. İyi şanslar Sevgili Arkadaşlar! Hedef 1 karşılandı ve hedef 2 karşılandı! Ve şimdi Hedef 3'e devam edin! İyi günler sevgili dostlar! Son HS oluşumları biraz yeniden çizilmiştir ve hala mükemmel bir şekilde geçerlidir. Tıpkı önceki analizlerimdeki 3 major HS oluşumları gibi. Bitcoin hala aşağı yönlü bir trend kanalında. Mavi HS'nin boyun çizgisi zaten yeniden test edildi, turuncu da muhtemelen yeniden test edilebilir. Daha fazla düşüş bekliyorum ve sadece yeni stoploss yalanlarının işler iyileşeceği 33400'de. İyi şanslar ve her zaman bir durma kaybı ile ticaret. Yeni düşen yükselen kama. İyi öğleden sonra sevgili dostlar! Lütfen grafiğe bakın. Bitcoin Düşen bir kama oluşturdu. Aynı zamanda yakanın yeniden testleri için de. BTC Aşağı trendChannel'de hareket eder. Eğer beklenen hamle olan red trend çizgisine sıçradı. Düşüşe devam edecektir. Sizi yenilemeye ve karlar! Bearlagthe Bearflag, Down Trend'in normal şekilde devam etmesini kırdı. Daha büyük HS oluşumları hala önceki analizimden oyunda. Yeşil trend hattı kırılmış hedefse, muhtemelen kanalın üstünü yeşil olarak görüyoruz. Hacim yok = Geçerli hamle yok! Seviyelere göz atın ve sevgili arkadaşlar diliyorum! Aşağı eğilim devam ediyor. Hepiniz analizlerden bildiğiniz gibi, BTC'nin yönü hakkında hiçbir şüphem yok, hala kısa. İlk hedef elbette 28800'de son zamanın en düşük seviyesidir ve orada fiyatın bir geri tepmesi bekleyebilirsiniz, ancak şimdi 25000 hedefi hızla yaklaşıyor. Düşen bir bıçak yakalamak büyük bir kayıpla sonuçlanabilir. Uzun zaman önce onaylamaya ihtiyacınız var. Ticaret ile iyi şanslar sevgili dostlar! Önemli! Sevgili dostlar, Bitcoin düşüş kama ve aynı zamanda genişleyen bir üçgen yaptığını görüyoruz. Bence genişleyen üçgen bir elmas desenine dönüşebilir, ancak hala çok erken. Zamanla daha net olacak. Bitcoin Bir uyarı olabilecek trend kanalını kırın, ancak düşüş trendini değiştirmek için 4 saatlik grafiğe ve son yüksekliğin çıkarılması gerekir = 33300. Bu düşük alçak, 4 saatlik bir şamdan, bir çift dip vb. İle teyit edilebilir. Beklemiyorum ama sadece fiyat anlatacak. Ticaretle Başarılı! Sevgili dostlar, şimdi en yeni yazıda uodatlara devam ediyoruz.
PegasusTechCharts
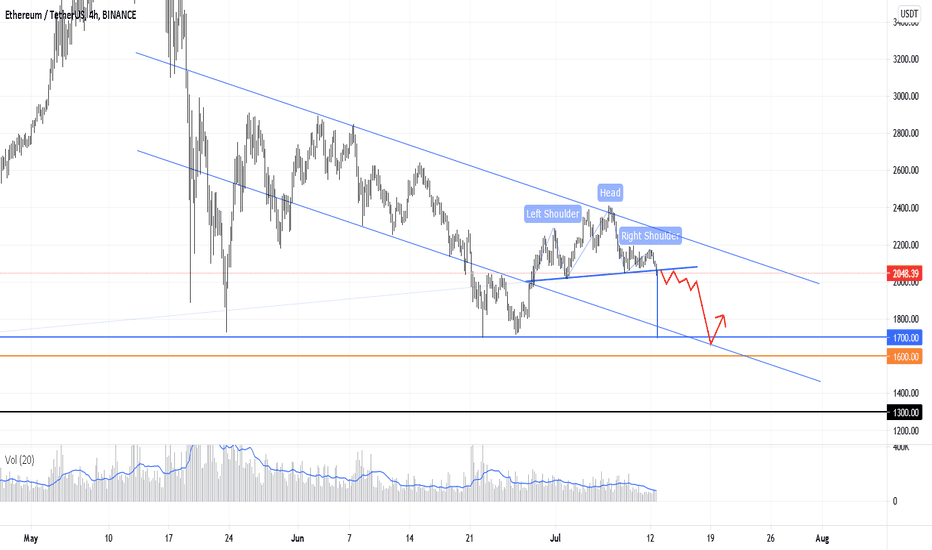
Ethereum HS Formasyonu - Hedefler 1700 - 1600 - 1300 DEAR FIRNESTEREAM bir kafa omuz oluşumunu tamamladı ve ilk hedefleri 1700-1600 ve 1300 olarak görüyoruz. Bu HS oluşumunun boyun çizgisi zaten kırıldı ve Ethereum trendChanel'de aşağı doğru hareket ediyor. Tüccarlar, şiddetli düşüşler sırasında hesapların tüm tasfiyelerinden sonra son derece temkinli hale geldiler ve bu da daha küçük ve daha küçük bir yükseliş şansını sağlıyor. Soru şimdi, ilk hedefe ulaşıldıktan sonra duruyor mu? ETH önemli bir anahtar seviyesinden daha düşük olursa, muhtemelen daha düşük hedefler göreceğiz. Ne düşünüyorsunuz ve neden bir grafikle veya grafik olmadan düşünüyorsunuz. Ticaret adamlarında hepinize iyi şanslar diliyorum! Feragat: Bu benim görüşüm, satın alma veya satma tavsiyesi yok. Ayrıca her zaman kendi araştırmanızı yapın! --- >> Sevgili arkadaşlar lütfen güncellemeler için beni takip edin ve bu çalışmaya devam etmem için beni seviyorsanız, 👍 👍 ile destek verin. Teşekkürler 💚 Günü sevgili dostlarım! Bekarın yeniden test edilmesini bekliyorum ve sonra daha sonra bir düşüş. BUL tuzaklarına dikkat edin. Şu an için bir yükseliş senaryosu yok, Bitcoin değil ve Ethereum değil. Tabii ki bu değişebilir, ancak belirli seviyelerin kırılması gerekir. Örneğin, HS'nin sağ omzu Ethereum, ancak yüksek hacimli yaka bir kırılma da bir sinyaldir. Sağ omzun en yüksek olan 2203'te bir durak ile boyun çizgisi etrafında kısa pozisyonlar kişisel olarak yapmam gereken şeydir. Ayrıca hacmi tekrar Bitcoin ve diğer alt madeni paralarda da kapattığımız gibi not edin. Düşen fiyatla artan hacim ve tam tersi. Aşırı düşüş davranışı. Sadece daha yüksek ve daha yüksek bir düşük ayarladığımızda değişir. <19> yayınlarına da bakın, çünkü Bitcoin düşerse, geri kalanı takip edecek! Neredeyse öngörülen hedefteyiz, ancak Ethereum düşen kama çıkışından kurtulursa, hedef küçük bir duraklama olacak. Sevgili dostlar! Sevgili dostlar, bu ticaret kapalıdır, çünkü profilget'e ulaşıldı/toplam kar%17,48 fiyatı, yeni bir ticaret varsa, yeni bir ticaret varsa, yeni bir fikir olarak yayınlayacağım. Sevgili dostlar!
PegasusTechCharts
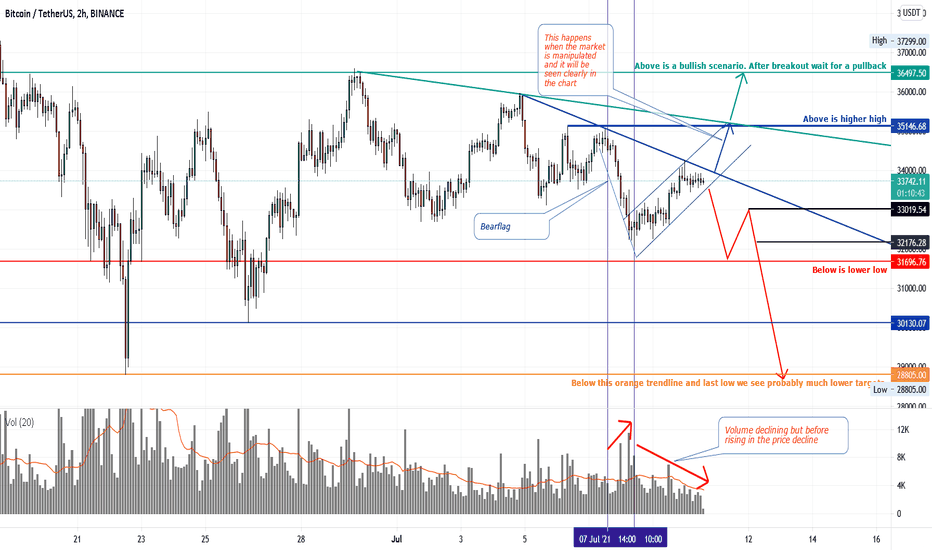
Bitcoin simple but powerful analysis with bullish bearish levelsDear friends,A different and very simple look at Bitcoin with the different bullish and bearish levels. Also posted so that you can follow it with the button in te screen to update the chart.This can be short but powerful. The simpler the better! Please note that my previous analyses are just still valid including the levels. This is just another simple view of Bitcoin, the other posts show the patterns etc.Above the green horizontal trend line there is a bullish scenario, below the orange trend line at 28805 a clear bear market with much lower levels. Above 35146 we have a higher high and below 32000 a lower low.We have the following bearish patterns (see it in my other posts)1. 3X HS formaties2 a larger bearflag3. A series of lower highs and lower lows.4 The red trendline connecting the lows which is extremely important was broken . 5. Once again declining volume with rising priceNote how during the decline the volume went up and during the last rise the volume went down. When you see something like that it is normally just bearish.A rise without volume will collapse under the force of gravity.Also take into account sudden interventions of whales and large funds. That is the only thing that can disturb the TA on the smaller timeframes.It now strongly looks like we are going to test the low again and maybe even drop below it. However, it is far too early now to judge that. The market is dynamic and anything can change. Therefore, step by step. No long term predictions that will be of little or no use to you at this time. After all, you want to make a profit now. It's good to have the fundamentals in your mind but it is important that it immediately not affect your trading from charts. If so, you won't be able to go on trading because of the many contradictions. As an advice, do not risk more than max 2% of your capital on the whole of your trades. The Crypto market moves together so 4 positions of 0.5 % risk is already the max of 2%! Of course many will not keep these numbers but is is a fact that without this you have a much higher chance of getting a zero account. The power of compounding smaller profits is the key for your total capital.Please share your thoughts and idea's below dear friends. What do you think and why do you think it with or without a chart.I wish you all good luck with trading guys!Disclaimer Traders this is my view, no advice to buy or sell. Also always do your own research!--->> Traders please follow me for updates and give me support with a like 👍 if you like me to continue this work. Thanks 💚A zoomed-in view. A zoomed-in view. An Important point is highlighted.ImportantDear Friends,Currently Bitcoin is still perfectly following the purple Rising wedge Beearflag. I expect it to break out downwards but only when the international markets reopen. If Bitcoin break upwards then that looks to me like yet another bulltrap! So beware of it because it happened several times and BTC is famous for it.When is it safe to go long? For that we first need to set a higher high and and higher low. So first of all above 35200. But then we need to set another higher low.In short.+34500 is a bullish signal but not to go long.+36000 is a clear improvement.+36800 The trend has reversed, after a re-test of 36800 Long positions are indicated but with a target of max 41-42000 USD.I don't expect BTC to go above +36800 and not even +36000 but if so we will follow charts. Why I don't expect it is because of the clear technical picture. The volume which is very low. There is absolutely no drive to be seen that people want to go full long. If there is a breakout upwards then as we have seen before it will come from a whale or large fund to manipulate again.Above 36800 with the close of at least a 4 hour candle is the signal and would mean we are heading towards 41000 /42000 again but unfortunately another huge resistance awaits there. Only above the trading range and after a pullback to retest it, the picture has changed completely to bullish and we can at least go to the old top. So step by step see what happens and don't act sooner or let yourself be lured into a trap is the message here.Happy trading dear friends and succes!UPDATEDear friends,I do not expect it but possible the price can still rise to a maximum of 34500 till 35200 usd. That does noet change the bearish picture at all and all the levels remain exactly the same.The volume has decreased again in the last rise so that is another bearish signal. All patterns are also still perfectly valid. Patience, patience, patience ;-)Tonight or tomorrow will bring clarity in my opinion. See you later friends!UpdateDear Friends,Bitcoin has already formed another bearish rising wedge. I think this time it is going down a little faster because of the price movements that were getting smaller and smaller. The volume is also ultra low so a rise has little support. The Rsi is not cooperating either.As I wrote earlier, a big move is coming and most likely not upwards. Here is also a chart showing a possible trajectory. Bitcoin should show movement but whether it happens right away we will have to wait and see. The chart here is how it could go and not a guarantee. The market is dynamic and if Bitcoin starts to rise again we will adjust the strategy as exactly described with the levels in the previous analyses still perfectly valid at this time!We will follow the chart and take it step by step without long term predictions which won't help you at this point anyway.Good luck and don't forget the stops dear friends!All the Head and shoulders patterns are still doing their job and still are valid.Bitcoin has formed a new minor bearflag and is now testing its lower trendline. The HS formation has not yet been broken at this time. Volume is bearish due to drop in volume when price rises and vice versa. See the red arrows in the chart and compare it to the price above it.The overall picture of Bitcoin looks very bearish but we have seen that in the other charts I have posted.My previous analyses with various larger head shoulder formations are all still valid!Good luck dear friendsUpdateYes indeed, again a new small bearish rising wedge. We have now 3 of them and we see also 2 extra HS fromations besides the 3 from my previous analyse! The 3 bigger also valid. First targets in this chart 32226 - 31512 - 30492. + Targets from previous posts.Good luck dear friends!Target 1 has been met and target 2 has been met! and now on to target 3! Good day dear friends!The Last HS formations are slightly redrawn and still perfectly valid. Just like the 3 major HS formations from my previous analyses.Bitcoin is still in a downward trend channel. The neckline of the blue HS has already been retested, that of the orange could possibly be re-tested as well.I expect a further decline and only at 33400 where the new stoploss lies will things improve. Good luck and always trade with a stop loss.New bearish rising wedge.Good afternoon dear friends!Please look at the chart. Bitcoin formed a bearish rising wedge. IT is also at the point for the re-tests of the neckline again. BTC moves in the downward trendchannel.A break above the red trendline will probably trigger a move to the upper side of the green channel. If it bounce on the red trendline which is the expected move it will continue to decline.Wish you succes and profits!The bearflagThe bearflag has been broken so normally continuation of the downtrend.Succes dear friends!Diamond/ Inv HSGoodevening dear friends!A small update here from Bitcoin We see a small Inverted HS and a Diamond topping pattern.Watch out for the breakout. The bigger HS formations are still in play from my previous analysis.If green trendline is broken target we see probably the top of the channel in green.But look at the volume! No volume = no valid move! Keep an eye on the levels and wish you succes dear friends!The downward trend continues.As you all know from the analyses, I have no doubt about the direction of BTC, it is still short. Very first target is of course the low of last time at 28800 and there you can expect a rebound of the price but now the target of 25000 is fast approaching. Catching a falling knife can result in a big loss. Before going long you need confirmation.Good luck with trading dear friends!Important!Dear friends, We see Bitcoin made a bearish wedge and also a expanding triangle. I think the expanding triangle could transform to a diamond pattern but it is still very premature to say. It will be more clear with time. If Bitcoin break the trendchannel that could be a warning but to change the downtrend we need to look at the 4 hour chart and the last high need to be taken out = 33300. After that there need to be a higher low and that would be the signal to go long. That lower low can be confirmed with a bullish 4 hour candlestick, a double bottom and so on. I do not expect it but only price will tell. Succes with trading!Dear friends,We continue the uodates now on the newest post.
PegasusTechCharts
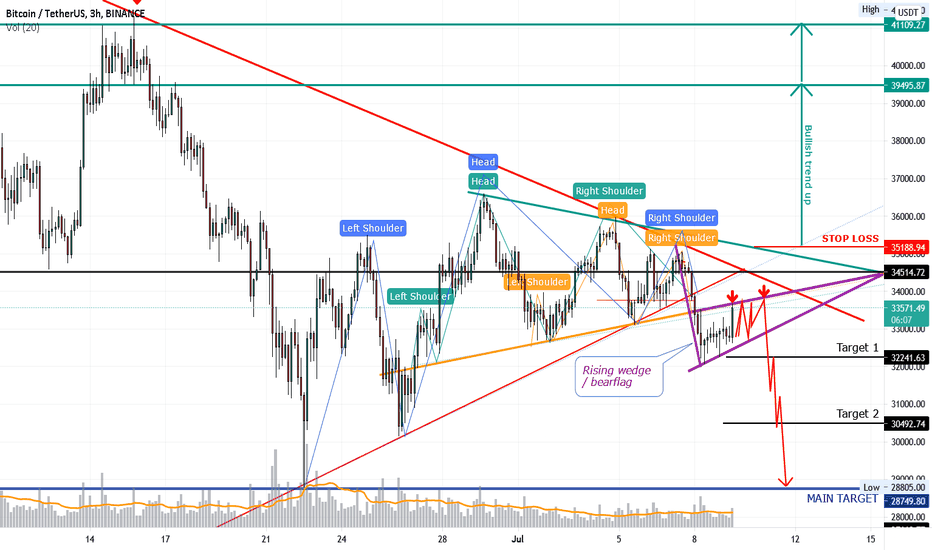
Bitcoin 3x head and shoulders + bearflag / bearish rising wedge + triangle. All patterns confirmed and validDear friends,As I expected, Bitcoin is forming a bearflag / bearish rising wedge (purple) . Yes unique because there are now 3 bearish head shoulder formations actif at the same time of which in all three the neckline has been broken.Currently, Bitcoin is re-testing the orange neckline of a smaller HS formation. Bitcoin formed under the main trend and necklines also the bearish purple rising wedge / bearflag.This picture looks pretty bearish. I expect around 34000 max 34500 another decline with the following targets.32250305002880028800 is extremely important. If BTC not hold this level we will sink much deeper. and we get 27500 and 25000 as first targets. If the price breaks through the red descending trend line with good volume that is a warning. If then BTC breaks through the green triangle trend line a second warning. Above 35200 there is a possible bullish scenario with target 39500 - 41500. This is because we set a higher high. Of course going long only after a pullback with confirmation of a higher low!If you look at this chart, a bearish flag/ rising wedge under a broken trendline in combination with 3 HS formations. It need to get very crazy if it breaks to the upside but we just follow what happens. This scenario is most likely, what do you think?Please share your thoughts and idea's below dear friends. What do you think and why do you think it with or without a chart.I wish you all good luck with trading!Disclaimer Traders this is my view, no advice to buy or sell. Also always do your own research!--->> Traders please follow me for updates and give me support with a like 👍 if you like me to continue this work. Thanks 💚UPDATE Dear Friends,An update on Bitcoin with slightly redrawn repositioned neckline and bear flag (purple).I have slightly repositioned the neckline of the hs formation but it is still perfectly valid. The price can possibly go up to 34500. Does BTC break higher then there is a warning zone. Only above 36700 we have set a higher high but then at least a pulback has to happen to go long.However, I expect the price to bounce off and fall further. I expect this due to the following reasons.1. 3X HS formaties2 a larger bearflag3. Inside the purple bearflag we see a bearish rising wedge(red)4 The red trendline connecting the lows which is extremely important was broken . 5. Once again declining volume with rising price6. A series of lower highs and lower lows.New we also see now clearly that btc has formed a bearish rising wedge in the bearflag as well. Can it be more bearish?Stop loss for this short is 35250 the targets 32240 - 30500 and 28750.There are so many factors that point to this trade succeeding but if it doesn't then it is due to manipulation of large funds because technically the picture is right on all counts.Good luck dear friends and don't forget the stop loss and the 1-2% money management rule!Looking at the candlesticks we clearly see signs again that it is going down quickly with Bitcoin unless there is intervention by a big party. We know this happens and that can disrupt everything but under normal circumstances it runs as we see in the charts.Don't forget the important rule; lower highs, lower lows. This is the most simplistic and powerful definition of the trend. When we set a higher high we are still not ready for long positions. We first have to set first a higher low after that higher high. That is then the moment to go long. That moment can be a trendline break, a bullish candle on smaller time frame, a double bottom and so on.Good luck dear friends!A zoomed-in view. A zoomed-in view. An Important point is highlighted.Dear friends,Do not forget to also check this chart. It is simple with clear targets for going long or short. I does not need to be complicated ;-)ImportantDear Friends,Currently Bitcoin is still perfectly following the purple Rising wedge Beearflag. I expect it to break out downwards but only when the international markets reopen. If Bitcoin break upwards then that looks to me like yet another bulltrap! So beware of it because it happened several times and BTC is famous for it.When is it safe to go long? For that we first need to set a higher high and and higher low. So first of all above 35200. But then we need to set another higher low.In short.+34500 is a bullish signal but not to go long.+36000 is a clear improvement.+36800 The trend has reversed, after a re-test of 36800 Long positions are indicated but with a target of max 41-42000 USD.I don't expect BTC to go above +36800 and not even +36000 but if so we will follow charts. Why I don't expect it is because of the clear technical picture. The volume which is very low. There is absolutely no drive to be seen that people want to go full long. If there is a breakout upwards then as we have seen before it will come from a whale or large fund to manipulate again.Above 36800 with the close of at least a 4 hour candle is the signal and would mean we are heading towards 41000 /42000 again but unfortunately another huge resistance awaits there. Only above the trading range and after a pullback to retest it, the picture has changed completely to bullish and we can at least go to the old top. So step by step see what happens and don't act sooner or let yourself be lured into a trap is the message here.Happy trading dear friends and succes!UPDATEDear friends,I do not expect it but possible the price can still rise to a maximum of 34500 till 35200 usd. That does noet change the bearish picture at all and all the levels remain exactly the same.The volume has decreased again in the last rise so that is another bearish signal. All patterns are also still perfectly valid. Patience, patience, patience ;-)Tonight or tomorrow will bring clarity in my opinion. See you later friends!UpdateDear Friends,Bitcoin has already formed another bearish rising wedge. I think this time it is going down a little faster because of the price movements that were getting smaller and smaller. The volume is also ultra low so a rise has little support. The Rsi is not cooperating either.As I wrote earlier, a big move is coming and most likely not upwards. Here is also a chart showing a possible trajectory. Bitcoin should show movement but whether it happens right away we will have to wait and see. The chart here is how it could go and not a guarantee. The market is dynamic and if Bitcoin starts to rise again we will adjust the strategy as exactly described with the levels in the previous analyses still perfectly valid at this time!We will follow the chart and take it step by step without long term predictions which won't help you at this point anyway.Good luck and don't forget the stops dear friends!This is the original post updated.All the Head and shoulders patterns are still doing their job and still are valid.Bitcoin has formed a new minor bearflag and is now testing its lower trendline. The HS formation has not yet been broken at this time. Volume is bearish due to drop in volume when price rises and vice versa. See the red arrows in the chart and compare it to the price above it.The overall picture of Bitcoin looks very bearish but we have seen that in the other charts I have posted.My previous analyses with various larger head shoulder formations are all still valid!Good luck dear friendsUpdateYes indeed, again a new small bearish rising wedge. We have now 3 of them and we see also 2 extra HS fromations besides the 3 from my previous analyse! The 3 bigger also valid. First targets in this chart 32226 - 31512 - 30492. + Targets from previous posts.Good luck dear friends!Target 1 has been met and target 2 has been met! and now on to target 3! Good day dear friends!The Last HS formations are slightly redrawn and still perfectly valid. Just like the 3 major HS formations from my previous analyses.Bitcoin is still in a downward trend channel. The neckline of the blue HS has already been retested, that of the orange could possibly be re-tested as well.I expect a further decline and only at 33400 where the new stoploss lies will things improve. Good luck and always trade with a stop loss.New bearish rising wedge.Good afternoon dear friends!Please look at the chart. Bitcoin formed a bearish rising wedge. IT is also at the point for the re-tests of the neckline again. BTC moves in the downward trendchannel.A break above the red trendline will probably trigger a move to the upper side of the green channel. If it bounce on the red trendline which is the expected move it will continue to decline.Wish you succes and profits!The bearflagThe bearflag has been broken so normally continuation of the downtrend.Succes dear friends!Diamond/ Inv HSGoodevening dear friends!A small update here from Bitcoin We see a small Inverted HS and a Diamond topping pattern.Watch out for the breakout. The bigger HS formations are still in play from my previous analysis.If green trendline is broken target we see probably the top of the channel in green.But look at the volume! No volume = no valid move! Keep an eye on the levels and wish you succes dear friends!The downward trend continues.As you all know from the analyses, I have no doubt about the direction of BTC, it is still short. Very first target is of course the low of last time at 28800 and there you can expect a rebound of the price but now the target of 25000 is fast approaching. Catching a falling knife can result in a big loss. Before going long you need confirmation.Good luck with trading dear friends!Important!Dear friends, We see Bitcoin made a bearish wedge and also a expanding triangle. I think the expanding triangle could transform to a diamond pattern but it is still very premature to say. It will be more clear with time. If Bitcoin break the trendchannel that could be a warning but to change the downtrend we need to look at the 4 hour chart and the last high need to be taken out = 33300. After that there need to be a higher low and that would be the signal to go long. That lower low can be confirmed with a bullish 4 hour candlestick, a double bottom and so on. I do not expect it but only price will tell. Succes with trading!Dear friends,We continue the uodates now on the newest post.
PegasusTechCharts
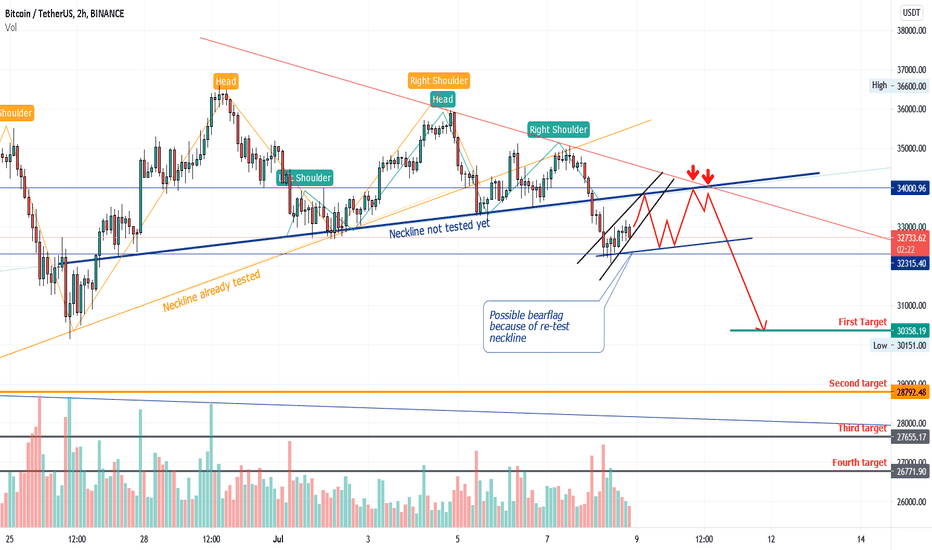
Dear friends,Here is an update of Bitcoin on the 2 hour chart.Be sure to check out my previous analysis as this one is an addendum to the previous one that is still valid.Bitcoin has fallen through the neckline of the HS formation (orange) and has successfully re-tested this line.The second HS formation (green) is also valid and the price has already fallen through that neckline. I expect a re-test of that neckline at 33800-34000. Maybe BTC don't even have the force to go that high as volume decreases while price increases. That is always bearish!After the (possible) re-test, the following targets come into the picture.30350, 28800, 27655 and possibly 26771.Should Bitcoin rise above the red triangle trendline than that is a bullish sign but still not enough. We clearly need higher highs and higher lows to change the trend! I do not expect it however but you never know with the heavy manipulation of the markets. Nothing is 100% sure in TA but this seems very likely. Please share your thoughts and idea's below dear friends. What do you think and why do you think it with or without a chart.I wish you all good luck with trading!Disclaimer Traders this is my view, no advice to buy or sell. Also always do your own research!--->> Traders please follow me for updates and give me support with a like 👍 if you like me to continue this work. Thanks 💚UpdateA zoomed-in view. An Important point is highlighted.ImportantDear Friends,Currently Bitcoin is still perfectly following the purple Rising wedge Beearflag. I expect it to break out downwards but only when the international markets reopen. If Bitcoin break upwards then that looks to me like yet another bulltrap! So beware of it because it happened several times and BTC is famous for it.When is it safe to go long? For that we first need to set a higher high and and higher low. So first of all above 35200. But then we need to set another higher low.In short.+34500 is a bullish signal but not to go long.+36000 is a clear improvement.+36800 The trend has reversed, after a re-test of 36800 Long positions are indicated but with a target of max 41-42000 USD.I don't expect BTC to go above +36800 and not even +36000 but if so we will follow charts. Why I don't expect it is because of the clear technical picture. The volume which is very low. There is absolutely no drive to be seen that people want to go full long. If there is a breakout upwards then as we have seen before it will come from a whale or large fund to manipulate again.Above 36800 with the close of at least a 4 hour candle is the signal and would mean we are heading towards 41000 /42000 again but unfortunately another huge resistance awaits there. Only above the trading range and after a pullback to retest it, the picture has changed completely to bullish and we can at least go to the old top. So step by step see what happens and don't act sooner or let yourself be lured into a trap is the message here.Happy trading dear friends and succes!UPDATEDear friends,I do not expect it but possible the price can still rise to a maximum of 34500 till 35200 usd. That does noet change the bearish picture at all and all the levels remain exactly the same.The volume has decreased again in the last rise so that is another bearish signal. All patterns are also still perfectly valid. Patience, patience, patience ;-)Tonight or tomorrow will bring clarity in my opinion. See you later friends!UpdateDear Friends,Bitcoin has already formed another bearish rising wedge. I think this time it is going down a little faster because of the price movements that were getting smaller and smaller. The volume is also ultra low so a rise has little support. The Rsi is not cooperating either.As I wrote earlier, a big move is coming and most likely not upwards. Here is also a chart showing a possible trajectory. Bitcoin should show movement but whether it happens right away we will have to wait and see. The chart here is how it could go and not a guarantee. The market is dynamic and if Bitcoin starts to rise again we will adjust the strategy as exactly described with the levels in the previous analyses still perfectly valid at this time!We will follow the chart and take it step by step without long term predictions which won't help you at this point anyway.Good luck and don't forget the stops dear friends!All patterns still valid and doing their job.Bitcoin has formed a new minor bearflag and is now testing its lower trendline. The HS formation has not yet been broken at this time. Volume is bearish due to drop in volume when price rises and vice versa. See the red arrows in the chart and compare it to the price above it.The overall picture of Bitcoin looks very bearish but we have seen that in the other charts I have posted.My previous analyses with various larger head shoulder formations are all still valid!Good luck dear friendsUpdateYes indeed, again a new small bearish rising wedge. We have now 3 of them and we see also 2 extra HS fromations besides the 3 from my previous analyse! The 3 bigger also valid. First targets in this chart 32226 - 31512 - 30492. + Targets from previous posts.Good luck dear friends!Target 1 has been met and target 2 has been met! and now on to target 3! Good day dear friends!The Last HS formations are slightly redrawn and still perfectly valid. Just like the 3 major HS formations from my previous analyses.Bitcoin is still in a downward trend channel. The neckline of the blue HS has already been retested, that of the orange could possibly be re-tested as well.I expect a further decline and only at 33400 where the new stoploss lies will things improve. Good luck and always trade with a stop loss.New bearish rising wedge.Good afternoon dear friends!Please look at the chart. Bitcoin formed a bearish rising wedge. IT is also at the point for the re-tests of the neckline again. BTC moves in the downward trendchannel.A break above the red trendline will probably trigger a move to the upper side of the green channel. If it bounce on the red trendline which is the expected move it will continue to decline.Wish you succes and profits!Diamond/ Inv HSGoodevening dear friends!A small update here from Bitcoin We see a small Inverted HS and a Diamond topping pattern.Watch out for the breakout. The bigger HS formations are still in play from my previous analysis.If green trendline is broken target we see probably the top of the channel in green.But look at the volume! No volume = no valid move! Keep an eye on the levels and wish you succes dear friends!The downward trend continues.As you all know from the analyses, I have no doubt about the direction of BTC, it is still short. Very first target is of course the low of last time at 28800 and there you can expect a rebound of the price but now the target of 25000 is fast approaching. Catching a falling knife can result in a big loss. Before going long you need confirmation.Good luck with trading dear friends!Important!Dear friends, We see Bitcoin made a bearish wedge and also a expanding triangle. I think the expanding triangle could transform to a diamond pattern but it is still very premature to say. It will be more clear with time. If Bitcoin break the trendchannel that could be a warning but to change the downtrend we need to look at the 4 hour chart and the last high need to be taken out = 33300. After that there need to be a higher low and that would be the signal to go long. That lower low can be confirmed with a bullish 4 hour candlestick, a double bottom and so on. I do not expect it but only price will tell. Succes with trading!Dear friends,We continue the uodates now on the newest post.
Sorumluluk Reddi
Sahmeto'nun web sitesinde ve resmi iletişim kanallarında yer alan herhangi bir içerik ve materyal, kişisel görüşlerin ve analizlerin bir derlemesidir ve bağlayıcı değildir. Borsa ve kripto para piyasasına alım, satım, giriş veya çıkış için herhangi bir tavsiye oluşturmazlar. Ayrıca, web sitesinde ve kanallarda yer alan tüm haberler ve analizler, yalnızca resmi ve gayri resmi yerli ve yabancı kaynaklardan yeniden yayınlanan bilgilerdir ve söz konusu içeriğin kullanıcılarının materyallerin orijinalliğini ve doğruluğunu takip etmekten ve sağlamaktan sorumlu olduğu açıktır. Bu nedenle, sorumluluk reddedilirken, sermaye piyasası ve kripto para piyasasındaki herhangi bir karar verme, eylem ve olası kar ve zarar sorumluluğunun yatırımcıya ait olduğu beyan edilir.