
GDuBFX
@t_GDuBFX
Ne tavsiye etmek istersiniz?
önceki makale
پیام های تریدر
filtre

GDuBFX
Sorry Bitcoin Bears, but the downwards trend has finished
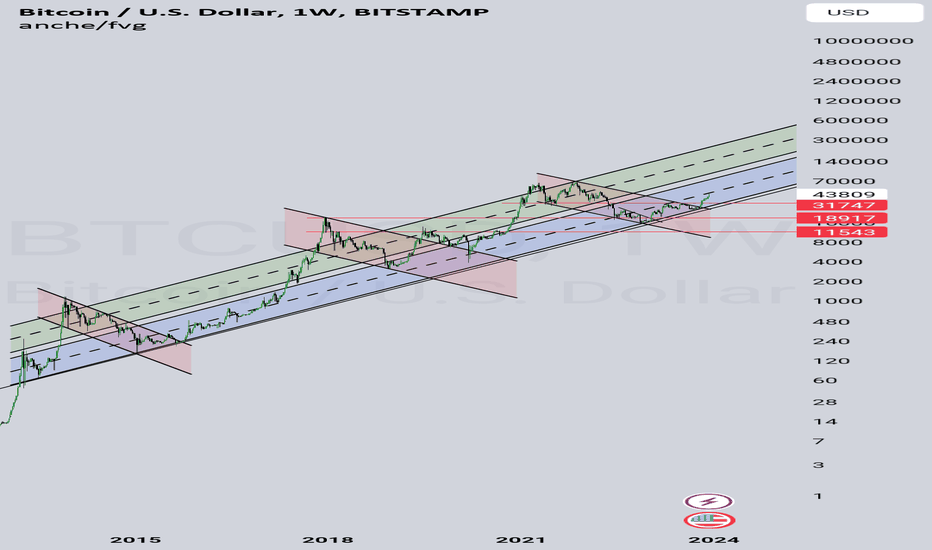
Geçmiş uzun vadeli grafiğe baktığımızda, 3 kez aşağı yönlü bir kanalda düzeltme dönemleri ile uzun vadeli bir yükseliş eğilimine sahip olduğunu açıkça görebilirsiniz. Yukarı yönlü trendin alt ve üst bantlarını ve ayrıca aşağı yönlü düzeltmeleri grafiğimde işaretledim. Uzun vadeli yükseliş eğiliminin devam ettiği, son aşağı yönlü düzeltmeden koparak ana destek/direnç seviyeleri. Eğer bu tabloya katılmıyorsanız düşüncelerinizi duymak isterim. Bu grafiğin yakınlaştırılmış versiyonlarını da yorumlarda paylaşacağım.Yorum:Yorum:Yorum: Günlük grafikte görülebilecek Wyckoff Birikimi ve Yeniden Birikimi modellerini ekleyin:

GDuBFX
Sorry Bitcoin Bears, but the downwards trend has finished

Geçmiş uzun vadeli grafiğe baktığımızda, 3 kez aşağı yönlü bir kanalda düzeltme dönemleri ile uzun vadeli bir yükseliş eğilimine sahip olduğunu açıkça görebilirsiniz. Yukarı yönlü trendin alt ve üst bantlarını ve ayrıca aşağı yönlü düzeltmeleri grafiğimde işaretledim. Uzun vadeli yükseliş eğiliminin devam ettiği, son aşağı yönlü düzeltmeden koparak ana destek/direnç seviyeleri. Eğer bu tabloya katılmıyorsanız düşüncelerinizi duymak isterim. Bu grafiğin yakınlaştırılmış versiyonlarını da yorumlarda paylaşacağım.Yorum:Yorum:Yorum: Günlük grafikte görülebilen Wyckoff Birikimi ve Yeniden birikim modellerini ekleyin:Yorum: Şeffaflık sağlamak ve bir süredir aynı görüşe sahip olduğumu göstermek ve önceki analizlerin sonuçlarını göstermek ve bunları sadece geriye dönüp bakıldığında tabloya koymak için değil, burada 9 Eylül'de yayınladığım "baharı" ve baharı tahmin eden bazı analizler var. Yeniden birikim modelinin "derenin karşısına atla" aşaması.. OLMADAN ÖNCE.Yorum: Karışıma Elliot Waves'i ekleyin:Comment:Comment:Comment: Bu mevcut dalganın, aşağıdaki grafikte vurgulandığı gibi 45 bin dolar civarında biteceğini tahmin ediyorum.... bu, mor ABC düzeltmesini ve mavi dalga 1'i (yukarıdaki ilk elliot dalga grafiğinde gösterildiği gibi) tamamlayacak. Bu daha sonra 2. düzeltme dalgasına yol açacak ve bunun da 2. seviyenin altına inmeyeceğini tahmin ediyorum. 31 bin İşte o zaman gerçek hacimler artmaya başlayacak ve işaretleme aşaması gerçekten başlamaya başlayacak... Piyasanın zirveye ulaşması için erken fiyat tahminleri 205-230 bin dolar civarında.... bunun ne kadar süreceği ve hangi yıl/ay gelebileceği analizimin bir parçası değil... Ne kadar uzun sürerse sürsün, trendi takip ediyorum. Bu da şu anda tamamen spekülatif ve piyasa devam ettikçe daha fazla güncelleme yapılması gerekecek.

GDuBFX
Re-accumaltion or distribution? Both have similar shape / Patter

Bunun dağılım mı yoksa yeniden birikim mi olup olmadığını söyleyecektir. Bence bu kişisel olarak

GDuBFX
Bitcoin Weekly RSI broken up from falling wedge

Haftalık grafiğimde görebileceğiniz gibi, haftalık RSI, fiyat eyleminde bulunan kama yansıtan düşen kama deseninden ayrıldı. Bu, fiyat eylemine ne geleceğinin bir işareti mi? Kesinlikle öyle düşünüyorum! Önceki gönderilerimi takip ediyorsanız, "Durgunluk tüm varlıkları çökertecek ve herkesin paralarını USD'ye taşıması" vb. Gibi tüm olumsuz haberlere / temellere rağmen, tüm bunları dinlemeyi sevmiyorum. değer "ve yatırımcıların ayı piyasalarında safe cennet olarak kullanacakları bir yerde? Bu neden yeniden ortaya çıkmadı ve gürültü neden duruşlarını değiştirdi? Sadece buna eklemek için, red yatay çizgi 2017/2018 yüksekliğinden haftalık yakın fiyattır. Buna ek olarak, haftalık RSI, kama ve ayrıca destek bulduğu RSI hareket ortalamasını yeniden test etti. Fiyat, 2017/2018 yüksekliğinin haftalık kapanış fiyatında da destek buldu. Yukarı doğru eğilim çizgilerinin ne olduğunu merak ediyorsanız, bunlar Grafiğimde Nisan 2013'ten en düşük seviyeden ve alçak Ağustos 2015'ten itibaren alçakta çekildi. Terim Bull Trend ve Şort Arama burada "Fomo" dedikleri şeydir. Warren Buffet'in bir zamanlar "diğerleri açgözlü olduklarında yatırımcıların korkutucu olması akıllıca ve diğerleri korkutucu olduğunda açgözlü". Fiyat eylemine karşı haftalık RSI (aşağıdaki grafikteki mavi çizgilerle gösterildiği gibi).

GDuBFX
BTC bottom, bull run starting

En son yayınladığımdan bu yana bir süre geçti, çünkü daha kısa vadede önerdiğim Wyckoff fikri geçersiz kılındı. Önde gelen bir çapraz desen gibi görünen şeyden ayrıldığı için uzun zamandır karımı kapattım (ki gözlerimi tuttuğum). Bunun sonucunda, Elliot'a bakışımı yeniden canlandırdım ve bulmaya çalıştım. Grafik: Logaritmik grafikte Mart/Nisan 2013'ten beri kurulmuş uzun süredir devam eden bir yükselme eğilimi var. Fiyat, daha önce herhangi bir düzeltmenin oluşturduğu ve fiyatı da uzun vadeli eğilimin altına olan şekildeki bir "yükselme flama modelinin" dibinde. Şimdi aşağıdaki grafiklerde görüldüğü gibi bir yükseliş "Morning Star Candlestick deseni" ile trend çizgisini zıplatıyor: Fiyat, 2017/2018 tarihinden itibaren önceki ATH seviyesinde ve ayrıca düzeltme modelinin% 161.8 Fibonacci uzatma seviyesinde. Bu, uzun vadeli trendin yanı sıra güçlü destek alanı ve izdiham alanı olduğunu kanıtlamaktadır. Buna ek olarak, haftalık RSI aşırı satıyor ve şimdi RSI hareketli ortalamasından sıçrıyor ve yükseliş momemtumu olduğunu gösteriyor. Bu, daha önce RSI bitcoin tarihinde bu pozisyonda olduğunda bir sonraki boğa koşusunun katalizörü olmuştur. Bunu takiben, genellikle yeni yükseliş trendinin dalga 1 ve 2'yi oluşturan paternin bir parçalanması olacaktır. Bunun şimdi gerçekleştiğine ve dalga 2'nin uzun vadeli boğa trendinin, flama deseninin dibinin% 161.8 fib uzantısında sona erdiğine inanıyorum. Başarısız kırılmadan (günlük grafiğimde siyah "dalga 1" ile işaretlenmiş) yeni kısa vadeli eğilim çizgisi. Bu dalga 3'ün şimdi% 161,8 fib uzatma seviyesine kadar devam edeceğini, yaklaşık 29.000 dolara (dalga 4) kadar bir düzeltmeye sahip ve daha sonra 5. dalganın yaklaşık% 41.000 $ 'ın yaklaşık 61,8 $' ından azaltılmaya devam edecek (5. Daha sonra birincil "dalga 1" in sonunu tamamlayacağına inanıyorum. Uzun vadeli birincil dalgalar için, uzun vadeli hedeflerin daha önce yayınlanmış fikirlerde bahsettiğim 100.000 dolar - 160.000 dolar seviyesi civarında olduğuna inanıyorum. Fiyat şu anda yükseliyor gibi görünüyor, ancak bu düşen kama tepesi tarafından durdurulur ve 5 waves aşağı "dalga 4" yaparsa, potansiyel olarak form uzun vadeli bir "ABC" düzeltmesinden "bir dalga", bu düzeltmenin her zaman yaklaşık 3.000 $ - 6,500 $ 'ı düşürdüğünü görebildiğimizi görebiliyoruz. Trend ile ticaret yapmak ve kırılana kadar, o zaman düşüş pozisyonları aramayacağım. Trend kırılırsa, ABC'nin "B" etrafında kısa pozisyonlar arayacağım

GDuBFX
BTC 4H Wyckoff Accumulation update
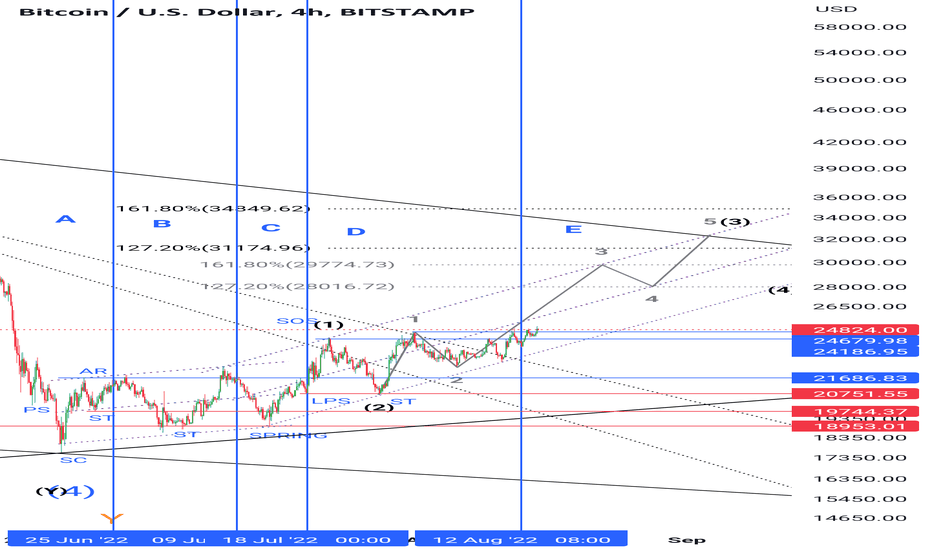
Günaydın tüccarları, önceki analizlerimi takiben, neler olduğu hakkındaki düşüncelerimi göstermek için grafiğimi güncelledim. "Güç işareti (SOS)" aşamasını takip ederek, "son desteğin (LPS) aşamasının son pozisyonunun / şekli", "SOS" un "SOS" un ardından beklediğiniz tipik devam paternini gördük. "LPS", ama şimdi menzilin tepesinden çıkmaya başlıyoruz ve hacimlerin artmasını ve fiyatlarının artmasını beklerdim, muhtemelen yarın büyük kurumsal tüccarlara yeniden açıldığında. Ayrıca, küçük aşağı doğru trend çizgilerinin bir kısmını kırdığını gördük. Yorumlarda grafik görünümü. Kama trend çizgileri, hat fiyat eylemi / şamdanları keser, eğer bunu "uygun bir şekilde" yapmak zorunda kalırsanız, bu doğru bir eğilim çizgisi değildir, ancak bir eğilim / örüntü ile geçer, ancak bir eğilim / örüntü değilse, sürekli olarak yanlış bir şekilde kendi görüşüm değilse. Ticaret! Gdubmy kısa vadeli Wyckoff fikri başarısız oldu, ancak uzun vadeli yükseliş düşüncem hala aktif, Wyckoff fikri (aynı zamanda gördüm, ancak sadece göz kulak olmuştu), bu her zaman kısa sürede yapıldığım için, bu her zaman bir olasılıkla kapalı olduğum için devam ediyordu. nedenleri, şimdi 18900 civarında 2017/2018 yüksekliğinde ve aynı zamanda uzun vadeli yükseliş çizgisi de geri döndü.

GDuBFX
If you're bearish on Bitcoin, take a look at this!
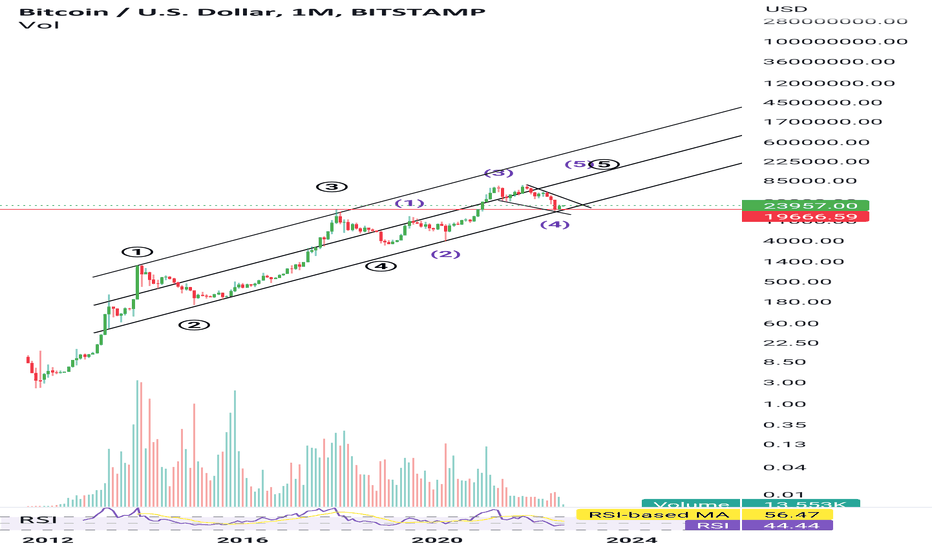
خیلیها پیشبینی میکنند که bitcoin تا ۱۳ هزار، ۱۰ هزار و غیره پایین رفت... اما وقتی در یک روند صعودی بلندمدت قرار داریم، در یک الگوی ادامه دهنده (گوه نزولی) روی نمودار لگاریتمی هستیم و قیمت هنوز از خط روند/کانال صعودی بلندمدت خارج نشده است، به همراه اینکه بالای سطوح حمایت/مقاومت قیمت بالای سالهای ۲۰۱۷/۲۰۱۸ باقی مانده است، پس از خودتان بپرسید، آیا حرکت نزولی به اندازه کافی قوی است که هر دوی این موارد را بشکند؟

GDuBFX
It's been a while since I provided an update on the Wyckoff idea
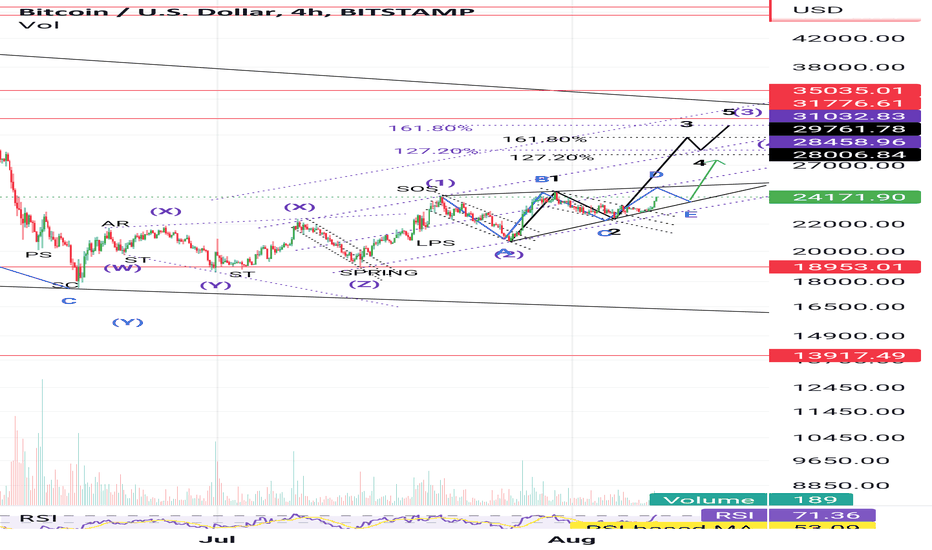
Günaydın tüccarları, son zamanlarda biraz meşgul oldum, bu yüzden wyckoff birikim fikrim hakkında bir güncelleme yapma şansım olmadı. Grafiğimde görebileceğiniz gibi, bir wyckoff birikimi paterni ve görünüşe göre, waves ve her bir dalga biçiminden oluşan bir ön çaplı diyagonal desen oluşturan ve 2 my, benden daha iyi ve gerçekten var. 5. Mor dalganın önemli bir destek/direnç seviyesi olan 31.775 dolar civarında tamamlanacağına inanıyorum. Bu waves Bu işaretliyim waves ve 5 dalga döngüsü tamamlandıktan sonra, bunun birincil dalga 1'e kadar bir şekilde, birincil dalganın birincil dalga 1 olacağına inanıyorum. Kabul etmezseniz yorumlarınızı bırakmakla birlikte lütfen bir güncelleme yapın ve fikrimi paylaşın.

GDuBFX
BTC new trend - Following on from my wyckoff accumulation idea
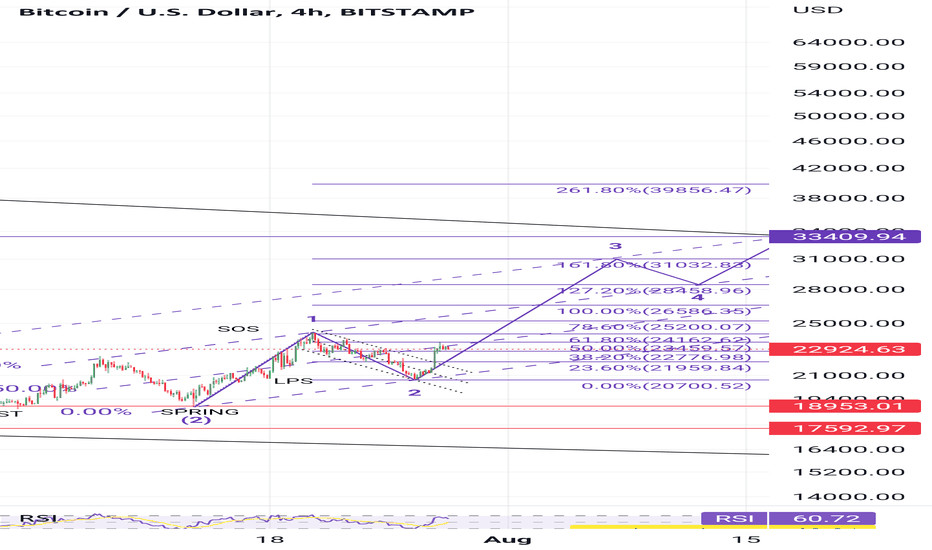
در ادامه پستهای مربوط به انباشت وایکوف که به اشتراک گذاشتم، اکنون معتقدم که "فاز E" طرح وایکوف به طور کامل در جریان است و روند جدید آغاز شده است. همانطور که در نمودار من مشاهده میکنید، یک کانال صعودی جدید در حال شکلگیری است که از سقفهای بالاتر و کفهای بالاتر تشکیل شده است، بنابراین فکر میکنم این نشانهای از تغییر روند است و پیشبینیهای موج الیوت خود را با استفاده از فیبوناچی اکستنشن مشخص کردهام. همانطور که میبینید، ما در موج فرعی سوم هستیم که شامل 5 موج صعودی کوچکتر بود، بنابراین به زودی یک اصلاح نزولی داشت که فرصتی برای خرید ایجاد میکند. هر سوالی دارید، میتوانید در قسمت نظرات زیر بپرسید. نمای کامل نمودار نیز در نظرات موجود است. معاملات پرسود داشته باشید و حتماً ریسکهای خود را مدیریت کنید. GDuB

GDuBFX
BTC 4H Wyckoff accumulation update
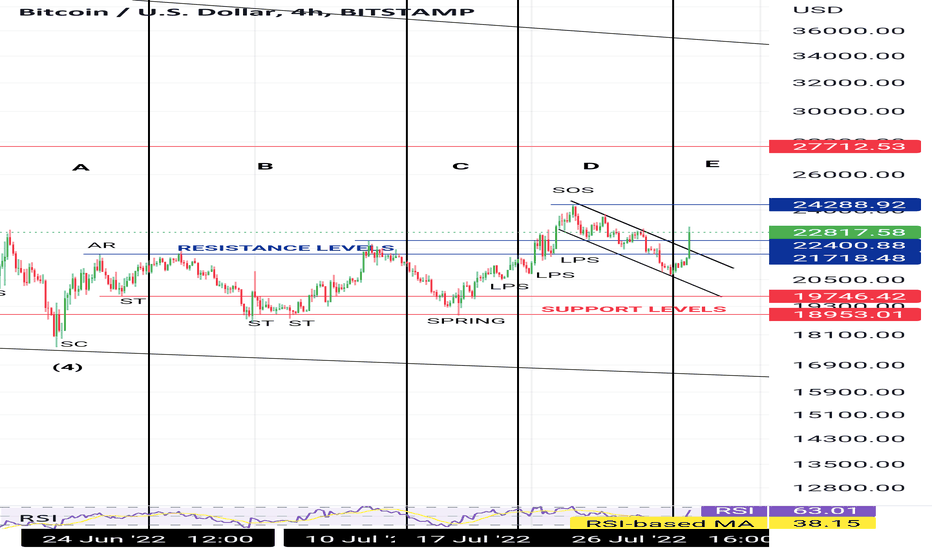
Fikirlerimi takip ediyorsanız, "SOS" Güç aşamasının işaretine sahip olduğumuzu ve modelin E Aşama'ya girdiğimizi bildirmiş olduğumu görmüş olacaksınız. Bu yanlış olduğu ortaya çıktı ve güncellenmiş grafiğimde görebileceğiniz gibi, şimdi bunu tekrar işaretledim. Fiyat, şimdi sarsılan ve uzun pozisyonlarda kayıpları durduran SOS'un ardından bir boğa bayrağına düştü ve piyasa yapıcıları bu pozisyonu emdi ve şimdi agresif bir şekilde fiyatı yükselterek bayrağın tepesini kırdı. Bir sonraki adım, SOS tarafından belirlenen önceki direnç seviyesinin üzerinde kırılmak olacaktır.
Sorumluluk Reddi
Sahmeto'nun web sitesinde ve resmi iletişim kanallarında yer alan herhangi bir içerik ve materyal, kişisel görüşlerin ve analizlerin bir derlemesidir ve bağlayıcı değildir. Borsa ve kripto para piyasasına alım, satım, giriş veya çıkış için herhangi bir tavsiye oluşturmazlar. Ayrıca, web sitesinde ve kanallarda yer alan tüm haberler ve analizler, yalnızca resmi ve gayri resmi yerli ve yabancı kaynaklardan yeniden yayınlanan bilgilerdir ve söz konusu içeriğin kullanıcılarının materyallerin orijinalliğini ve doğruluğunu takip etmekten ve sağlamaktan sorumlu olduğu açıktır. Bu nedenle, sorumluluk reddedilirken, sermaye piyasası ve kripto para piyasasındaki herhangi bir karar verme, eylem ve olası kar ve zarar sorumluluğunun yatırımcıya ait olduğu beyan edilir.