25.12.2025 tarihinde sembol DOGE hakkında Teknik officialjackofalltrades analizi

DOGE - Descending Channel at $0.127
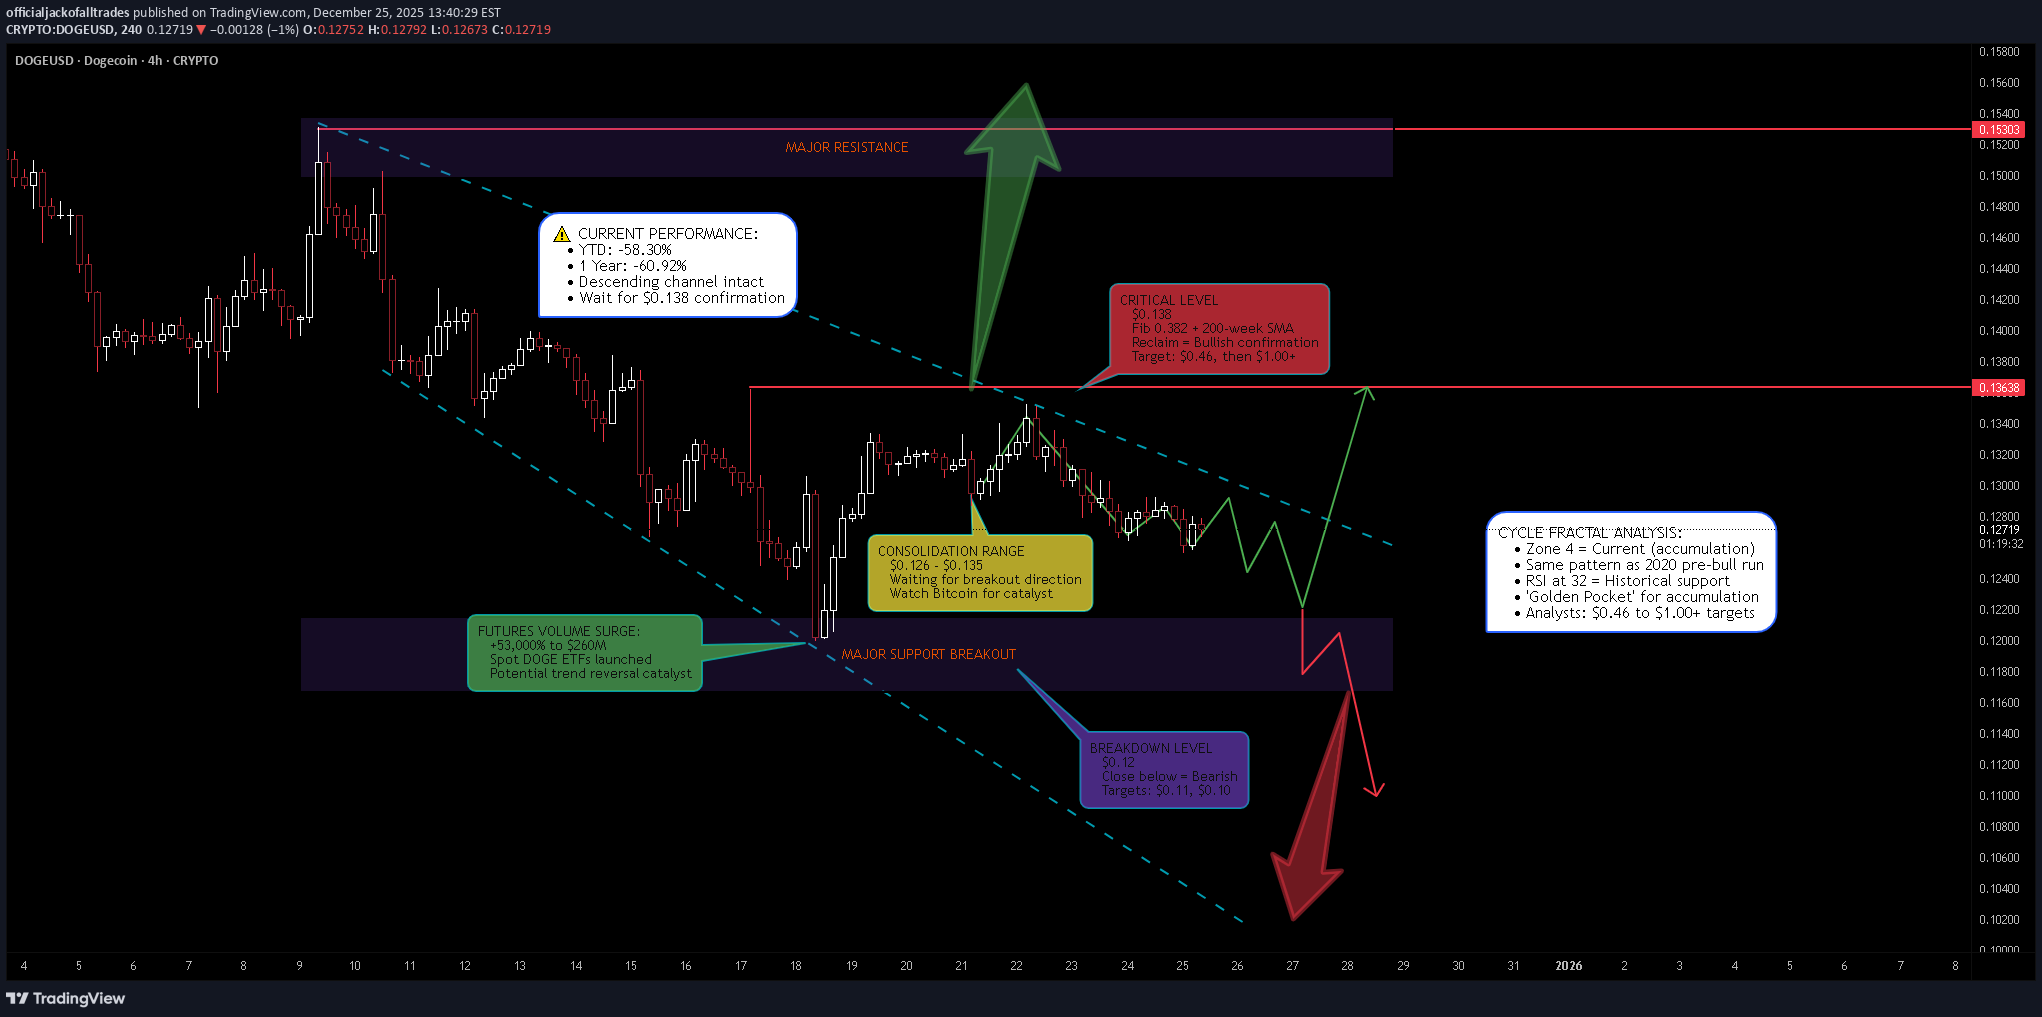
Executive Summary DOGEUSD is trading at approximately $0.127 on Christmas Day, down 58% YTD and trapped in a descending channel on the 4H timeframe. The performance metrics are brutal: -60.92% over the past year. However, multiple analysts are pointing to a cycle fractal that suggests DOGE may be in the "golden pocket" for accumulation before a major bull run. The key level to watch is $0.138 - a reclaim above this Fibonacci level could signal the start of a significant rally. Meanwhile, futures trading volume has surged 53,000% to $260 million, and spot DOGE ETFs are boosting demand. BIAS: NEUTRAL - Bullish Potential with Current Bearish Structure The chart structure is bearish (descending channel), but the cycle fractal and accumulation signals suggest this could be the calm before the storm. Wait for confirmation above $0.138 before turning bullish. Current Market Context - December 25, 2025 Dogecoin is at a critical juncture: Current Price: $0.127 (-1.22% in 24h) Market Cap: $19.39 billion 52-Week Range (Market Cap): $15.59B - $64.11B Volume: 590.15M (below 30D average of 1.13B) Open Interest: $1.51 billion (11.8 billion DOGE) Rank: #9 by market cap Performance Metrics - MOSTLY RED: 1 Week: +0.83% (Green) 1 Month: -15.91% (Red) 3 Months: -42.45% (Red) 6 Months: -19.67% (Red) YTD: -58.30% (Red) 1 Year: -60.92% (Red) The numbers are ugly. DOGE has lost nearly 60% of its value this year. But is this the bottom? THE BULL CASE - Cycle Fractal Points to Imminent Rally The Dogecoin Cycle Fractal Crypto analyst Cryptollica has identified a cycle fractal that shows DOGE may be at the point before it begins its bull run. The fractal has repeated itself at the macro level with four distinct structural points: Zone 1 & 2: "Boredom phases" where volatility died and smart money accumulated Zone 2: Was the launchpad for the massive 2021 parabolic run Zone 4 (CURRENT): Same rounding-bottom formation playing out Price is stabilizing and forming a heavy base just like before previous explosions Key Insight: The analyst states this is the "Golden Pocket" for accumulation. If the fractal plays out as it did in 2020 (Zone 2), the current price action is simply the calm before the storm. RSI at Historical Support Weekly RSI at 32 level - acts as historical floor DOGE has formed a macro bottom every time RSI touched this baseline RSI has reset to this critical support level Indicates sellers are exhausted Momentum is primed to flip The $0.138 Level - Key to Recovery Analyst Kevin has identified $0.138 as THE critical level: Must be reclaimed on 3-day to weekly timeframe closes Would place DOGE back above macro 0.382 Fibonacci retracement This Fib level divides bearish and bullish market phases Also aligns with 200-week Simple Moving Average A move above would signal long-term buyers regaining control Next major target after reclaim: $0.46 (liquidity/resistance zone) Futures Volume Surge - 53,000% Dogecoin futures trading volume surged 53,000% to $260 million Driven by Dogecoin ETF activity and derivatives This surge came before recent price stability Could be catalyst for upcoming trend reversal Spot DOGE ETFs launched in late 2025, boosting demand Analyst Price Targets Cryptollica: DOGE could rally significantly and possibly exceed $1 Kevin: Next major resistance at $0.46 after $0.138 reclaim Current resistance targets: $0.148 and $0.196 Support expected in $0.11 range THE BEAR CASE - Descending Channel Still Intact Current Technical Structure The 4H chart shows a clear descending channel: Lower highs and lower lows dominating Price trapped between declining trendlines Channel resistance capping rallies Channel support providing temporary bounces No confirmed breakout yet Bearish structure until proven otherwise Concerning Metrics YTD: -58.30% - Massive underperformance 1 Year: -60.92% - Lost more than half its value Market cap down from $64.11B high to $19.39B Volume below 30-day average (590M vs 1.13B) Open interest dropped 4.03% in last 24 hours Lost crucial $0.13 support level Market Headwinds Broader crypto market in risk-off mode Total crypto market fell below $3 trillion to $2.94 trillion Fed rate expectations pushing out (rates on hold until April) Holiday trading with thin liquidity DOGE utility discussions (sidechains, L2) progressing slowly Technical Structure Analysis Price Action Overview - 4 Hour Timeframe The chart shows a descending channel pattern: Descending Channel Characteristics: Upper trendline: Connecting lower highs (resistance) Lower trendline: Connecting lower lows (support) Channel slope: Bearish (declining) Price oscillating between boundaries Current position: Mid-to-lower channel Recent Price Action: Dec 19 surge to $0.134 high Failed to break channel resistance Pulled back to current $0.127 level Now trading in tight range ($0.126-$0.135) Consolidation setting stage for next move Key Support and Resistance Levels Resistance Levels: $0.134-$0.135 - Immediate resistance / recent high $0.138 - CRITICAL LEVEL (Fibonacci 0.382 + 200-week SMA) $0.148 - Next resistance target $0.196 - Secondary resistance $0.46 - Major liquidity zone (if $0.138 reclaimed) $1.00 - Analyst moon target Support Levels: $0.126 - Immediate support / range bottom $0.125 - Key support (must hold for bullish setup) $0.12 - Psychological support $0.11 - Major support zone $0.10 - Deep support / psychological Range Analysis Current consolidation range: Range high: $0.135 Range low: $0.126 Range width: ~$0.009 (7%) Breakout direction will determine next major move Above $0.138 = Bullish confirmation Below $0.12 = Bearish continuation Moving Average Analysis Price below major moving averages 200-week SMA at ~$0.138 area - key resistance MAs sloping downward on shorter timeframes Need to reclaim MAs for trend reversal Currently bearish MA structure RSI Analysis 4H RSI at 42 - showing growing buyer interest Weekly RSI near 32 - historical support level RSI breakthrough would boost momentum Target resistance at $0.134 if RSI breaks higher Oversold conditions on higher timeframes Bitcoin Correlation - Key Catalyst Analyst Kevin notes that DOGE's recovery is tied to Bitcoin: Bitcoin needs to reclaim $88,000-$91,000 range This would require BTC to rally 2-6% from current levels BTC strength would support bullish momentum across crypto Without BTC confirmation, DOGE may continue consolidating Watch BTC as leading indicator for DOGE direction SCENARIO ANALYSIS BULLISH SCENARIO - Breakout Above $0.138 Trigger Conditions: 3-day or weekly close above $0.138 Bitcoin reclaims $88,000-$91,000 RSI breaks above 50 on weekly Volume surge on breakout Descending channel breakout confirmed Price Targets if Bullish: Target 1: $0.148 - First resistance Target 2: $0.196 - Secondary resistance Target 3: $0.46 - Major liquidity zone Moon Target: $1.00+ (cycle fractal projection) Bullish Catalysts: Cycle fractal pointing to bull run RSI at historical support (32 level) "Golden Pocket" accumulation zone Futures volume surge (53,000%) Spot DOGE ETFs boosting demand Smart money accumulation phase Rounding bottom formation BEARISH SCENARIO - Breakdown Below $0.12 Trigger Conditions: 4H close below $0.12 Bitcoin weakness below $85,000 Volume spike on breakdown Descending channel continues Open interest continues declining Price Targets if Bearish: Target 1: $0.11 - Major support zone Target 2: $0.10 - Psychological support Target 3: $0.08-$0.09 - Extended downside Bearish Risks: Descending channel still intact YTD: -58.30% - Severe underperformance Lost $0.13 crucial support Volume below average Open interest declining Broader crypto market weakness Fed rate expectations pushed out Utility development slow NEUTRAL SCENARIO - Continued Range Trading Most likely short-term outcome: Price continues in $0.126-$0.135 range Consolidation before next major move Wait for Bitcoin direction Wait for $0.138 reclaim or $0.12 breakdown Holiday trading keeps volatility low MY ASSESSMENT - NEUTRAL with Bullish Potential This is a genuinely mixed setup: Bearish Factors (Current Reality): Descending channel intact YTD: -58.30%, 1Y: -60.92% Below all major moving averages Lost $0.13 support Volume declining Open interest dropping Bullish Factors (Future Potential): Cycle fractal pointing to bull run RSI at historical support "Golden Pocket" accumulation zone Futures volume surge 53,000% Spot ETFs boosting demand Analysts targeting $0.46 to $1.00+ Rounding bottom forming My Stance: NEUTRAL - Wait for Confirmation The current structure is bearish, but the accumulation signals are compelling. This is NOT the time to short, but also not the time to go heavy long without confirmation. Strategy: Wait for $0.138 reclaim for bullish confirmation Or wait for $0.12 breakdown for bearish confirmation Small accumulation positions acceptable in $0.125-$0.127 zone Don't chase - let the market show its hand Watch Bitcoin for direction Trade Framework Scenario 1: Bullish Breakout Trade Entry Conditions: 3-day or weekly close above $0.138 Volume confirmation Bitcoin above $88,000 Trade Parameters: Entry: $0.138-$0.142 on confirmed breakout Stop Loss: $0.125 below recent support Target 1: $0.148 (Risk-Reward ~1:0.5) Target 2: $0.196 (Risk-Reward ~1:4) Target 3: $0.46 (Extended) Scenario 2: Accumulation in Range Entry Conditions: Price tests $0.125-$0.127 support Bullish rejection candle RSI holding above 30 Trade Parameters: Entry: $0.125-$0.127 at range support Stop Loss: $0.118 below $0.12 psychological Target 1: $0.134-$0.135 (range high) Target 2: $0.138 (key Fibonacci level) Target 3: $0.148+ (if breakout occurs) Risk-Reward: ~1:1.5 to first target Scenario 3: Bearish Breakdown Trade Entry Conditions: 4H close below $0.12 Volume confirmation Bitcoin weakness Trade Parameters: Entry: $0.118-$0.12 on confirmed breakdown Stop Loss: $0.128 above recent consolidation Target 1: $0.11 (Risk-Reward ~1:1) Target 2: $0.10 (Risk-Reward ~1:2) Target 3: $0.08-$0.09 (Extended) Risk Management Guidelines Position sizing: 1-2% max risk per trade DOGE is highly volatile - use appropriate size Wait for confirmation before large positions Respect the descending channel until broken Watch Bitcoin correlation closely Holiday trading = thin liquidity Scale into positions rather than all-in Take profits at targets Invalidation Levels Bullish thesis invalidated if: Price closes below $0.11 Descending channel breaks down further Bitcoin crashes below $80,000 Weekly RSI breaks below 25 Bearish thesis invalidated if: Price closes above $0.138 on weekly Descending channel breaks to upside Bitcoin reclaims $91,000 Volume surge on breakout Conclusion DOGEUSD is at a critical inflection point. The current structure is bearish with a descending channel and -58% YTD performance. However, multiple analysts are pointing to a cycle fractal that suggests this could be the "golden pocket" for accumulation before a major bull run. The Numbers: Current Price: $0.127 YTD Performance: -58.30% 1-Year Performance: -60.92% Market Cap: $19.39 billion Key Level: $0.138 (Fibonacci 0.382 + 200-week SMA) Key Levels: $0.138 - CRITICAL (reclaim = bullish confirmation) $0.134-$0.135 - Immediate resistance $0.127 - Current price $0.125-$0.126 - Immediate support $0.12 - Psychological support (breakdown level) $0.11 - Major support The Setup: Dogecoin is consolidating in a descending channel with the cycle fractal suggesting accumulation. The $0.138 level is THE key - a reclaim would signal the start of a potential rally to $0.46 and beyond. Without that confirmation, the bearish structure remains intact. Strategy: NEUTRAL stance - wait for confirmation Small accumulation acceptable at $0.125-$0.127 Bullish above $0.138 (targets $0.148, $0.196, $0.46) Bearish below $0.12 (targets $0.11, $0.10) Watch Bitcoin for direction As analyst Cryptollica says: "Ignore Dogecoin now, chase it later." The spring is loading - patience is required.