sembol BTC hakkında analiz Teknik Mentor_Michael03: Satın al (07.12.2025) önerilir

Mentor_Michael03
تحلیل بیت کوین با مفاهیم پول هوشمند (SMC): خط قرمز بازیگران بزرگ کجاست؟
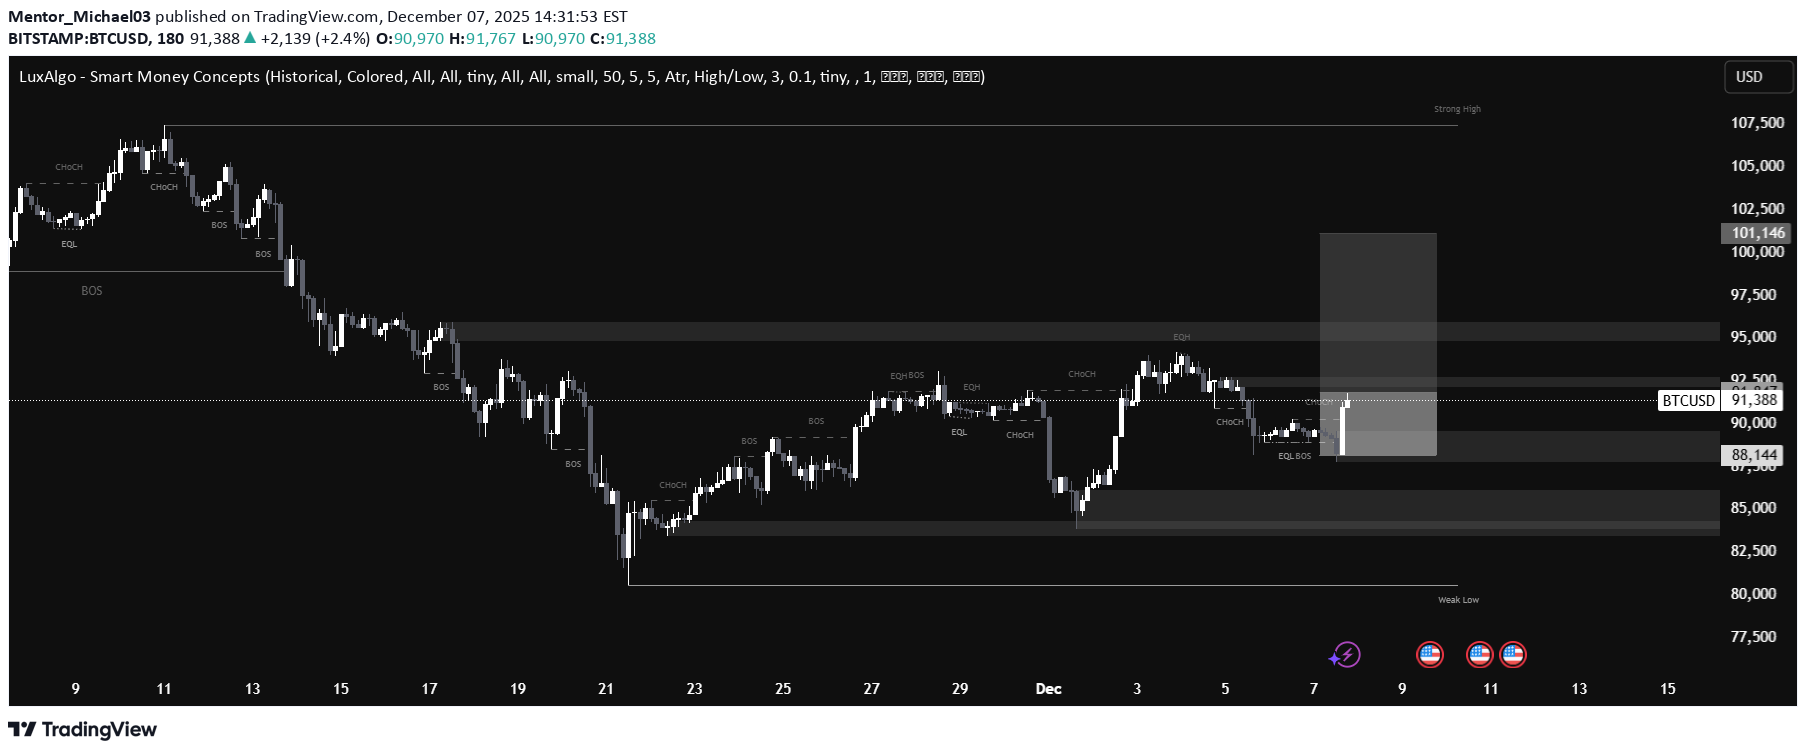
This is a detailed, professional, and sequence-wise analysis of the Bitcoin (BTC/USD) market using **Smart Money Concepts (SMC)**, integrating technical structure with current fundamental drivers for institutional-grade decision-making. The current price action is characterized by **short-term bearish pressure** within a **medium-term consolidation phase**, following a failure to sustain the previous high near $100,000. Institutional traders are likely positioning themselves for a high-impact liquidity event driven by upcoming monetary policy announcements. --- 1. ⚙️ Top-Down Market Structure Analysis (Daily/4H) The SMC strategy begins with a **Top-Down Analysis** to establish the primary trend and identify institutional activity zones across different timeframes. A. Higher Timeframe (HTF) Market Structure (Daily) * **Overall Trend:** The medium-term trend remains **Bullish** (higher highs and higher lows) despite the recent pullback from the $100,000 region. * **Key High (HH):** $\approx \$100,000$. This is the previous major **Swing High**. * **Key Low (HL):** The current short-term structure low is around **$\approx \$80,742$** (1-Month Low/13-Week Low). * **Current Action:** The price is consolidating below the **Pivot Point (PP) $\approx \$90,053$** and the 40-Day Moving Average ($\approx \$100,365$). The price action suggests a **short-term retracement** or consolidation is in progress, as confirmed by the short-term trend being in a falling channel. B. SMC Structure Identification * **Bearish Order Block (OB) / Supply Zone:** The price range between **$\approx \$94,000$ and $\approx \$96,090$**. This is the origin of the recent sharp displacement to the downside, where institutional short orders were filled. This area represents heavy **supply** and acts as the immediate major resistance. * **Bullish Order Block (OB) / Demand Zone:** The range between **$\approx \$84,000$ and $\approx \$86,000$**. This zone is the likely point of institutional accumulation, aligning with the major support at the 2nd Support Point ($\approx \$85,799$) and $84,000$ support channel floor. --- 2. 🌊 Liquidity Analysis & Institutional Targets Smart Money (SM) targets areas of high **liquidity**—where a cluster of retail stop-loss orders (often placed just above or below obvious highs/lows) exists—to fill their large orders with minimum slippage. A. Sell-Side Liquidity (SSL) Target * **Location:** Directly below the previous swing low and the short-term trading range. * **Target Zone:** **$\approx \$83,204$ to $\approx \$84,282$** (Pivot Point 3rd Support/Price 3 Standard Deviations Support). * **Scenario:** A drop into this zone is a high-probability **liquidity grab (Stop Hunt)**. Institutional buyers can sweep up the liquidity from the stop-losses of retail longs before initiating a major move higher (a classic accumulation maneuver). B. Buy-Side Liquidity (BSL) Target * **Location:** Above the current consolidation high. * **Target Zone:** **$\approx \$95,601$ to $\approx \$97,253$** (Pivot Point 2nd and 3rd Resistance). * **Scenario:** A move into this area would constitute the clearing of liquidity from retail short positions, potentially providing fuel for the continuation of the short-term sell-off from the Bearish Order Block, or paving the way for a major **Break of Structure (BOS)** above $100,000. --- -Wise Trade Plan (4H/1H Execution) The trade plan is structured around a sequence of high-probability SMC events, prioritizing the move to clear liquidity before a directional commitment. Liquidity Sweep (Anticipating Short-Term Move) * **Action:** Monitor price for an impulsive move (Displacement) downwards. * **Event:** Price breaks the **$\approx \$87,500$ support** and sweeps the **SSL** below the **$\approx \$85,799$ (Pivot 2nd Support)** and continues toward the **Demand Zone ($\approx \$84,000$)**. * **Confirmation:** Look for a **Change of Character (ChoCH)** back to the upside on a lower timeframe (e.g., 15-minute chart) once the price enters the $\approx \$84,000$ Demand Zone. The ChoCH signals a potential reversal as Smart Money steps in to buy. Trend Continuation (Long Trade Setup) * **Entry:** **Long** once a confirmed **ChoCH** is established within the Demand Zone ($\approx \$84,000$ - $\approx \$86,000$). * **Stop-Loss:** Placed safely below the ultimate low of the liquidity sweep (i.e., below $\approx \$83,204$). * **Take-Profit 1 (TP1):** The **Bearish Order Block** / Supply Zone at $\approx \$94,000$ to $\approx \$96,090$. The price will likely react here as institutional shorts are defended. * **Take-Profit 2 (TP2):** The **BSL** above $\approx \$97,253$. Break of Structure (BOS) Confirmation * **Action:** If price breaks and sustains a close **above the $\approx \$96,090$ Order Block** and the **$\approx \$100,000$ swing high** (BOS) on the Daily chart. * **Result:** This confirms the resumption of the strong medium-term bullish trend and signals a **directional commitment** by institutional buyers. The subsequent retracement can be bought aggressively, targeting the 52-Week High at $\approx \$126,184$.