sembol SOL hakkında analiz Teknik bryandowningqln: Satın al (08.09.2025) önerilir

bryandowningqln
Solana's Price Coils in Rare Bullish Formation
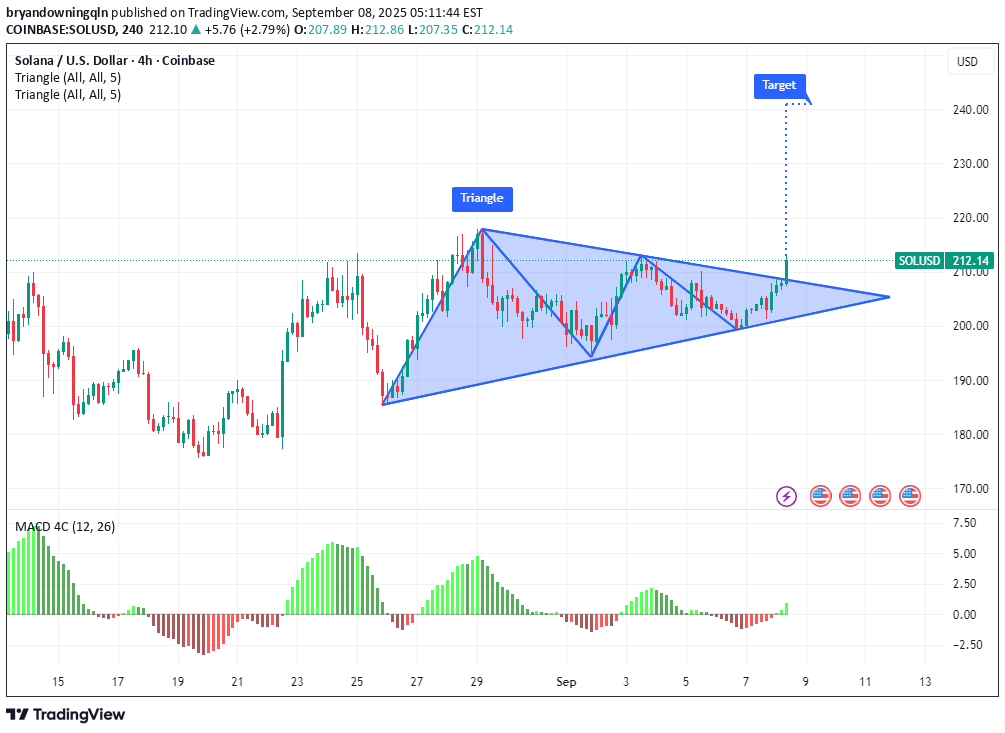
Solana's Price Coils in Rare Bullish Formation, Hinting at a Potential Rally to $230 Solana (SOL) has captured the attention of the cryptocurrency market, with its price charting a course that suggests a significant upward movement may be on the horizon. After a robust gain over the past month and a powerful rebound from its recent lows, the high-performance blockchain's native token is trading within a classic technical pattern known as a symmetrical triangle. A decisive breakout from this formation could propel SOL towards a price target of $230 in the coming days, a move supported by strengthening on-chain metrics, resurgent NFT market activity, and bullish sentiment in the derivatives market. The digital asset has shown considerable strength, rallying to intraday highs well above the $200 mark before stabilizing. This price point not only marks a significant recovery but also positions SOL tantalizingly close to the upper boundary of its consolidation pattern. This technical setup, combined with strong fundamental tailwinds, is creating a compelling narrative for a potential bullish continuation. The Anatomy of a Bullish Setup: The Symmetrical Triangle At the heart of the current bullish thesis for Solana is the formation of a symmetrical triangle on its price chart, a pattern that has been developing over recent weeks. In technical analysis, a symmetrical triangle is characterized by two converging trendlines—one descending line connecting a series of lower highs and one ascending line connecting a series of higher lows. This pattern visually represents a period of consolidation and indecision in the market, where the trading range tightens and volatility contracts. It signifies a temporary equilibrium between buyers and sellers, often preceding a significant price move or "breakout." While a symmetrical triangle is technically a continuation pattern—suggesting the price will likely resume the trend it was in prior to the triangle's formation—it can break in either direction. However, for Solana, which has been in a broader uptrend, a breakout to the upside is the more anticipated outcome. Analysts are closely watching for a decisive close above the triangle's upper trendline, ideally accompanied by a spike in trading volume, which would serve as confirmation of the breakout. Multiple analyses converge on a significant price target should this breakout occur. The height of the triangle at its widest point, projected upward from the breakout point, suggests a potential rally that could take SOL to the $230 mark. Other technical strategists have identified targets in a similar range, with some pointing to the $230-$235 area and others looking at a near-term pivot range that could open the path toward higher targets. Strengthening this possibility are key momentum indicators. The Moving Average Convergence Divergence (MACD), a popular trend-following indicator, has shown its primary line crossing above its signal line, a classic sign of a strengthening uptrend and building bullish momentum. The Road to Recovery: A Powerful Rebound Ignites Momentum Solana's current consolidation does not exist in a vacuum. It follows a period of impressive recovery that has renewed investor confidence. After dipping to a notable low in the preceding month, SOL has mounted a formidable comeback of over 30%. This rebound demonstrates strong buying pressure at lower price levels and has established a solid foundation for the current market structure. Over the past month alone, SOL has registered a double-digit percentage increase in value, a period during which the symmetrical triangle began to take shape. This price action suggests that the recent consolidation is a healthy pause, allowing the market to digest recent gains before a potential next leg up. The series of higher lows established since late August is particularly constructive, indicating that buyers remain active and are stepping in to defend key support levels. The cryptocurrency is currently consolidating above a critical support level in the high $190s. This price zone is considered highly significant by on-chain analysts, as a massive volume of tokens has historically been traded at this level, creating a strong foundation of support that bulls are actively defending. Beyond the Charts: Fundamental Tailwinds Gathering Strength While the technical picture is compelling, a confluence of fundamental factors is adding significant weight to the bullish case for Solana. The NFT Ecosystem Reawakens A notable catalyst has been a sharp resurgence in activity within Solana's non-fungible token (NFT) ecosystem. In a recent notable 24-hour window, sales volume for Solana-based NFTs experienced a dramatic spike, more than doubling from the previous day's figures and reaching well into the millions of dollars. This surge propelled Solana to become the second-largest NFT market globally by daily sales volume, trailing only Ethereum. This spike was largely driven by the explosive popularity of certain new collections, which saw their daily sales volumes skyrocket by orders of magnitude. Other collections also posted significant gains. While the broader NFT market has seen fluctuations, Solana's performance showcases a notable relative strength and a growing appeal for its high-speed, low-cost architecture among NFT creators and collectors. This renewed retail and speculative interest in Solana's NFT scene could be a powerful driver of market momentum. Bullish Bets in the Derivatives Market Sentiment among professional traders, especially in the derivatives market, has shifted decisively toward a bullish outlook. Open interest in SOL futures, which represents the total value of all outstanding futures contracts, has seen a substantial increase over the past month, climbing by several billion dollars. This indicates a high degree of speculative interest and suggests a growing number of traders are positioning for a future price increase. Furthermore, SOL's weighted funding rate has remained consistently positive for an extended period. The funding rate is a mechanism used by perpetual futures exchanges to keep the contract price in line with the spot price. A positive funding rate indicates that traders holding long positions are paying a premium to those holding short positions, a clear sign that the prevailing sentiment is bullish and traders expect the price to continue rising. The Institutional Stamp of Approval A steady drumbeat of institutional adoption continues to provide a strong fundamental floor for Solana's valuation. The launch and subsequent inflows into Solana-focused Exchange-Traded Funds (ETFs) in North America have signaled growing confidence from traditional finance. These products have seen millions of dollars in inflows on strong trading days. This trend extends to corporate treasuries. The listing of Solana-focused companies on major stock exchanges, holding significant amounts of SOL tokens, brings considerable Wall Street exposure to the asset. This institutional demand, coupled with whale accumulation, where large holders have been observed adding to their positions, provides a powerful source of buying pressure. The Alpenglow Upgrade Adding to the long-term bullish case is the anticipated Alpenglow network upgrade. Approved by an overwhelming majority of validators, this upgrade is set to slash transaction finality times significantly, bringing them down to a fraction of a second. This enhancement would provide Solana with Web2-level settlement speeds, dramatically increasing its competitiveness in high-frequency applications like decentralized finance (DeFi) and gaming, and potentially driving a new wave of developer and user adoption. Navigating the Hurdles: Resistance and Risks on the Horizon Despite the overwhelmingly bullish confluence of factors, investors should remain aware of the potential risks and key resistance levels that lie ahead. The symmetrical triangle, until a breakout is confirmed, remains a pattern of indecision. A break below the lower support trendline could invalidate the bullish thesis and trigger a move to the downside, with potential targets at lower support levels. Even with an upward breakout, the path to $230 is not without obstacles. Solana faces immediate resistance in the zone just above its current trading range, an area that has been tested multiple times. A more significant band of resistance is anticipated in the range between $210 and $250, where sellers may look to take profits. Furthermore, some on-chain metrics suggest that while momentum is building, some long-term holders may be taking the opportunity to distribute their holdings, which could create selling pressure. The broader cryptocurrency market remains subject to volatility, and a downturn in major assets like Bitcoin or Ethereum could negatively impact altcoins like Solana, regardless of their individual technical and fundamental strength. Conclusion Solana currently presents one of the most compelling risk-reward setups in the cryptocurrency market. The formation of a rare symmetrical triangle on its price chart, following a powerful rebound, has laid the technical groundwork for a potential rally toward $230. This bullish structure is not merely a product of chart patterns; it is underpinned by a potent combination of fundamental drivers. A re-energized NFT ecosystem, overwhelmingly positive sentiment in the derivatives market, growing institutional adoption, and a landmark network upgrade on the horizon all contribute to a powerful narrative of growth and expansion. While traders and investors must remain vigilant of key resistance levels and the inherent risks of the crypto market, the evidence suggests that Solana is coiling for a potentially explosive move. A confirmed breakout in the coming days could validate the bullish setup and send SOL on the next major leg of its upward journey, solidifying its position as a leading blockchain platform for the future of decentralized applications.