11.05.2025 tarihinde sembol BTC hakkında Teknik nevfell38 analizi

nevfell38
BTCUSDT Technical Analysis
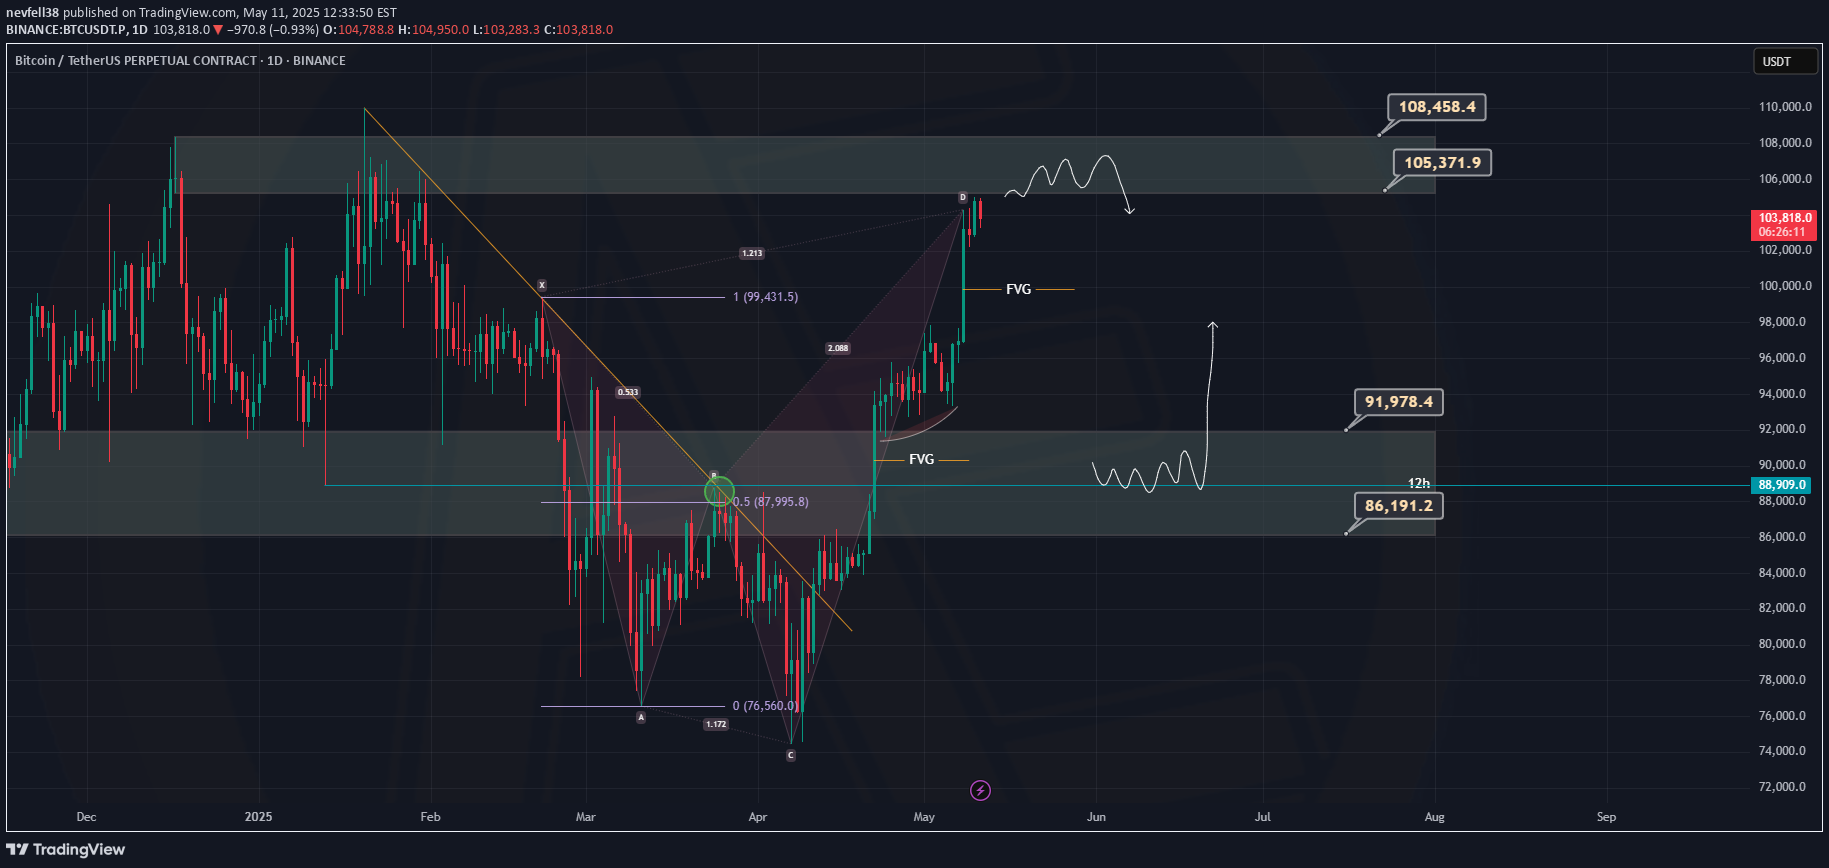
📊 BTCUSDT Technical Analysis – May 11, 2025Hello traders! 👋Here’s a fresh technical analysis on the BTC/USDT pair using the 1D timeframe. The chart highlights key supply and demand zones, harmonic structure, and two potential price scenarios for the coming weeks.📌 Key Levels:Support Zone: 86,191 – 88,909 USDTMid-Resistance: 91,978 USDTMajor Resistance Area: 105,371 – 108,458 USDT🔍 Technical Overview:After forming a strong bottom around 76,560, BTC reversed and surged upwards, filling the Fair Value Gap (FVG) created earlier.Price is now testing a critical supply zone. A rejection from here may lead to a pullback, possibly toward the 86k–89k range.If the support zone holds, it may act as a springboard for a new bullish wave targeting 105k and beyond.🧭 Possible Scenarios:Rejection at Resistance: Consolidation or pullback from the 105k–108k zone followed by downward movement.Support Bounce: Rebound from 86k–89k support area leading to renewed bullish momentum.Sideways Action: Short-term consolidation in the current price range before direction is confirmed.💬 What’s your outlook for BTC at this stage? Are you expecting a breakout or a pullback? Share your thoughts in the comments!🔔 Stay tuned for more updates and trade safely!