
wavepoint99
@t_wavepoint99

تریدر چه نمادی را توصیه به خرید کرده؟
سابقه خرید
تخمین بازدهی ماه به ماه تریدر
پیام های تریدر
فیلتر
نوع پیام
wavepoint99
MSTR - Rising Trend Channel [MID TERM]
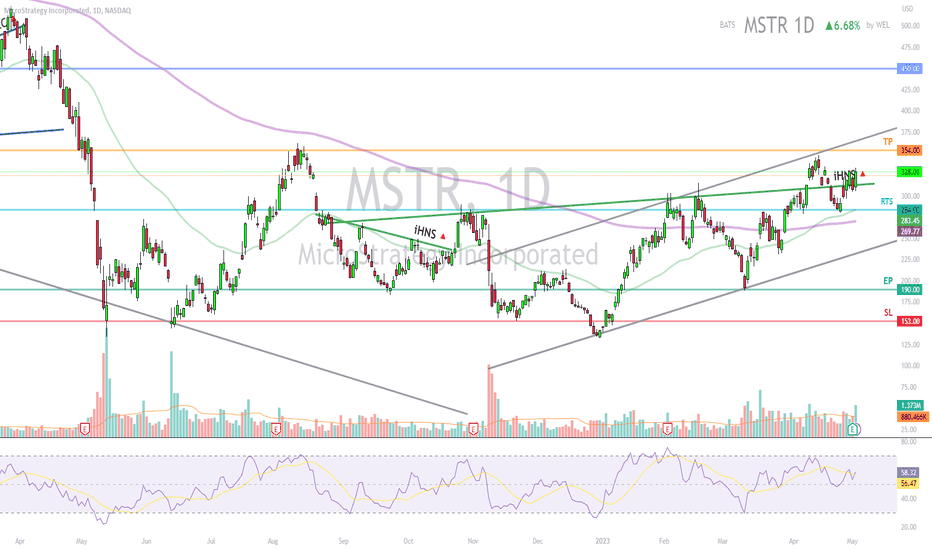
- MSTR در دراز مدت میان مدت پیشرفت قوی را در یک کانال روند رو به رشد نشان می دهد. - سهام تشکیل دهنده سر و شانه های معکوس شکسته است. - یک استراحت قاطع گردن در حدود 311 ، نشان دهنده افزایش بیشتر به 660 یا بیشتر بود. - سهام بین پشتیبانی در 284 و مقاومت در 354 است. - به طور کلی برای طولانی مدت از نظر فنی مثبت ارزیابی می شود. *EP: Enter Price ، SL: پشتیبانی ، TP: سودآوری ، CL: CUT LASS ، TF: TIM ، RST ، RTS ، RTS: مقاومت برای پشتیبانی از LT TP: قیمت هدف بلند مدت *الگوی نمودار: DT - Double Top | نزولی | RED DB - Double Bottom | صعودی | سبز HNS - Head & Shoulder | نزولی | RED Rec - مستطیل | رنگ آبی IHNS - سر و شانه معکوس | صعودی | سبز ابتدا آن را تأیید کنید و بعداً باور کنید. نقطه موج ❤
wavepoint99
ADAUSDT - Brreakout Ceilling of Falling Trend Channel [MID TERM

- ADAUSDT سقف کانال روند نزولی را در میان مدت درازمدت شکسته است. - ADAUSDT پس از شکستگی کاذب احتمالی شکل گیری معکوس سر و شانه ها واکنش نشان داده است. - شکست قاطع از طریق 0.40 دوباره سیگنال های مثبت جدیدی به ارز می دهد، در حالی که شکست در طرف مقابل شکل یک سیگنال منفی strong بود. - ADAUSDT از طریق پشتیبانی در 0.42 شکسته شده است. - به طور کلی از نظر فنی برای میان مدت بی طرف ارزیابی می شود. *EP: قیمت را وارد کنید، SL: پشتیبانی، TP: سود ببرید، CL: کاهش ضرر، TF: بازه زمانی، RST: مقاومت، RTS: مقاومت برای پشتیبانی LT TP: قیمت هدف بلند مدت *الگوی نمودار: DT - دو تاپ | نزولی | قرمز DB - دو پایین | صعودی | سبز HNS - سر و شانه | نزولی | قرمز REC - مستطیل | آبی iHNS - سر و شانه معکوس | صعودی | سبز اول آن را تایید کنید و بعد باور کنید. WavePoint ❤️
wavepoint99
DODGEUSDT - Rising Trend Channel

- DODGE در میان مدت در یک کانال روند صعودی قرار دارد. - DODGE در یک ساختار مستطیلی بین پشتیبانی در 0.06 و مقاومت در 0.10 حرکت می کند. - DODGE در نقاط 0.07 پشتیبانی و در نقاط 0.09 مقاومت دارد. - حجم قبلا در بالای قیمت بالا و در پایین قیمت پایین بوده است. - به طور کلی از نظر فنی برای میان مدت مثبت ارزیابی شد. *EP: قیمت را وارد کنید، SL: پشتیبانی، TP: سود ببرید، CL: کاهش ضرر، TF: بازه زمانی، RST: مقاومت، RTS: مقاومت برای پشتیبانی LT TP: قیمت هدف بلند مدت *الگوی نمودار: DT - دو تاپ | نزولی | قرمز DB - دو پایین | صعودی | سبز HNS - سر و شانه | نزولی | قرمز REC - مستطیل | آبی iHNS - سر و شانه معکوس | صعودی | سبز اول آن را تأیید کنید و بعد باور کنید. WavePoint ❤️
wavepoint99
ETHUSDT - Rising Trend Channel

- ETH در میان مدت درازمدت در یک کانال روند صعودی قرار دارد. - ETH در حال آزمایش مقاومت در سال 2000 است.- این می تواند یک واکنش منفی نشان دهد، اما پیشرفت صعودی در نقاط 2000 به معنای سیگنال مثبت است.- ETH از نظر فنی برای بلندمدت کمی مثبت ارزیابی میشود.*EP: Enter Price، SL: Support، TP: Take Profit، CL: Cut Loss، TF: Time Frame، RST: Resistance، RTS: Resistance to be Support LT TP: قیمت هدف بلند مدت اول آن را تأیید کنید و بعداً باور کنید. WavePoint ❤️
wavepoint99
BTCUSDT - Rising Trend Channel

- BTC در میان مدت در کانال روند صعودی قرار دارد. - در نمودار قیمت مقاومتی وجود ندارد و افزایش بیشتر نشان داده شده است. در صورت واکنش منفی، ارز تقریباً 25000 پشتیبانی می کند. - RSI منفی می شود. در مقابل قیمت، که نشان دهنده خطر واکنش رو به پایین است.- به طور کلی از نظر فنی برای میان مدت مثبت ارزیابی می شود. : مقاومت، RTS: مقاومت برای پشتیبانی LT TP: قیمت هدف بلند مدت ابتدا آن را تأیید کنید و بعداً باور کنید. WavePoint ❤️
سلب مسئولیت
هر محتوا و مطالب مندرج در سایت و کانالهای رسمی ارتباطی سهمتو، جمعبندی نظرات و تحلیلهای شخصی و غیر تعهد آور بوده و هیچگونه توصیهای مبنی بر خرید، فروش، ورود و یا خروج از بازارهای مالی نمی باشد. همچنین کلیه اخبار و تحلیلهای مندرج در سایت و کانالها، صرفا بازنشر اطلاعات از منابع رسمی و غیر رسمی داخلی و خارجی است و بدیهی است استفاده کنندگان محتوای مذکور، مسئول پیگیری و حصول اطمینان از اصالت و درستی مطالب هستند. از این رو ضمن سلب مسئولیت اعلام میدارد مسئولیت هرنوع تصمیم گیری و اقدام و سود و زیان احتمالی در بازار سرمایه و ارز دیجیتال، با شخص معامله گر است.