
iCantw84it
@t_iCantw84it

تریدر چه نمادی را توصیه به خرید کرده؟
سابقه خرید
تخمین بازدهی ماه به ماه تریدر
پیام های تریدر
فیلتر
نوع پیام
iCantw84it
XAUUSD Quick fast short to bottom if you need to make some back

افت سریع در اینجا برای به دست آوردن سود از دست رفته. توسط ICANTW84ITI نمی دانید که چرا آنها از تمام نمودارهای طولانی استفاده کردند زیرا مدتها بعد از این کار می کنم. من متنفرم از اینکه تصویر برای این 4 نمودار است با تمام یادداشت های من با هم جمع شده است ... اما من وقت زیادی برای تنظیم این کار قبل از حرکت نداشتم. 13 دقیقه در این حرکت وجود دارد که حرکت واقعی ممکن است تا آخرین دقیقه انجام نشود. یا آنها ممکن است این کار را برای همیشه متوقف کنند و ناگهان همه این کارها را در یک شمع انجام دهید. این می تواند مانند 19 شمع باشد ، می دانند که می دانم سریع گفتم. هر وقت من در تجارت بوده ام و فهمیدم که این اتفاق می افتد ، می گویم فقط منتظر آن هستم. ایده گنگ و هر وقت این اتفاق بیفتد ، در واقع همه در یک شمع روی من فرو می رود. اکنون که من سعی در به اشتراک گذاشتن آن دارم ، میزان کامل حرکت آن را به خود اختصاص می دهد. Lollol به این نگاه کنید که چگونه آنها آن را به آرامی در حال پیشرفت هستند و سپس مانند اوه خیلی عمیق است. آنها واقعاً سعی می کنند آن را بفروشند. شمع ها را هر کاری که انجام می دهد قبل از آخرین لحظه ، فروش شما را در مورد ایده آنچه می ترسید یا می بیشترین اتفاق را انجام دهید ، تماشا کنید. همیشه اگر دوست دارید آنچه را که من می گویم دوست دارم دنبال کنید و بیشتر از همه به صورت رایگان تقویت می شود ... و این به من کمک می کند تا بدانم که می بیشتر. با تشکر از شما برای بررسی من. من نگران این شمع نیستم که ساعت بالای آن را تماشا کنید ... اگر زیر 5 شمع قبلی در 15 بماند ، باید هنوز در حال حرکت باشیم ... هر اتفاقی می افتد. اما من فکر می کنم آنها فقط تا حد ممکن این کار را می کنند. با نگاهی دوباره به نمودار ، من تنظیم کردم که در آن خط TA را برای قطره قرار دادم و به آنچه ما داریم نگاه کردم و من هنوز درست هستم .. ما آن را نداشتیم. باید عمیق تر شود. و آنها با ما لعنتی می کنند. بنابراین آویزان محکم من نمی در پایان آخرین روز تعطیل برای هفته ، یک L بزرگ بگیرم تا این یک win باشد. همچنین میزان حجم آن را باید کمی کمتر از 5- 10 شمع بعدی بررسی کنید. البته آنها این شمع را با دکل کامل خاتمه می دهند. مورد بعدی باید سقوط کند اما جهنم هیچ چیز به این شکل پیش نمی رود. هیچ نوع دروغ از بین بردن اکنون LOL من حدس می زنم که ما فقط در حال آزمایش انتهای ساختار کم هستیم و فقط به سمت راست می رویم تا از ساختار خارج شویم؟ بگذارید یک بار دیگر را بررسی کنم وای .... فکر می کنم می بینم که آنها چه کاری انجام می دهند ، آنها به جای اینکه خیلی جلوتر باشند ، در حال ظهور حرکت هستند ، ما واقعاً به این بالاترین قله این حرکت بازگشتیم ، بنابراین مراقب باشید که می تواند راه اندازی شود و شما را سریع از شما برای تقویت استفاده کند!
iCantw84it
XAUUSD who's ready for another trade?
If you were trading with me yesterday I took you down a 6 hour tour of what XAUUSD was doing every move it made and every move I made. I am starting my prop trading test today. And yesterday was my preliminary test to see if I had my rule set down pat. Also, to see if I can guide others through it step by step. How many mistakes would I make? Were they Huge or small? Was I profitable or not? Did I obey by the rules or not? Could I make someone else money? Yesterday I made 16 Trades 3 losses so around 80% Trading the last trade was really just to see if I needed to continue or not and I shouldn't have made it. Only a $50 loss across each loss. Avg Trade was $200. Max open lots was 8 singles at one given moment and over half were around $300. My only regret was that I didn't catch the 90% pull back before it was too late. Need to come up with a better way for this, Which I believe I have with my new indicator that shows price under the lines. When it rotates to above it is very bullish in that moment even if all my other signals are saying its not going to turn completly or reverse me out of my trade. Had I caught it in time , I could have made profit rode it up and then back down. Which I had the trade channels set to do that if I wanted. So potentially somewhere around 3x profits or more realistically 2.25-2.5 profits because of slippage. I ended up with $2882 using singles on one move over 6 hours. Yes, I know I could have made a lot more. Another trader made 24k on the same move yesterday. However, this is new and I am trying to stay in my lane. lol Todays Trade.... Not sure up or down yet. Im coding a indicator right now for this using chatgpt trying not to waste my day too . but its consolidating so we should be good. im late getting in I will start this now. when the market closes I will close as well but when its back up at 6pm est I will start it back up.here is the inidicator i just created. for price projection based on other factors that influence it and supply and demand1901.41 is being pegged on a 4hr analysis of this stock and its contributors...Daily it says 1906.50 lolthree price targets 15 min 1900, 4hour 1902.19 Daily 1906.69Thanks you all know me well.... love the boost and we havent even cracked this open yet LETS GO!I'm not sure what I love more, finding a new way to create an indicator to solve a issue I want to see fixed.... or being right! lol I have the biggest grin on my face. Love making new things. This one is specifically tuned to GOLD. I love how hyper focused it is..Channel behavior goes something like this: 1. Drop in or pop up into new trading range. 2. Identify top and bottom of channel. 3. oscilate top to bottom. 4. when buyers or sellers over power one side you will manipulation to one side or the other. 5. The reaction will be a test to the opposite side and manipulation there as well. 6. test is over when price has either successfully made out of the othersides extremity to the channel. 7. if price fails to get back in channel it finds support or resistance depending on side and makes a move to continue in that direction. 8. if it makes it back in it follows these rules: a. if high drop low. if low go high. b. if up it drops to bottom of channel. to test downside c. back to mid of channel to test the upside. d. then back to bottom to manipulate bottom e. once outside of channel it either consolidates and is shaking out weak hands and absorbing shares . or drives down deeper to shake out weak hands again. f. then moves back to mid g. back to bottom of channel h. runs to top of channel i. if doesnt break through it runs back down to mid j. retest high k. drops back down to bottom of channel. l. if manipulated bottom it most likely will do this again. m. after succesfully breaking through to the bottom and manipulating it again.. it moves back to mid (this is called the spring in wyckoff) n. then bottom again to retest one last time. o. then launches to break through top of channel p. once its through it tries to find support on the top of the channel q. then trys to make a new high r. then finds support on top of the last high. s. trys to make a new high again t. then comes all the way back down to the top of the channel (called last point of supply) Phase C u. then makes it move to break away from the trading range. this is called phase Di could have the phases slightly off but the movements are solidWeakness fall out of channelprobably taking my $150 here as market will close soon. Ill set up to get in again as soon as it opens or at least stalk it until it gives me the oppurtunity3o min is actually moving up away from price.. going to hang tight to see what happensemotional push down out of channel?Nailed it !1st trade on my prop trading test. $116 Should of taken the $150.00 lol oh well curiosity killed the cat I am going to chill till market opens at 6pm unless you all have questions or want me to check something out for you?Going to open a video of my chart live streamLooking fo signs of life Lets see what we findadded another positionadded anotherabsorption hit again1903 price target on 15 minThank you everyone for the early boost it makes me feel bad to ask but i mean I called a no vol move to the upside and if you have been adding you should have around $150 thats worth a boost or two.. ;: )supportYea i knew i should of closed it out this move should have another urn up but it might be cooked.Slowly crawling back up if you look at the orange path i drew it should be about rightthanks again for all the boosts if you are half crazy and partially psychotic about being right you held here like an idiot... but clearly stop loss hunting manipulation its disgustingChannel rules for the win.... if it fails to break out here it will dumphere is a the same move i just moved the dots over sidewayswe break out of this im addingWe arent in the clear yet its gooing to look ugly herebasically the consolidation we just saw was the teal move... glad i could post it before it happened all the way lol if it dumps back in to the channel and heads to bottom I would consider taking the L just be careful if they cant find shares to break free it will drop down to shake out some.dont et too excited but if you need a small win...lord I do.... here is one... look who made it on top of the linesseriously you can fart and knock this guy off the lines lolAdded here...l might be a pull back to top of channel here so be carefulwhoa! that was painful. Outside of that, everyone you all are great we just passed yesterdays views by 150! Lets go! Thank you for all the boosts! Maybe one more for walking us through that trip through Skid row.....sketchy!Where them 50 rounds? So did you guys know I have my chart live streaming? click here tradingview.com/streams/L2QTFcMQYb/Whoa that changed up real quick.... i guess we can say this wants to move up with certainty now... look at the candlesjust lkilled 60% of my trades holding 2Lets get some BOOST people Lol WTF! what a great pay off387 Points Whoa!vol offset bullishDrop down to 1 when it broke the chanel it was making. lets see where it goesSorry talking to a friend i havent talked to in a hot min. going to add one if this breaks for a new high but it looks like its trying to down step. so i might close my last one here... soon and wait for another signal.. pls ask any questions if you have any if you havent... Hit me with another boostbe careful here it looks like pahse d where it jumps off a cliff. if it gets a lot of vol and moves back over that line I will addwaiting for the pull baack and then im adding oneif it dumps im out lolContracting and expanding . making nodes... interacting with the nodes and eventually making its way outadded to position again here most likely jumped the gun we will see avg vol is low like 39 push then pop might happen real quick to shake out shares and use that to launchthe new indicators lines are alive you can see them latch on to candles from under neath and fuel the move up.bullishlets get some more boost going pls... another move up for profitSpoke to soon looks like the opposite move double top failed to make the smae high could dump here take profits if you got it if you see it move downlook at the vol candles diminishing.. no interest in going down. I am looking an emotional push down and then a pop to the upside.it keeps stopping short it might dump and its acting like it wants to go to draw us in....we are going to move up and out of this box!
iCantw84it
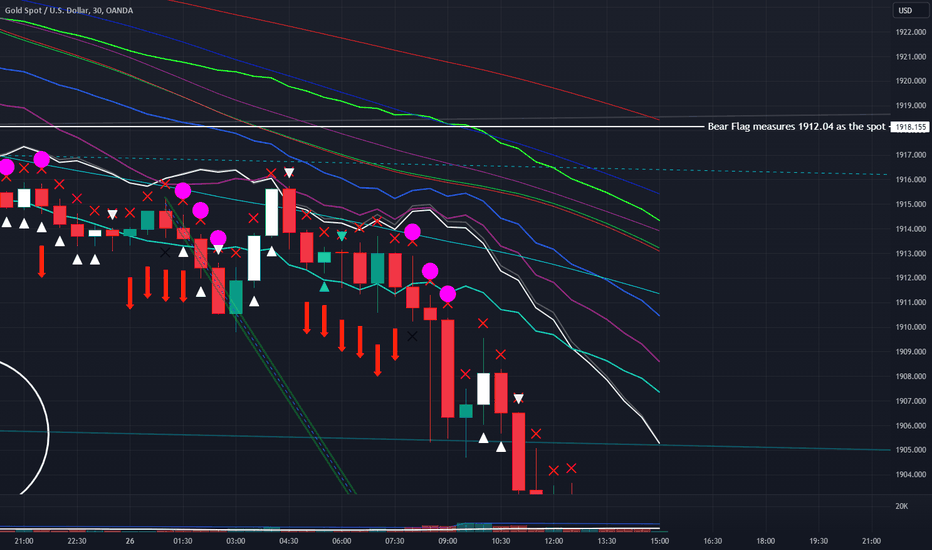
XUAUSD Next Stop 1905-1900 pls put trays in the upright position

Yes these lines might cause you seizures do not look at them if you have or a family member has experienced or has a history of having them. I am going to post two charts one is something I just made. so simple. and another is my indicator. both say market wants to dump to 1900ish-1905. this chart a signal when the market basically burps or farts....lol sorry but you aren't suppose to see it. I see it because I made my indicator with my own formulas. I use that symbol's candle that it is referencing and I can draw channels leading from it above and below price action using other price action. This shows me where price will go if it breaks out one way or the other. The other chart is an instant direction indicator which right now on a 15 min chart is showing both lines pointing down. the stronger the trend the straighter the lines and the closer together they are. you can switch down to a 1 min and see what the instant is.... if the red line is on top while moving up its a weak move... probably ignore that move. When green is on top its got alot more momentum to it. I normally add to my position when the red is on top and moving up. When it switches I start closing positions. Right now the market isnt running full steam but when it is there chart I am using is set to move against gold when the market is running up or down. depending on different metrics. Its kind of smart. Once I get it dialed in It should tell me where gold will be headed to. There is a .30 cent difference in price between the two with the market closed. I can imagine on really huge volume days this can have a massive divergence and push this. Thanks for taking the time to read. I love messing around with new things and this was fun. Please Like, follow and of course boost...as its free. And it shows me that you appreciate or want to see more of this. by iCantw84it 09.25.23actually 1912.34 would be a viable stopping point if you see a strong reverse here this would be solid.. ill post if I see soemthing first.1912.12 is where two paths crossAdded another positionpotential profits are: $110 $91 $50 $10 $-9Target potential: 177 ptsthats $885 from here if it can maintain this move downIf you jumped in when I posted this you would be $100 on 1 contract to the good. Thats worth a boost dont you think? o.0not counting the emotional candle just nowthis move is strong look how the red is on touching the other linemaybe over if this closes on or over this....hang tightstill cliff hanging like sylvester stallonstill hanging I have a im stupid i should have closed this 1 line ago line.. but watch hang onWhat can i Say I'm a dual pistoleer!You guys are stingy with the boosts! what would you like me to do? I already called the move, stopped the close to the move up.... back to profits on the move down. and did it with dictating every part of the move in annotations. Would it help If I said I was cooking and dancing at the same time?I get it you closed your position didnt you? I feel you I wouldnt want to tip a wizard for shooting lightning out of his fingers into the air and striking down a flying dragon. o.0Increased buying int his area.Thank you whom ever Boosted you are a true boss!Because they boosted check this out. with the Volumetheres more if you keep boosting I will keep digging deeperWhoa you guys are hungry don't worry I have big spoons lets get into this. here is some more on the vol and distance.and another close preventedCheck this out... I was wondering why it stopped short and found thisFeel free to ask my questions about this stock or anything I am doing aThank you for all the boost I will pick some things to talk about but if you boost pls ask me anythingease of movement ? new higher lows but no higher highs? yetExplaining the lines and the symbols above priceWhen White is above Price action it causes pressure to push down. When it touches price it causes pressure to push down. If it comes up from the bottom and crosses price action to go above. I call that the Death Cross. Price Dumps!Death Cross Started this move downMore vol comparisonsIf you will look at the two candles you can see that they didn't break the high of the one candle. BearishAdded oneWatch out this thing might sling shot hereChannel the indicator and watch for over bought or sold conditions on the flyBreaks out over if it hasnt found support it will most likely dump to find support and if it fails it dumps to continue move. If it drops low it will move tot he top of channel and manipulate the high could also be a move to break out. Same with Manipulating the high first. It will dump to manipulate the low or break out of channel and dump to next channelWant this to reverse? Here's how we will know it has. Atleast one Part. there are about 5-10 different ways using this one indicator.More Reverse Signalsdifferent variation of the momentum indicatorfirst version of momentum indicator...At this point we are about 150 pts, although a lot slower to get these last 50 points. That would be another $50 bucks on 1 contract. Now if you have been adding we should be at .....Potential profits from adds: $180 $160 $124 $65 $84 $-20 Its moving lol and yea I got in too late on that big push down. thats $627 from what was $250 on last update to profits. Thats worth a few more Boosts I think lolYou's all are Great Thanks. Someone ask me about something on here. I can keep picking random things?Bullish moves in motion... dont lose profits... watch closeBearish still for me1 Min Bearish flagsLooking more and more like it will make a stand here... this is a 3 min chart. moving toa 5 min nextthis is interesting. Makes me think after these reds there will be more green trying to test upside vol and distance.. or demand and ease of movement. So far half the vol took 5 candles to get half way. not truly easy going up. but Vol is on par.here are some potential ways this move can play out.Another thing to keep in mind is the whole point of moving down is to find buyers that will hold on to shares longer. This whole time the vol has been diminishing. Meaning there are stronger hands holding these shares. Proof: There is less shares to trade each time or time period. Which is why the movement has been so much slower. We are hitting Absorption. Every good ansorption will have whats called a red push or in this case a green push up that will cause people to drop shares and take profit etc. this will flood the float and dilute the value causing price to drop again. unless there is a massive demand spike at this level that starts staking buyers greater than sellers. at that point this will launch. most likely not going to happen until 8am -9am-10am eastern time. All this is the ground work to set up a run . That said. if that is true then this move is to drive this deeper in the dirt and free up shares because its become so slow. its no longer cost efficient to get it to the price we need to get to where the pocket of deep pocket buyers are waiting. My best guess is either 1912 or 1900 which is the whole purpose of this trade. Either I am right or We just missed alot of profits lol15 min time frame has all the lines pointed up but they arent together, nor are they below price action. This isnt ready. This is a 90% move back to the start to shake out shorts and any buyers who want to ride this up and to trap fomo buyers as it goes up. if it was the real deal... it would be moving a lot faster. if you notice all the candles are really small. only the last 3 candles are of size. thats fomo but fomo with this draw down and if it was absorbed with Demand Spiking it would be really large candlescommitted to the upside candles for referenceadded to my position also showing what happens once it breaks the channel.Something to watch out for... this could have issues breaking the middle of the channel if that happens and it makes a move back to the top... two things can happen. 1. it will attempt to break and succeed if it does it needs to find support. 2.it fails and falls under the mid and test the bottom or more than likely drops below channel where it will attempt the same test as the high. if it fails it will continue to my price target.Going to add another if it clears the low of these two candlesFlags re-emerging on the 5 min timeframeAdd position update will most likely take profit on 1 or 2 once we clear the bottom of this move again. and then when we clear the bottom of the previous move.*** Future self*** When speed drops to .011 on the 5 min for any given length of time like over 30 mins to an hour..... Look at taking profits and potentially riding this up or just taking profits on most of my positions so I can reload and double my profitBearishwe are close.... I think this deserves another Boost... lolIf I am right 2:30 is the close to one of the europe Markets or somewhere over there past it.. lol so we should see some activity here coming inI would get in close here.. its so close it can turneither we are moving under these lines again or we are about to launchCome on wheres the boosts don't make me start making anaolgies about wizards and dragons again.... $909 at this point.. could have doubled that but its ok... this was a learning experience for everyone including me. thanks for joining me. I appreciate the follows and likes and boosts!Thanks Zak you are true boss! just for that the price is going to drop more for you. lolAt this point I am looking for an emotional candle that desimates everything else on screen or atleast over the last 17 to 31 candles. This will be the sellers climax and this i will be the Change of character that sets up the reverse or continuation of this move.Sorry slow on getting to this because its so LONG the post. lol Less vol on last red compared to the two greenLadies and Gentlemen with this we Cracked into 1912's Still doubt we are going to at least 1912.04 ish....??? Fomo will kick in if it keeps dropping which means free ride down here we goNope not enough$ 1500 right here nope $1600 nope there it is emotional drop fomo $17501.1k vol this is the candle we are at 1911.95 took $300 off table $1500 left might take another soonBy the way We made it to 1912 now is this the end of this move or are we going to 1900 like I first said? Vote in chat pls.More Boost pls lol I think I earned it. $2k move here if you have been with me from the start,,, could have been $4k if I got out and rode it down again.Flags!Back under the lines going to be hell getting back over.... At least I hope lolSee most people get excited about the cash....no not me.... I love it dont get me wrong.... whats better than the cash? Being Right! lol it can be a curse and it can be a blessing. I have been working on being ok with being wrong. and that has helped my trading a lot. Thanks again to everyone whos been with me this whole time. I think this trade is just starting. Im back to $1700. might take one
iCantw84it
XAUUSD 3rd trade today headed to 1923.50

Xauusd من در حالی که بازار پایین است ، فقط به تجارت این کار رفته ام. با نشانگر من به طرز باورنکردنی قابل پیش بینی است. من نقاط لنگر را برای جایی که کانالها از آن سرچشمه می گیرند و پرچم هایی برای هنگام خسته شدن تقاضا دارم ، دارم. خطوط برای عقب کشیدن. و سرعت ناچیز ساخته شده برای حرکت در حرکات در صورت وقوع یک اتفاق معکوس. هدف باید 1924.50 تجارت سوم روز باشد که هر هدف 1-2 روز پیش ترسیم شده است. pls دوست دارد و رایگان آن را تقویت می کند. توسط icantw84it 09.22.2315 دقیقه برای جزئیات بیشتر در مورد برنامه Tradesi در گرفتن 25 ٪ تخفیف از جدول در صورت نگه داشتن این خط ... جایی در حدود سال 1925on 15 دقیقه اگر فقط منتظر پایان این ادغام باشید ، نمی دانید که وقتی یک فشار عاطفی عظیم وجود دارد ... تصور می کنید که شما می بینید که می بینید و از بین می رود و از بین می رود و باعث می شود تا از زمان پایین آمدن پرچم ها را ایجاد کنید و از بین می رود. جعبه اطراف این ادغام می توانید آن را در قسمت بالا آویزان کنید ، سپس قطره به پایین بازدیدهای پایین را دستکاری می کند ، سپس باید دوباره کمترین را دستکاری کند و سپس برای پشت به وسط یا اگر بسیاری از فعالیت ها به پایین و سپس از بالای جعبه خارج شوید. فرصتی وجود دارد که ما ممکن است آخرین فشار را بدست آوریم اما بعید به نظر می رسد ... دقیقاً چه اتفاقی می افتد به جایی می رسد که در حال شکستن و متوقف کردن تا EOD است و سپس عملکرد قیمت را به hit دستکاری خود را دستکاری می کند و آن را به سمت بالا می برد ، بنابراین وقتی دوباره شروع به تجارت می کنید ، خیلی منفی هستید. اگر در 30 دقیقه بعدی حرکت نکند ، احتمالاً سود من را در اینجا کمی به دست می آورد. ما 1000 دلار بیمار می شود که به اینجا می رویم که چگونه آن را لرزاند ... این احتمال وجود دارد که به hit هدف من پایین بیاید اما در این مرحله از روزی که آنها امیدوارند تجارت خود را باز کنید و سپس آن را 100-200 pts حرکت دهید تا حساب خود را حداکثر کنید یا از دست دادن توقف خود سفر کنید. ارزشش را ندارد بسته شدن 5 معاملات مجرد در حدود 200-300 امیدوار بود که به 500 نفر برسد اما زمان تمام شد. مانند دنبال کردن Boost اجازه دهید دوباره این کار را در sun یا دوشنبه انجام دهید.
iCantw84it
Watch this move....ANKR Crypto on new cycle indicator
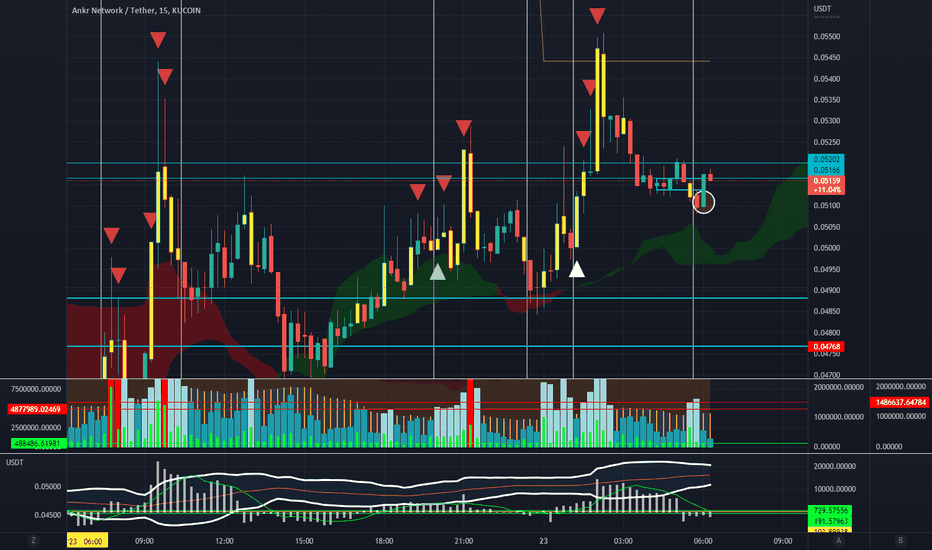
استفاده از chatgpt برای ایجاد نشانگرهای جدید...اگر بتوانید در مدت 1 دقیقه به این موضوع نگاه کنید بهتر است.....اما شاید با گذشت زمان شما هم بتوانید آن را ببینید. توسط iCantw84it02/23/23اگر این جالب را پیدا کردید لطفاً مانند / دنبال کنید و مهمتر از همه تقویت کنید. متشکرم میدانم که من وارد جزئیات زیادی نشدم، اما فقط میخواستم این حرکت را علامتگذاری کنم، زیرا آن را کنار هم قرار دادهام و میخواهم چند معامله زیر کمربند آن داشته باشم. باز هم با تشکر.
iCantw84it
TRXUSDT using trigger on 8hr and 20 min Trigger .62704
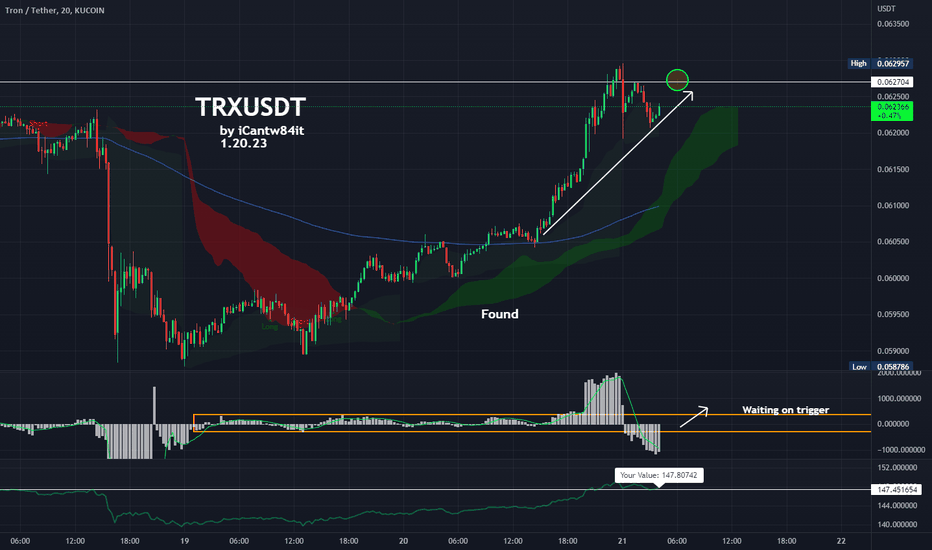
داشتم تریگر خود را به مدت 8 ساعت آزمایش می کردم و با این رمزارز روبرو شدم. حرکت زیبا است و آماده پاپ است. پتانسیل پاپ زیاد هنوز منتظرم که میزان صدا به بالاتر از میانگین برسد تا ماشه من را فعال کند. اگر این کار را انجام دهد می تواند اجرای خوبی باشد. من همچنین این را با همان ماشه در یک 20 دقیقه ردیف کردم ... فریم های زمانی بزرگ و کوچک فراکتال را در کنار هم قرار می دهند که چه چیز دیگری را می خواهید_. توسط iCantw84it01/20/23
iCantw84it
LUNCUSDT just finished the bottom bounce Launch Time

LUNCUSDT به تازگی پرش پایین را به پایان رساند. معمولاً حرکت از توزیع به انباشت مانند قطرهای است که تثبیت میشود، سپس پرش میکند و بالاتر از خط پایه خود تثبیت میشود... (که فشار به پایین در وسط ادغام قبل از توزیع است) سپس پس از تثبیت بالا دوباره سقوط میکند تا زیر را دستکاری کند. خط مبنا برای شکستن ضررهای توقف و جذب بیشتر شناور. سپس یک حرکت به بالاترین سطح پس از جذب که در نمودار نشان داده شده است با حجم نشان داده شده است که در 6 شمع گذشته 38 میلیارد حجم داشته است ... در آخرین شمع به تنهایی 34 میلیارد وجود دارد. این سیگنالی است که جذب کامل شده است و اکنون دوباره درست در زیر ناحیه ای که قبلاً نمی توانست از آن عبور کند، بالا می رود. سپس وقتی آماده شکستن است، دوباره پایین میآید تا خط ایجاد شده را بشکند و به سمت بالا حرکت کند که همه فکر میکنند safe است تا ضررهای خود را قرار دهند... این خط را میشکند تا آخرین قسمت باقی مانده از شناور مورد نیاز خود را جذب کند. برای شکستن منطقه ای که نتوانسته از آن عبور کند. دلیل طولانی بودن آن در این منطقه این است که این الگو را در هر خط زمانی انجام داده است و منتظر بوده تا هر کدام این حرکت را کامل کنند. اکنون که در این مرحله هستیم، می تواند حرکت خود را برای کسب سود آغاز کند..... امیدواریم که در این مرحله به همان اندازه که در مرحله قبل انجام شد طول بکشد.... smhby iCantw84it10.31.22فقط 4 روز تاخیر اما همچنان. ... زمان بندی بر این اساس است که آیا جذب اخیراً در اینجا موفقیت آمیز بوده است، تنها زمانی است که بازار فوراً واکنش صعودی نشان نداده است... مطمئن نیستم این به چه معناست، اما اگر مجبور باشم حدس بزنم یکی از دو چیز است. 1. ایمان مصرف کننده متزلزل شده است و افراد کمتری خوش بین هستند و شروع به شک کردن در تصمیم خود کرده اند و ترس در حال فروکش است که به این معنی است که آنها پول خود را بیرون می کشند. نهنگهای بزرگتر میخواهند وارد شوند و ما همه سهام را داریم و تنها راه برای گرفتن سهام از ما این است که آن را عمیقتر از مدتی پیش ببریم و تلههای کوچک گاو نر ایجاد کنیم تا دستهای ضعیف خردهفروشی را از سهام آنها خارج کنیم. بنابراین آنها می توانند با تلفن تماس بگیرند و تمام سود را به دست آورند. من می یک سومی بدهم، ممکن است هر دو درست باشند زیرا ایده دوم در نهایت باعث می شود که ایده اول به واقعیت تبدیل شود....... .... در یک بازار معمولی، زمان بندی این حدس های آموزش دیده در مورد زمانی که ظاهر می شوند به درستی انجام می شود .... بنابراین چیزی که می توانید از آن بگیرید این است که قبل یا بعد از زمان پیشنهادی تقریباً در داخل یک شمع ظاهر می شود تا دستکاری. در یک پایین و خرده فروشی کاری را انجام می دهد که برای انجام آن برنامه ریزی شده است. وقتی زمانبندی تعطیل است، به این دلیل است که خردهفروشی از آنچه مؤسسات میخواهند پیروی نمیکند و یا دستکاری میشود. همانطور که من زمان بندی می کنم پاسخ طبیعی خرده فروشی به روانشناسی است که algo خرده فروشی را در معرض آن قرار می دهد. افکار خود را به من بگویید. و مبادله مبارک.. من تقریباً در حال معامله بلندمدت هستم تا زمانی که دستکاری کاهش یابد. تصویر جدیدی از آخرین دوره ادغام و فعلی در زیر پست کرد... این باید به ما ایده دهد که این مدت چقدر است algo اگر خردهفروشی همان دفعه قبل پاسخ دهد و مؤسسهها هنوز خردهفروشی را در جیب خود داشته باشند، جواب میدهد. 1.6 میلیون از USDT تأیید شده برای رفتن به LUNC توسعه و اتصال آن به Tendermint و وانیل Cosmos و Casm Wasm. .... نسخه 2 چیز دیگری است که من در لیست به روز رسانی Terra Rebels دیدم. مدل رشد همچنین شامل پرداخت یا مشوق مبتنی بر ایجاد و پیاده سازی در استفاده از dapps برای LUNCComing پایین برای قرار دادن پا در بالاترین حد پایین است. فقط ساخته شد... باید از آن برای شکستن اوج استفاده کرد. پایان چرخه 7 نوامبر 2022 ساعت 7:57 صبح باید از اینجا شروع به حرکت کند. متوقف شدن و آزاد کردن سهام برای شکستن آخرین رکورد. اگر این به تجسم آن کمک می کند .... تصور کنید که تمام بازار این 3 چیز است: شکستن بیرون شکستن سقوط تجمیع گاهی اوقات شکست و سقوط و شکست بعدی به دلیل مقدار خرده فروشی که آن را فشار می دهد واقعاً به یکدیگر نزدیک هستند... هرچه خرده فروشی درون خطی تر به algo باشد در الگوهای عمودی تری حرکت می کند... هرچه خرده فروشی کمتر به صورت خطی باشد این الگو را گسترش می دهد. کمتر شبیه سوزن ها و بیشتر شبیه W و M های کشیده شده گسترده هستند. این algo خرده فروشی دستکاری برای قرار گرفتن در سمت راست حصار است. هنگامی که یکپارچه سازی را در دوره های طولانی مشاهده می کنید، آماده می شود تا خرده فروشی را تغییر دهد یا آزمایش کند تا ببیند در کدام طرف حصار قرار دارد. اگر آنها در سمت راست نباشند، بلافاصله یا بلافاصله پس از یک جهش قیمت که به سرعت محو میشود شکست میخورد... در این مرحله algo باید سهام ارزانتری پیدا کند و سهام بیشتری را آزاد کند. شناور را جذب کند و خریداران خرده فروشی بیشتری پیدا کند که از کاری که می انجام دهد حمایت کنند.
iCantw84it
LUNCUSDT Pop set up to launch

این شمع را در ساعت 20:00 تماشا کنید. من از نمودار متفاوتی در آخرین پست خود استفاده می کنم. باید همینطور باشد اما من بازه زمانی کوتاه تری می خواستم. تئوری چرخه، باید یک تست برای خرده فروشی در اینجا داشته باشد و باید ظاهر شود. توسط iCantw84it09.12.22
iCantw84it
LUNCUSDT Terra Classic setting up for a Pop @ 8pm est

ساعت 8 شب این شمع را تماشا کنید. باید روی پاپ تنظیم شود. توسط iCantw84it 09.12.22
iCantw84it
LUNCUSDT about to pop again

بر اساس تئوری چرخه و بر اساس نمودار 1 دقیقه ای، قیمت باید در فضای ابری کاهش یابد و در 30 دقیقه آینده دوباره ظاهر شود. تغییر جهت باید در ساعت 19:59 به وقت تخمینی شروع شود و فشار بزرگ دیگری باید دنبال شود. توسط iCantw84it09.05.22
سلب مسئولیت
هر محتوا و مطالب مندرج در سایت و کانالهای رسمی ارتباطی سهمتو، جمعبندی نظرات و تحلیلهای شخصی و غیر تعهد آور بوده و هیچگونه توصیهای مبنی بر خرید، فروش، ورود و یا خروج از بازارهای مالی نمی باشد. همچنین کلیه اخبار و تحلیلهای مندرج در سایت و کانالها، صرفا بازنشر اطلاعات از منابع رسمی و غیر رسمی داخلی و خارجی است و بدیهی است استفاده کنندگان محتوای مذکور، مسئول پیگیری و حصول اطمینان از اصالت و درستی مطالب هستند. از این رو ضمن سلب مسئولیت اعلام میدارد مسئولیت هرنوع تصمیم گیری و اقدام و سود و زیان احتمالی در بازار سرمایه و ارز دیجیتال، با شخص معامله گر است.