derJessie
@t_derJessie
تریدر چه نمادی را توصیه به خرید کرده؟
سابقه خرید
تخمین بازدهی ماه به ماه تریدر
پیام های تریدر
فیلتر
نوع سیگنال

derJessie

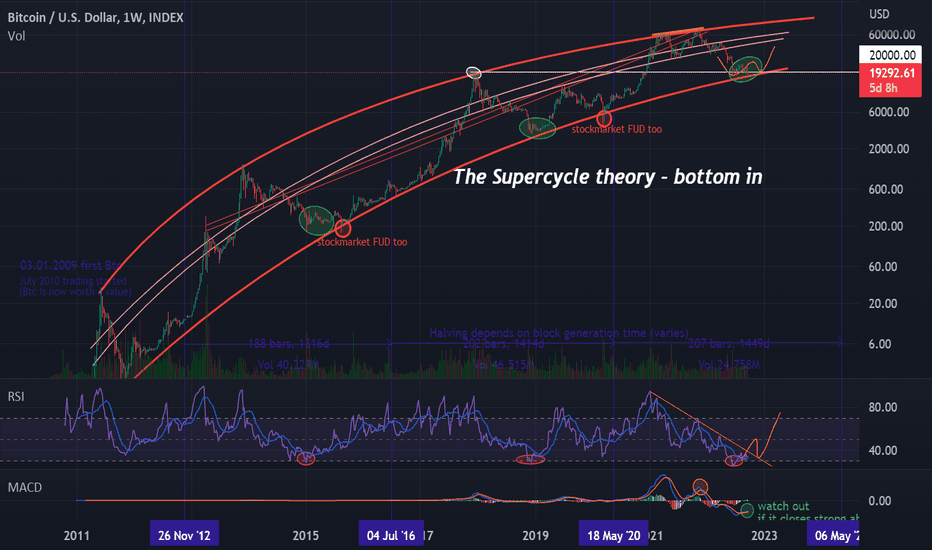
Bitcoin Supercycle theory - bottom in Bull theory – Bottom is already in for Bitcoin BTCUSD There are severeal technical indicators and measurements that suggest it could be. Firstly, the 50-week MA already crossed the 100-week MA. Each time this occured, the bottom was already in, both times as the weekly RSI dipped into oversold conditions. The price behavior has also been similar to the 2014 bear market for months with a drawdown of -53% below the 50-100WMA. (-But there is more time for that special fractal in another post.) Secondly, this current level happens to be a 0.786 Fibonacci Retracement of our entire run up from Covid-19 to the November top in addition as it is the support oft he previous all time high(2017). Furthermore sitting right now on the weekly 300MA. The Fear and Greed Index has only registered prolonged periods in Extreme Fear(below 10) as we have witnessed at the 2018 capitulation bottom and the 2020 Covid-19 selloff. Therefore the capitulation happened in June, with Luna (+UST), the depegging of USDT, 3AC, blockfi, Celsius… which are all max fear events. But everyone is now expecting 13-15k thinking we are in the middle of a bear market rally. While the GBTC Grayscale Bitcoin Trust value sitting already at chart comparable 11k. From technical analysis we couldn’t have bottomed more. Even on chain indicators signal the bottom is near. NUPL, RHODL Ratio, Puell Multipli, Entity adjusted Dormancy-Flow, MVRV-Z Score, 2Year MA Multiplier, CBBI-Bull Run Index. We have already seen arguably the most extreme network capitulation in Bitcoin‘s history, with now also a Hash Ribbons blue ball on the daily timeframe. Bitcoin is trading at a fair value. I am still hoping for an expanding flat 3-3-5 elliot wave correction, a double three WXY pattern, or even a simple overshooting B of an ABC. But if that 17,6k gets structural taken out we are not talking about recession but deflationary depression and just the start of a longer bear market. Fortunately the global narrative is shifting. People are now saying we are going into a deep recession. CNBC‘s Cramer saying to avoid all speculative investments like crypto, while the worst is priced in already. It starts to look like the main worry is becoming recession with deflation and not inflation now. That idea gets strengthened by US-CPI showing a second month of decline. Based on the 5-year break-even inflation rate, a leading indicator, it can already be said with certainty that we have seen the short-term peak in inflation. And that inflation is expected to recover further through 2023. Keep in mind every time inflation tops - Stock market rallies! Once the consumer price index print comes in significantly lower (September~7,9% but October ~7%) the stage will be set for a Powell flip flop. FED pivots systematically lead to strong rallies. So November FOMC potentially for a midterm or year-end Christmas rally. This means that the Fed will step back on better CPI-data and inflation will eventually start running again in 2023. Nobody does see a fruitful future for investments right now. To trick the retail there is no need for a positive narrative so everyone keeps being bearish. Only technical analysis matters. Afterwards we will see what the news catalyst was. Btc may range more than equities first, then rotation into more risk happens later. Hence Bitcoin Dominance will rise and Altcoins will pump after Bitcoin. But Btc is not yet in a multi-year bear market within its 4 year cycle because BTC.D would be at that point much higher while we are seeing new 4 year lows. Something is different. As a trader you have to adapt the possibilities. Invalidation of that bull scenario if we set a new low in Bitcoin. Then there will be much bigger problems in the market. So all eyes on the DXY and the behavior oft he FED, because Btc is at this time just the risk-taking follower of Nasdaq and SPX. Special greetings to Blockchain Backer, following him for almost a year.Comment: Nothing changed, BTC still in the range. Oscillators show it may take a while. My beds are that 17.6k will be the bottom if the global economy will allow that to remain true in the next months. My advice, don't listen to fud from the news around you. Stick to your plan and don't forget every Wyckoff Accumulation has a spring (at least a second test of that low). At 18k there are a lot of liquidations, stay alert.Comment: In the last few days we have seen another media capitulation event. First the dispute between Binance(CZ) and FTX(SBF) and then the unreal bankruptcy of Alameda and FTX Group(second largest crypto exchange). It is an absolute scandal that speaks against the industry and for much-needed regulation. How the consequences will affect the market and whether other companies will go bankrupt as a result is not yet foreseeable. Fear across the market with USDT depegging again, confidence is at an all time low. There is extreme skepticism of crypto right now. Who in their right mind would buy? Well, there has never been a bottom that is exiting, they are always horrifying. Chances of it being bottoming formation have dropped drastically after 17.6k has been taken out structurally. The Wyckoff Accumulation schematic with PO3 is the only last bullish hope. For this, 21.6k must be reached as quickly as possible with an impulsive bullish upward movement. A weekly close back inside the range would be a good sign. If we don't get consistently above 18.5k BTC again in the near future, this was just the bearish retest by positive falling inflation numbers and we will see much lower prices and spend even more time down here until next halving in 2024. Everyone calling 10-12k next targets may be right as a stock index correction can be expected. Don't forget, there is also a CME Futures opening gap at 9.7k BTC from 07/27/2020. Crazy times but stick to your plan.Comment: Nothing changed - volume decreases. Let's see if the new year invalidates this idea!Comment: Initial range target hit. Update: Small changes in expansion size after new impulse structure.

derJessie

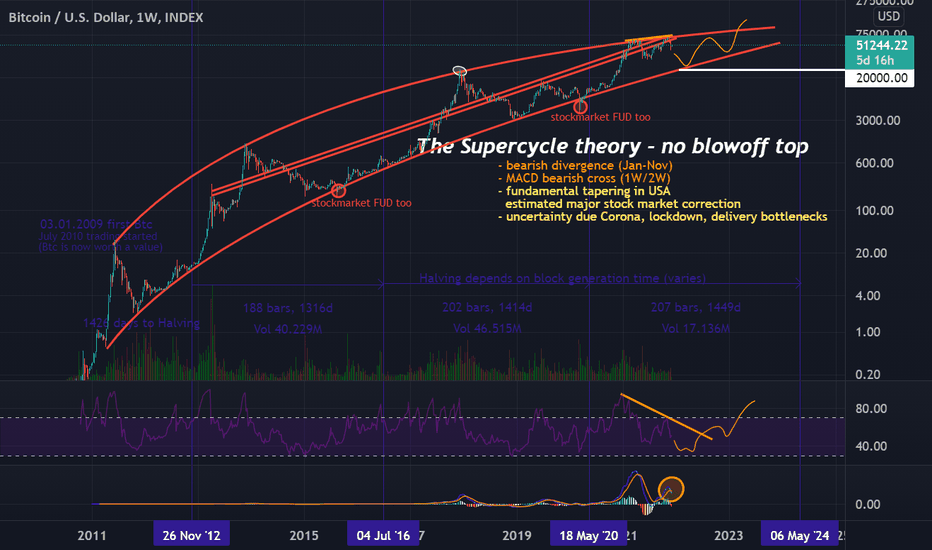
BTCUSD احساسات و ترس نزولی در بازار، بنابراین پیشبینی احتمالی کمتر سودآوری برای آینده است. جمعیت کریپتو انتظار داشتند در سهماهه چهارم سال 2021 یک صعود سهموی داشته باشد، مشابه بالاترین رشد 2013 و 2017. تاریخ تکرار می شود اما برای همه فعالان بازار بسیار آسان و قابل پیش بینی بود. یک دلیل معمولی که چرا دقیقاً این اتفاق نمیافتد. مشکل این است که ما چرخههای کافی برای مقایسه نداریم تا بدانیم چگونه Bitcoin و کریپتو با رشد آن تغییر میکند. با مجموع ارزش بازار کریپتو بالاتر، چرخههای طولانی/طولانی داریم. . این بدان معناست که ما دوره های گاو نر طولانی تری داریم و به دنبال آن بازار نزولی کوتاه تری داریم. همچنین بازدهی کمتر در کوتاه مدت به دلیل شتاب سهموی کمتر. این احتمال وجود دارد که از آنجایی که در ژانویه 2021 به ارزش کل بازار 1 تریلیون رسیدیم، در یک چرخه طولانی super هستیم بدون اینکه دوباره شاهد افزایش قیمت باشیم. این به معنای پیش بینی نزولی برای هفته های آینده و سه ماهه اول 2022 است، اگر تا آن زمان بالاترین سطح را ندیده باشیم. محرک این فرض، شاخص های تحلیل تکنیکال است. به خصوص رسیدن به منحنی بالای لگاریتمی قرمز با دو خط حمایت/مقاومت مورب در وسط. این از سال 2011 در حال گسترش است و پس از آن قادر به پیش بینی محدوده قیمتی بود. این ما را در چند ماه آینده به حداکثر 20 هزار دلار در هر bitcoin می رساند. همچنین یک آزمایش مجدد از رنگ سفید برجسته شده در سال 2017. هرگز چنین آزمون مجددی وجود نداشته است، اما می تواند با تئوری چرخه super مطابقت داشته باشد. شاخص های دیگر یک واگرایی نزولی با رنگ نارنجی در RSI (کاهش شاخص قدرت نسبی همزمان با افزایش قیمت ها) از بالای ژانویه (65k) هستند. ) تا بالای نوامبر (69k). اگرچه قیمت ها در حال افزایش است، اما دیگر حجم و قدرت خرید زیادی در بازار وجود ندارد. این بدان معناست که بازار ممکن است با تغییر روند و اهداف قیمت پایین روبرو شود. متقاطع نزولی آبی در MACD (میانگین متحرک همگرایی/واگرایی) نیز این را نشان می دهد. در راستای محرک تحلیل تکنیکال، دلایلی برای این اصلاح نزولی به دلیل تأثیرات بنیادی خارجی وجود دارد که می تواند همچنان تأثیر منفی بر همه داشته باشد. بازارهای مالی، که با رنگ زرد توضیح داده شده اند. هیچ کس نمی رویای قابل پیش بینی کریپتو تا کنون پایان یابد، اما چرخه super نتیجه پذیرش گسترده و چشم انداز خوبی برای یک بازار تنظیم شده سالم است. حتی اگر این بدان معنا باشد که ما یک ضربه سهموی بزرگ بدون حجم زیاد و در حال حاضر حتی توجه رسانهها نداریم. این تحلیل در بازه زمانی هفتگی انجام شده است. در نتیجه، برخی از data برآورد شده و دقیق نیست. بازارهای سهام اصلاح شده است. سناریوی نزولی محتملتر انجام شده است. در روزهای آینده تحلیل بعدی را ارائه کرد.

derJessie

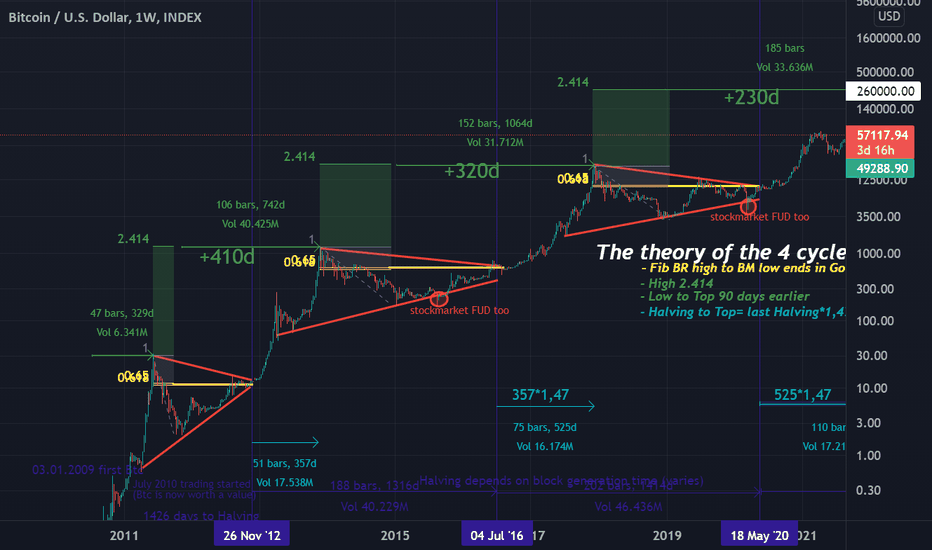
BTCUSDA بر اساس این نظریه، بر اساس این فرض که ما قبلاً 3 چرخه داشتیم (2011 یک چرخه است) برای چرخه چهارم در دسامبر یا سه ماهه 1 2022 هیچ نقطه بالایی دید. هر تاریخ نصف کردن Bitcoin برای تجزیه و تحلیل مهم است. که از طریق آن می توان ساختار واضحی را تشخیص داد، زیرا روند صعودی قوی رفتار خرید افراد روانشناس می تواند پس از آن به دلیل کمبود بعدی عرضه آغاز شود. با توجه به زمان تولید بلوک فعلی، تاریخ نصف شدن بعدی 6 مه 2024 در نظر گرفته می شود. از نصف اول در سال 2012 تا بالاترین قیمت، 357 روز بود. از نصف شدن بعدی در سال 2016 تا اوج 525 روز بود. افزایش زمانی 1.47 نسبت به آخرین اجرا. اگر این مقدار را به عنوان یک عامل ثابت مربوط به چرخه قبلی در نظر بگیرید، از پایان ژوئن تا آغاز ژوئیه 2022 به هدف قیمت بعدی رسید. هر چرخه قبلی به بازار خرسی ختم می شود که مثلث قرمز یا گاو نر را تشکیل می دهد. پرچم در بازه زمانی بالاتر در 10 سال گذشته 2 ارزش خارج از بازار وجود داشت که توسط FUD (ترس، عدم اطمینان، شک) در تمام بازارهای مالی به دلیل تأثیرات خارجی هدایت می شد. مثلث کاملاً به سمت جیب طلایی زرد (0.618-0.65) با هدف 2.414 حرکت می کند. که منجر به بالای سبز رنگ در پایان چرخه فعلی حدود 260k + 30k می شود. طیف گسترده ای چون ما فقط چند روز در این ارتفاعات می مانیم و قیمت بر اساس احساساتی است که با حرص و آز و توجه رسانه های سراسر جهان کنترل می شود. فرض کنید ارزش تجارت اولیه Bitcoin در ژوئیه 2010 را به عنوان پایین ترین قیمت در بازار در نظر بگیرید. پس از آن، 329 روز تا قیمت صعودی 2011 باقی مانده است. باز هم از پایین ترین سطح بازار نزولی به بالاترین سطح در پایان سال 2013، اکنون 742 روز است، یعنی 410 روز بیشتر از دوره قبلی. این تاپ گاو نر سهموی حدود 90 روز زودتر در چرخه بعدی اضافه شده از چرخه قبلی دوباره وارد شد. این همچنین ما را در اواخر ژوئن تا اوایل ژوئیه 2022 به اوج می رساند که با رنگ سبز مشخص شده است. این تجزیه و تحلیل در بازه زمانی هفتگی ترسیم شده است، بنابراین تاریخ نصف کردن صحیح نیست و سایر مقادیر محاسبه شده +-6 روز هستند. در نتیجه، برخی از data برآورد شده و دقیق نیستند. این اولین نظریه من است. اهمیت سرمایه گذاران این است که بلندمدت فکر کنند.
سلب مسئولیت
هر محتوا و مطالب مندرج در سایت و کانالهای رسمی ارتباطی سهمتو، جمعبندی نظرات و تحلیلهای شخصی و غیر تعهد آور بوده و هیچگونه توصیهای مبنی بر خرید، فروش، ورود و یا خروج از بازار بورس و ارز دیجیتال نمی باشد. همچنین کلیه اخبار و تحلیلهای مندرج در سایت و کانالها، صرفا بازنشر اطلاعات از منابع رسمی و غیر رسمی داخلی و خارجی است و بدیهی است استفاده کنندگان محتوای مذکور، مسئول پیگیری و حصول اطمینان از اصالت و درستی مطالب هستند. از این رو ضمن سلب مسئولیت اعلام میدارد مسئولیت هرنوع تصمیم گیری و اقدام و سود و زیان احتمالی در بازار سرمایه و ارز دیجیتال، با شخص معامله گر است.