
Trendoscope
@t_Trendoscope

تریدر چه نمادی را توصیه به خرید کرده؟
سابقه خرید
تخمین بازدهی ماه به ماه تریدر
پیام های تریدر
فیلتر
نوع پیام
Trendoscope
HOW-TO: Auto Harmonic Screener - UltimateX
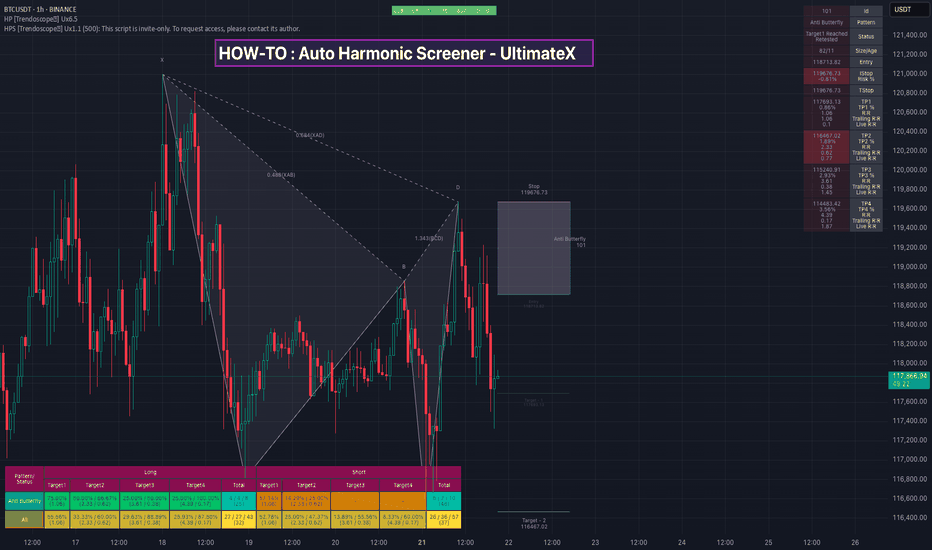
سلام به همه، در این ویدیو، نحوه استفاده از اسکرینر هارمونیک خودکار جدیدمان - UltimateX را توضیح دادهایم. موضوعات زیر را پوشش دادهایم: تفاوت بین اسکرینر هارمونیک خودکار - UltimateX (اسکریپت فعلی) و الگوی هارمونیک خودکار - UltimateX و نحوه استفاده از هر دو اسکریپت به طور همزمان تفاوت بین اسکرینر هارمونیک خودکار - UltimateX (اسکریپت فعلی) و اسکرینر موجود الگوی هارمونیک خودکار - اسکرینر که بر اساس فراخوانیهای request.security ساخته شده است. ما در مورد محدودیتهای اسکریپت قدیمی و اینکه چگونه استفاده از اسکریپت جدید با ابزار اسکرینر Pine به غلبه بر این مشکلات کمک میکند، بحث کردهایم. ما تنظیمات اندیکاتور را بررسی کردهایم (که تقریباً مشابه تنظیمات الگوی هارمونیک خودکار UltimateX است). دموی کوتاه در مورد نحوه استفاده از اسکریپت با اسکرینر Pine همچنین ویدیوی قبلی ما در مورد نحوه استفاده از ابزار جدید اسکرینر Pine را بررسی کنید.
Trendoscope
Pine Screener - Powerful tool for building programmable screener
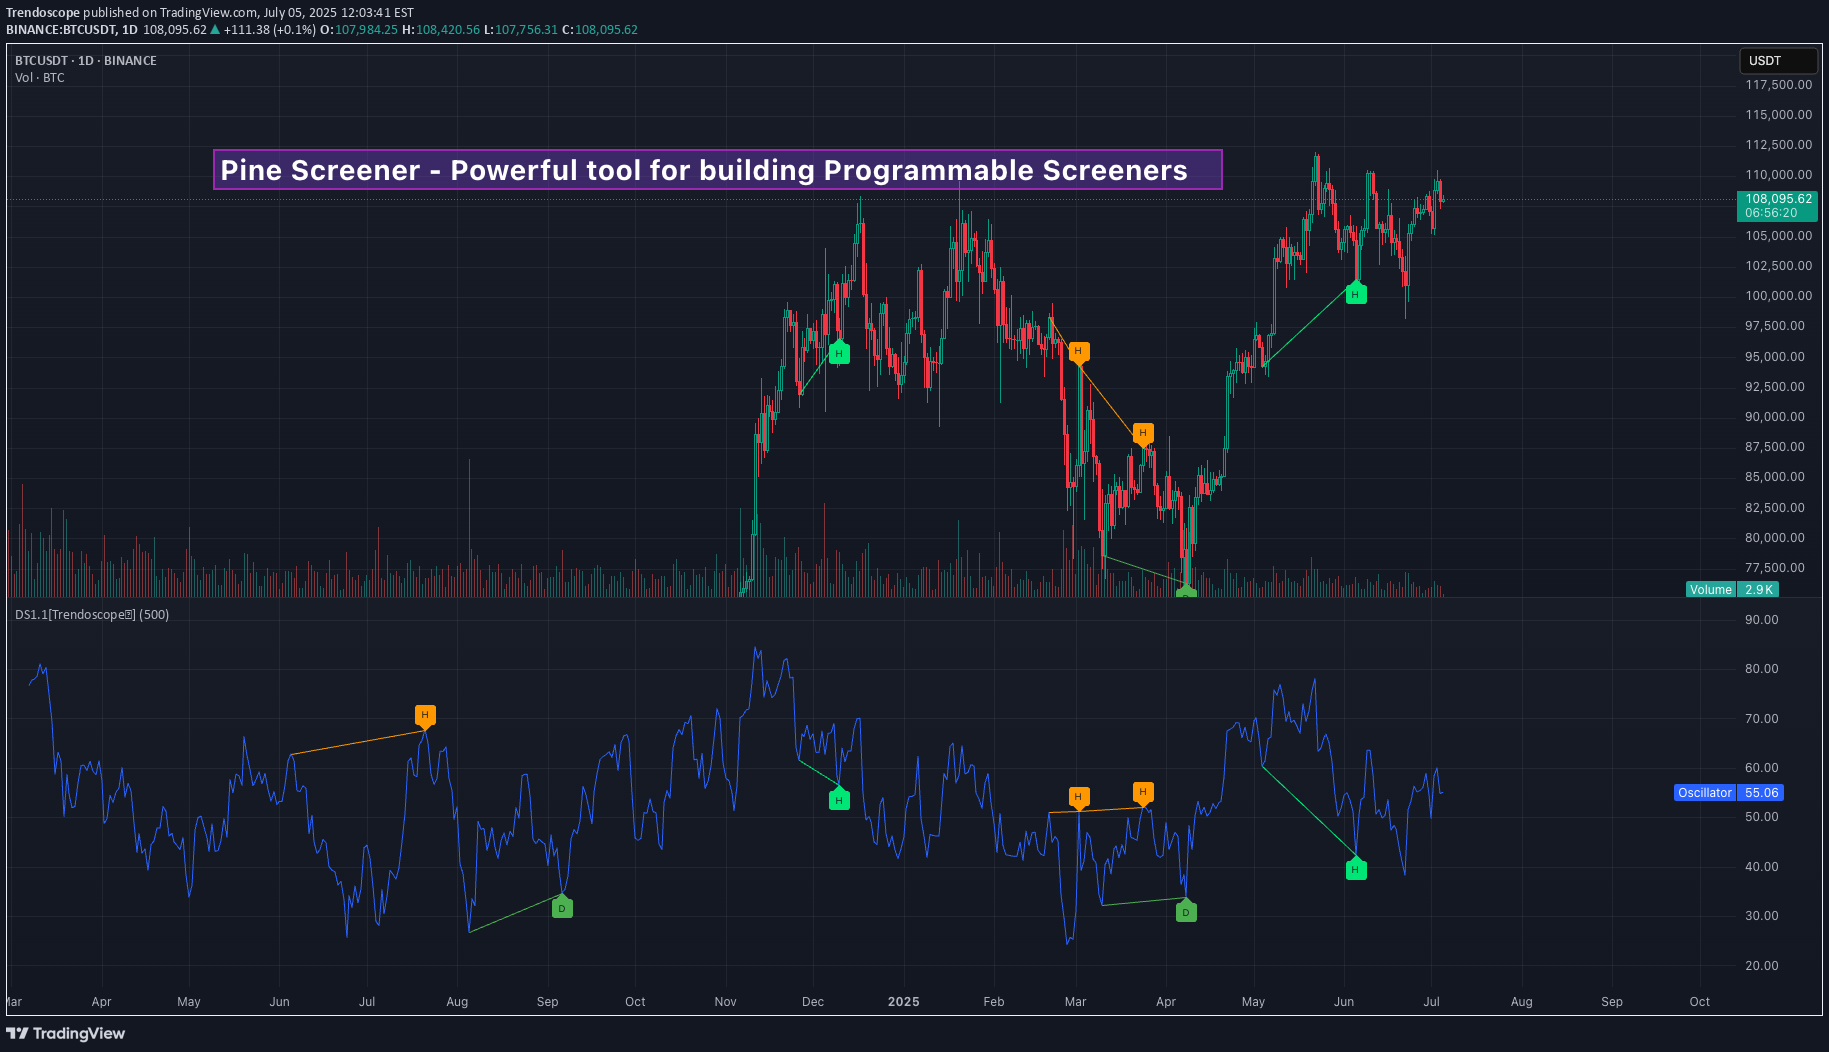
سلام به همه ، در این ویدیو ، ما در مورد نحوه استفاده از برنامه Pine Screener از TradingView بحث کرده ایم. ما از شاخص استفاده می کنیم نمایشگر واگرایی برای این تظاهرات و سهام صفحه نمایش تحت واگرایی صعودی. به طور خلاصه ، در اینجا مراحل است: 🎯 استفاده کنید غربال کننده برای ساخت لیست های نگهبان کمتر از 1000 نماد in نشانگر مورد نظر خود را در صفحه نمایش کاج به موارد دلخواه خود اضافه کنید. 🎯 صفحه نمایش کاج از منوی TradingView Screener قابل دسترسی است یا می توانید به سادگی روی link کلیک کنید tradingview.com/pine-screener/ stlist لیست و نشانگر را به صفحه نمایش کاج اضافه کرده و تنظیمات بازه زمانی و نشانگر را تنظیم کنید 🎯 معیارهایی را که اسکن می شوند انتخاب کنید و اسکن را فشار دهید
Trendoscope
Position Sizing Strategies
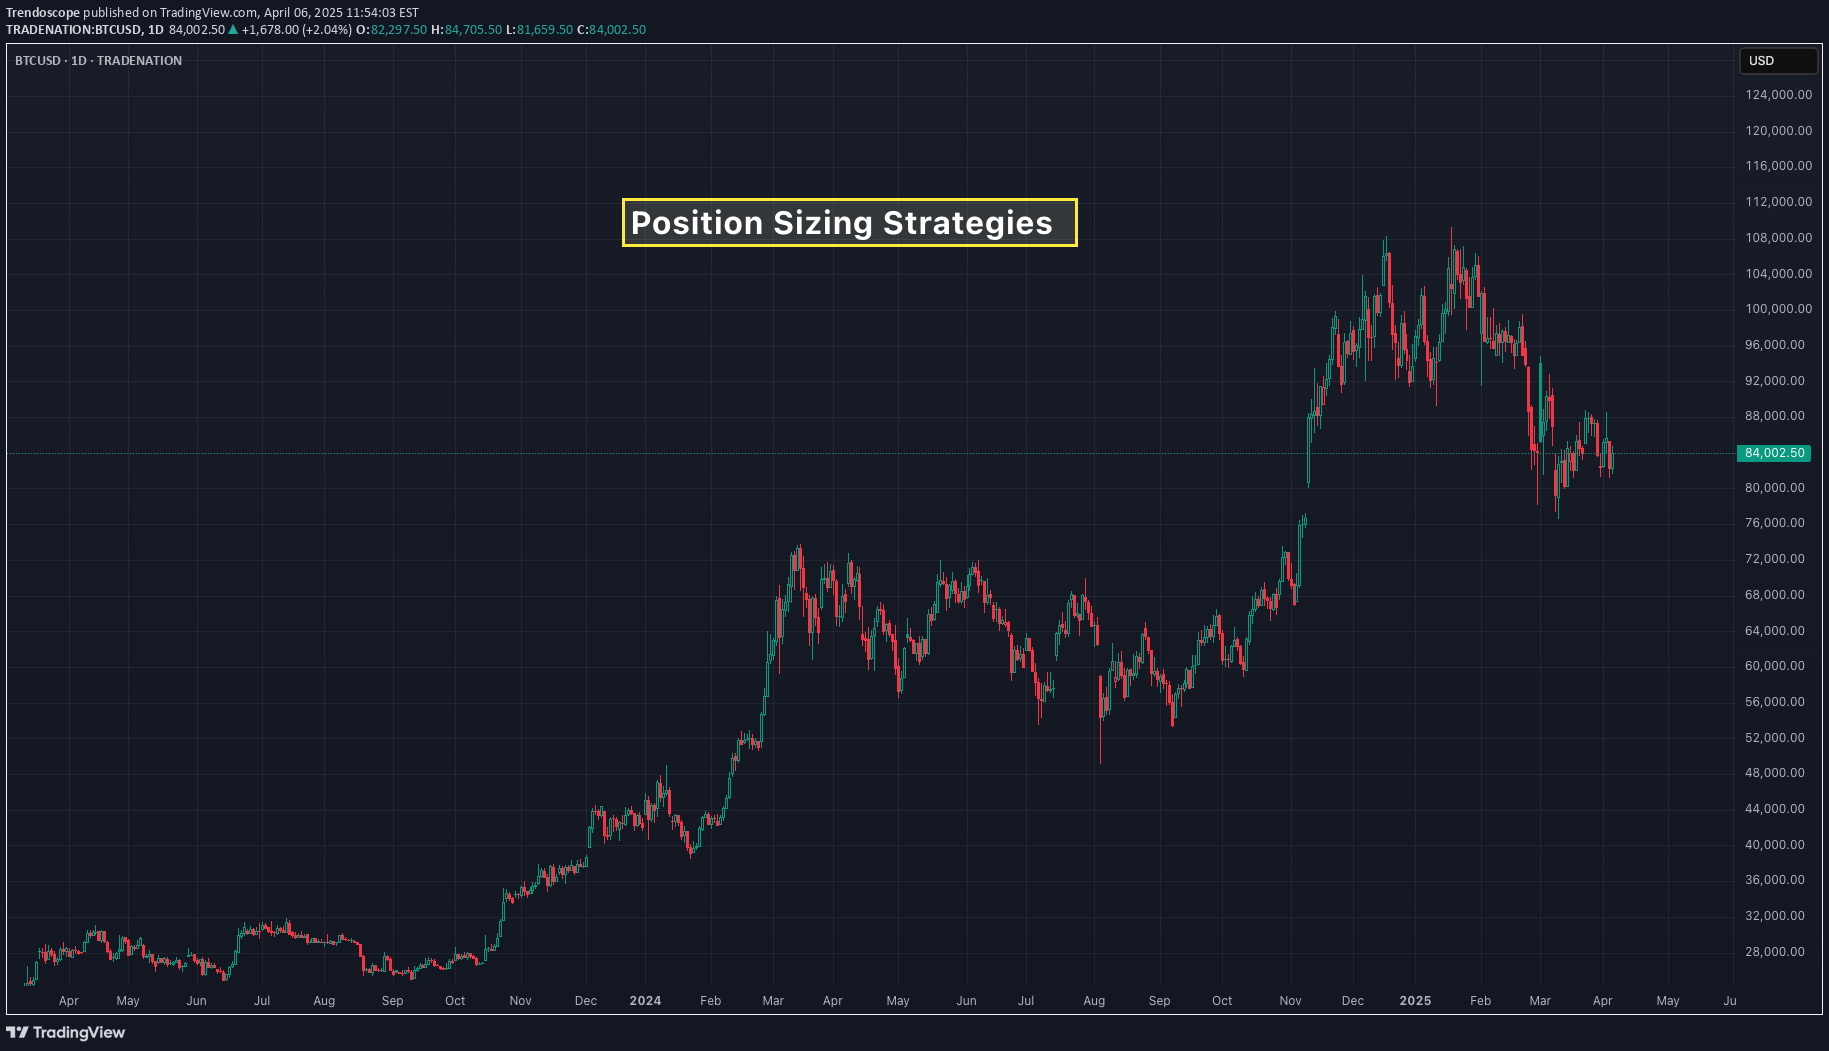
Position sizing is one of the most important aspects in risk management for traders. Proper position sizing helps manage the risk effectively by maximizing profits and limiting the losses. In this publication, we will explore popular position sizing strategies and how to implement them in pinescript strategies 🎲 Importance of Position Sizing in Trading Let's take an example to demonstrate the importance of position sizing. You have a very good strategy that gives you win on 70% of the times with risk reward of 1:1. If you start trading with this strategy with all your funds tied into a single trade, you have the risk of losing most of your fund in the first few trades and even with 70% win rate at later point of time, you may not be able to recoup the losses. In such scenarios, intelligent position sizing based on the events will help minimize the loss. In this tutorial, let us discuss some of those methods along with appropriate scenarios where that can be used. 🎲 Position Sizing Strategies Available in Tradingview Strategy Implementation 🎯 Fixed dollar amount position sizing In this method, trader allocate a fixed value of X per trade. Though this method is simple, there are few drawbacks Does not account for varying equity based on the trade outcomes Does not account for varying risk based on the volatility of the instrument 🎯 Fixed Percentage of Equity In this method, percent of equity is used as position size for every trade. This method is also simple and slightly better than the Fixed dollar amount position sizing. However, there is still a risk of not accounting for volatility of the instrument for position sizing. In tradingview strategies, you can find the position sizing settings in the properties section. In both cases, Pinescript code for the entry does not need to specify quantity explicitly, as they will be taken care by the framework. Pine Script® if(longEntry) strategy.entry('long', strategy.long) if(shortEntry) strategy.entry('short', strategy.short) 🎲 Advanced Position Sizing Strategies There are not directly supported in Tradingview/Pinescript - however, they can be programmed. 🎯 Fixed Fractional Method The Fixed Fractional Method is similar to the fixed percentage of equity method/fixed dollar amount positioning method, but it takes into account the amount of risk on each trade and calculate the position size on that basis. This method calculates position size based on the trader’s risk tolerance, factoring in stop-loss levels and account equity. Due to this, the trader can use any instrument and any timeframe with any volatility with fixed risk position. This means, the quantity of overall trade may vary, but the risk will remain constant. Example. Let's say you have 1000 USD with you and you want to trade BTCUSD with entry price of 100000 and stop price of 80000 and target of 120000. You want to risk only 5% of your capital for this trade. Calculation will be done as follows. Risk per trade = 5% of 1000 = 50 USD Risk per quantity = (entry price - stop price) = 20000 So, the quantity to be used for this trade is calculated by RiskQty = Risk Amount / Risk Per Quantity = 50 / 20000 = 0.0025 BTC To implement the similar logic in Pinescript strategy by using the strategy order quantity as risk, we can use the following code Pine Script® riskAmount = strategy.default_entry_qty(entryPrice)*entryPrice riskPerQty = math.abs(entryPrice-stopPrice) riskQty = riskAmount/riskPerQty With this, entry and exit conditions can be updated to as follows Pine Script® if(longEntry) strategy.entry('long', strategy.long, riskQty, stop=entryPrice) strategy.exit('ExitLong', 'long', stop=stopPrice, limit=targetPrice) if(shortEntry) strategy.entry('short', strategy.short, riskQty, stop=entryPrice) strategy.exit('ExitShort', 'short', stop=stopPrice, limit=targetPrice) Expand 1 line 🎯 Kelly Criterion Method The Kelly Criterion is a mathematical formula used to determine the optimal position size that maximizes the long-term growth of capital, considering both the probability of winning and the payoff ratio (risk-reward). It’s a more sophisticated method that balances risk and reward in an optimal way. Kelly Criterion method needs a consistent data on the expected win ratio. As and when the win ratio changes, the position sizing will adjust automatically. Formula is as follows f = W - L/R f: Fraction of your capital to bet. W : Win Ratio L : Loss Ratio (1-W) R : Risk Reward for the trade Let's say, you have a strategy that provides 60% win ratio with risk reward of 1.5, then the calculation of position size in terms of percent will be as follows f = 0.6 - 0.4/1.5 = 0.33 Pinescript equivalent of this calculation will be Pine Script® riskReward = 2 factor = 0.1 winPercent = strategy.wintrades/(strategy.wintrades+strategy.losstrades) kkPercent = winPercent - (1-winPercent)/riskReward tradeAmount = strategy.equity * kkPercent * factor tradeQty = tradeAmount/entryPrice Expand 1 line 🎲 High Risk Position Sizing Strategies These strategies are considered very high risk and high reward. These are also the strategies that need higher win ratio in order to work effectively. 🎯Martingale Strategy The Martingale method is a progressive betting strategy where the position size is doubled after every loss. The goal is to recover all previous losses with a single win. The basic idea is that after a loss, you double the size of the next trade to make back the lost money (and make a profit equal to the original bet size). How it Works: If you lose a trade, you increase your position size on the next trade. You keep doubling the position size until you win. Once you win, you return to the original position size and start the process again. To implement martingale in Pine strategy, we would need to calculate the last consecutive losses before placing the trade. It can be done via following code. Pine Script® var consecutiveLosses = 0 if(ta.change(strategy.closedtrades) > 0) lastProfit = strategy.closedtrades.profit(strategy.closedtrades-1) consecutiveLosses := lastProfit > 0? 0 : consecutiveLosses + 1 Quantity can be calculated using the number of consecutive losses Pine Script® qtyMultiplier = math.pow(2, consecutiveLosses) baseQty = 1 tradeQty = baseQty * qtyMultiplier 🎯Paroli System (also known as the Reverse Martingale) The Paroli System is similar to the Anti-Martingale strategy but with more defined limits on how much you increase your position after each win. It's a progressive betting system where you increase your position after a win, but once you've won a set number of times, you reset to the original bet size. How it Works: Start with an initial bet. After each win, increase your bet by a predetermined amount (often doubling it). After a set number of wins (e.g., 3 wins in a row), reset to the original position size. To implement inverse martingale or Paroli system through pinescript, we need to first calculate consecutive wins. Pine Script® var consecutiveWins = 0 var maxLimit = 3 if(ta.change(strategy.closedtrades) > 0) lastProfit = strategy.closedtrades.profit(strategy.closedtrades-1) consecutiveWins := lastProfit > 0? consecutiveWins + 1 : 0 if(consecutiveWins >= maxLimit) consecutiveWins := 0 Expand 2 lines The quantity is then calculated using a similar formula as that of Martingale, but using consecutiveWins Pine Script® qtyMultiplier = math.pow(2, consecutiveWins) baseQty = 1 tradeQty = baseQty * qtyMultiplier 🎯D'Alembert Strategy The D'Alembert strategy is a more conservative progression method than Martingale. You increase your bet by one unit after a loss and decrease it by one unit after a win. This is a slow, incremental approach compared to the rapid growth of the Martingale system. How it Works: Start with a base bet (e.g., $1). After each loss, increase your bet by 1 unit. After each win, decrease your bet by 1 unit (but never go below the base bet). In order to find the position size on pinescript strategy, we can use following code Pine Script® // Initial position initialposition = 1.0 var position = initialposition // Step to increase or decrease position step = 2 if(ta.change(strategy.closedtrades) > 0) lastProfit = strategy.closedtrades.profit(strategy.closedtrades-1) position := lastProfit > 0 ? math.max(initialposition, position-step) : position+step Expand 3 lines Conclusion Position sizing is a crucial part of trading strategy that directly impacts your ability to manage risk and achieve long-term profitability. By selecting the appropriate position sizing method, traders can ensure they are taking on an acceptable level of risk while maximizing their potential rewards. The key to success lies in understanding each strategy, testing it, and applying it consistently to align with your risk tolerance and trading objectives.
Trendoscope
Trading Converging Chart Patterns
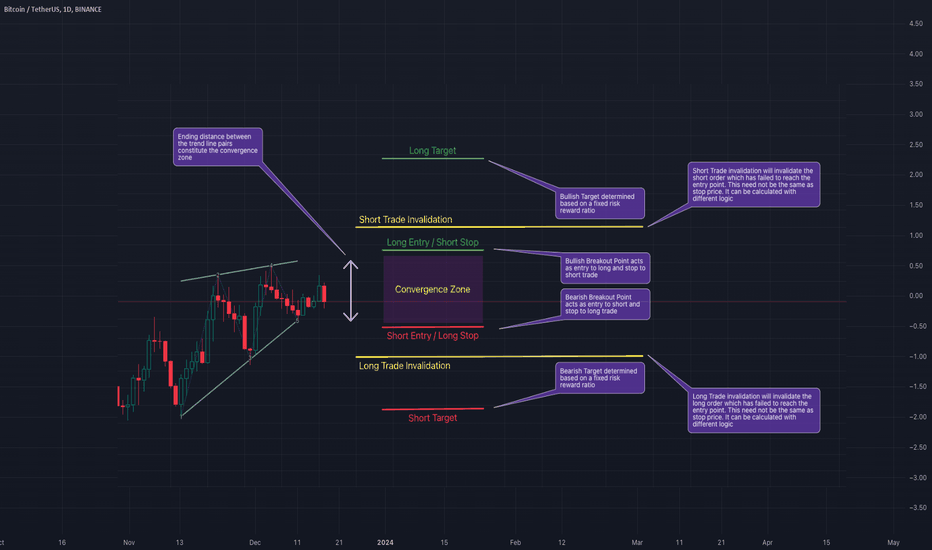
We discussed identification and classification of different chart patterns and chart pattern extensions in our previous posts. Algorithmic Identification of Chart Patterns Flag and Pennant Chart Patterns In this installment, we shift our focus towards the practical trading strategies applicable to a select group of these patterns. Acknowledging that a universal trading rule cannot apply to all patterns, we narrow our examination to those of the converging variety. We will specifically address the following converging patterns: Rising Wedge (Converging Type) Falling Wedge (Converging Type) Converging Triangle Rising Triangle (Converging Type) Falling Triangle (Converging Type) This selection will guide our discussion on how to approach these patterns from a trading perspective. 🎲 Historical Bias and General Perception Each pattern we've discussed carries a historical sentiment that is widely regarded as a guideline for trading. Before we delve into our specific trading strategies, it's crucial to understand these historical sentiments and the general market interpretations associated with them. 🟡 The Dynamics of Contracting Wedge Patterns Contracting Wedge patterns are typically indicative of the Elliott Wave Structure's diagonal waves, potentially marking either the beginning or conclusion of these waves. A contracting wedge within a leading diagonal may experience a brief retracement before the trend resumes. Conversely, if found in an ending diagonal, it could signal the termination of wave 5 or C, possibly hinting at a significant trend reversal. The prevailing view suggests that these patterns usually precede a short-term directional shift: Rising Wedges are seen as bearish signals, while Falling Wedges are interpreted as bullish. It's essential to consider the trend prior to the formation of these patterns, as it significantly aids in determining their context within the Elliott Wave cycles, specifically identifying them as part of waves 1, A, 5, or C. For an in-depth exploration, refer to our detailed analysis in Decoding Wedge Patterns 🎯 Rising Wedge (Converging Type) The Rising Wedge pattern, historically viewed with a bearish bias, suggests that a downward trend is more likely upon a breakout below its lower trend line. This perception positions the pattern as a signal for traders to consider bearish positions once the price breaks through this critical support. 🎯 Falling Wedge (Converging Type) The Falling Wedge pattern is traditionally seen through a bullish lens, indicating potential upward momentum when the price surpasses its upper trend line. This established viewpoint suggests initiating long positions as a strategic response to such a breakout, aligning with the pattern's optimistic forecast. 🟡 Contracting Triangle Patterns Contracting Triangles, encompassing Converging, Ascending, and Descending Triangles, are particularly noteworthy when they appear as part of the Elliott Wave's B or 2 waves. These patterns typically signal a continuation of the pre-existing trend that preceded the triangle's formation. This principle also underpins the Pennant Pattern, which emerges following an impulse wave, indicating a pause before the trend's resumption. 🎲 Alternate Way of Looking into Converging Patterns Main issue with historical perception are: There is no clear back testing data to prove whether the general perception is correct or more profitable. Elliott Waves concepts are very much subjective and can be often difficult for beginners and misleading even for experts. So, the alternative way is to treat all the converging patterns equally and devise a method to trade using a universal way. This allows us to back test our thesis and be definitive about the profitability of these patterns. Here are our simple steps to devise and test a converging pattern based strategy. Consider all converging patterns as bidirectional. Meaning, they can be traded on either side. Thus chose to trade based on the breakout. If the price beaks up, then trade long and if the price breaks down, then trade short. For each direction, define criteria for entry, stop, target prices and also an invalidation price at which the trade is ignored even without entry. Backtest and Forward test the strategy and collect data with respect to win ratio, risk reward and profit factor to understand the profitability of patterns and the methodology. Now, let's break it further down. 🟡 Defining The Pattern Trade Conditions Measure the ending distance between the trend line pairs and set breakout points above and beyond the convergence zone. 🎯 Entry Points - These can be formed on either side of the convergence zone. Adding a small buffer on top of the convergence zone is ideal for setting the entry points of converging patterns. Formula for Entry can be: Pine Script® Long Entry Price = Top + (Top - Bottom) X Entry Ratio Short Entry Price = Bottom - (Top-Bottom) X Entry Ratio Whereas Top refers to the upper side of the convergence zone and bottom refers to the lower side of the convergence zone. Entry Ratio is the buffer ratio to apply on top of the convergence zone to get entry points. 🎯 Stop Price - Long entry can act as stop for short orders and the short entry can act as stop price for long orders. However, this is not mandatory and different logic for stops can be applied for both sides. Formula for Stop Can be Pine Script® Long Stop Price = Bottom - (Top - Bottom) X Stop Ratio Short Stop Price = Top + (Top - Bottom) X Stop Ratio 🎯 Target Price - It is always good to set targets based on desired risk reward ratio. That means, the target should always depend on the distance between entry and stop price. The general formula for Target can be: Pine Script® Target Price = Entry + (Entry-Stop) X Risk Reward 🎯 Invalidation Price - Invalidation price is a level where the trade direction for a particular pattern needs to be ignored or invalidated. This price need to be beyond stop price. In general, trade is closed when a pattern hits invalidation price. Formula for Invalidation price is the same as that of Stop Price, but Invalidation Ratio is more than that of Stop Ratio Pine Script® Long Invalidation Price = Bottom - (Top - Bottom) X Invalidation Ratio Short Invalidation Price = Top + (Top - Bottom) X Invalidation Ratio 🟡 Back Test and Forward Test and Measure the Profit Factor It is important to perform sufficient testing to understand the profitability of the strategy before using them on the live trades. Use multiple timeframes and symbols to perform a series of back tests and forward tests, and collect as much data as possible on the historical outcomes of the strategy. Profit Factor of the strategy can be calculated by using a simple formula Pine Script® Profit Factor = (Wins/Losses) X Risk Reward 🟡 Use Filters and Different Combinations Filters will help us in filtering out noise and trade only the selective patterns. The filters can include a simple logic such as trade long only if price is above 200 SMA and trade short only if price is below 200 SMA. Or it can be as complex as looking into the divergence signals or other complex variables.
Trendoscope
Flag and Pennant Chart Patterns
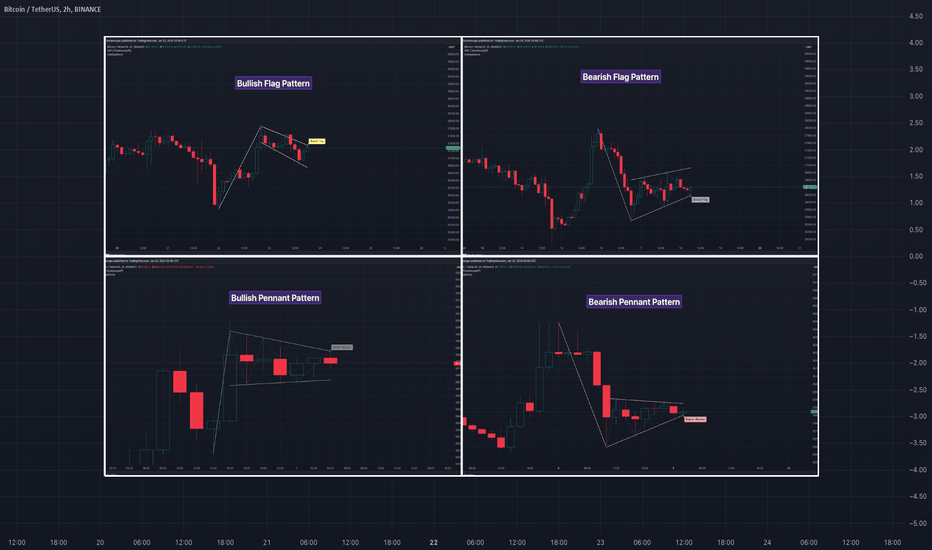
🎲 پسوند به الگوهای نمودار بر اساس جفت خط روند - پرچم ها و پنبها بعد از کاوش شناسایی الگوریتمی و طبقه بندی الگوهای نمودار ، اکنون ما با تمرکز بر الگوهای نمودار پرچم و پرچم ، به الگوهای این الگوهای می پردازیم. این الگوهای از ساختارهای مبتنی بر جفت خط روند اساسی ، که اغلب تحت تأثیر تکانه های قبل از بازار قرار دارند ، تکامل می یابد. 🎲 قوانین شناسایی برای الگوهای پسوند 🎯 وجود الگوهای نمودار پایه را مشخص کنید قبل از شناسایی الگوهای پرچم و پنبه ، ابتدا باید وجود الگوهای همگرا یا موازی مبتنی بر جفت روند زیر را شناسایی کنیم. کانال صعودی کانال نزولی افزایش گوه (پیمانکاری) Falling Wedge (پیمانکاری) مثلث همگرا مثلث نزولی (پیمانکاری) مثلث صعودی (پیمانکاری) 🎯 شناسایی الگوهای پسوند. کلید ذکر این الگوهای در مشاهده یک موج تکانشی قوی - شبیه به یک پرچم - پیش از یک الگوی پایه نهفته است. این تنظیم پتانسیل برای یک الگوی پسوند را نشان می دهد: بوها پرچم صعودی از یک ضربه مثبت و به دنبال آن یک کانال نزولی یا یک گوه در حال سقوط بیرون می آید بوها پرچم پس از یک ضربه منفی که منجر به یک کانال صعودی یا گوه در حال افزایش می شود ، ظاهر می شود. بوها پنالتی توسط یک رانش مثبت قبل از یک مثلث همگرا یا مثلث صعودی نشان داده شده است. بوها سکه یک ضربه منفی و مثلث همگرا یا نزولی را دنبال می کند. طبقه بندی و ویژگی های الگوی state الگوی پرچم صعودی ویژگی های الگوی پرچم صعودی به شرح زیر است با یک موج ضربه مثبت شروع می شود بلافاصله یا یک کانال نزولی کوتاه یا یک گوه در حال سقوط دنبال می شود در اینجا نمونه ای از الگوی پرچم صعودی آورده شده است state الگوی پرچم نزولی ویژگی های الگوی پرچم نزولی به شرح زیر است با یک موج ضربه منفی شروع می شود بلافاصله یا یک کانال صعودی کوتاه یا گوه در حال افزایش دنبال می شود در اینجا نمونه ای از الگوی پرچم نزولی آورده شده است 🎯 الگوی صدف صعودی ویژگی های الگوی پنالتی صعودی به شرح زیر است با یک موج ضربه مثبت شروع می شود بلافاصله یا مثلث همگرا یا الگوی مثلث صعودی دنبال می شود. در اینجا نمونه ای از الگوی صعود صعودی آورده شده است 🎯 الگوی پنیر نزولی ویژگی های الگوی پنالتی نزولی به شرح زیر است با یک موج ضربه منفی شروع می شود بلافاصله یا مثلث همگرا یا یک الگوی مثلث همگرا نزولی دنبال می شود. در اینجا نمونه ای از الگوی pennant نزولی آورده شده است الگوهای پسوند معاملاتی در یک روند قوی در بازار ، دیدن دوره های موقت ادغام ، تشکیل الگوهای که همگرا یا دامنه هستند ، اغلب با جهت روند روند در حال انجام است. چنین مکثها ممکن است زمینه را برای ادامه روند روند پس از شکستن فراهم کند. این فرض که این روند از سر گرفته می شود ، تعصب اساسی الگوهای پرچم و پنالتی را شکل می دهد با این حال ، مهم است که تصمیمات را صرفاً در مورد روندهای گذشته قرار ندهید. انجام آزمایش های پشتی شخصی برای تعیین مؤثرترین استراتژی های ورود و خروج برای این الگوهای بسیار مهم است. به یاد داشته باشید ، رفتار این الگوهای می تواند با نوسانات دارایی و بازه زمانی خاص مورد تجزیه و تحلیل متفاوت باشد. با توجه به اینکه پویایی بازار در معرض طیف گسترده ای از عوامل تأثیرگذار است که ممکن است از نتایج مورد انتظار منحرف شوند ، به تفسیر این الگوهای با احتیاط نزدیک می شوند. برای سرمایه گذاران و بازرگانان ، شرکت در آزمایش کامل پشت ، تعیین نقاط ورود ، سفارشات متوقف کردن و اهداف هدفمند که با سبک معاملات فردی شما و اشتهای ریسک شما مطابقت دارد ، ضروری است. این مرحله برای ارزیابی زنده ماندن این الگوهای مطابق با استراتژی ها و اهداف تجاری شخصی شما مهم است. پس از شکل گیری این الگوهای ، شاهد یک برک آوت و به دنبال معکوس قیمت سریع است. علاوه بر این ، در صورتی که شکستگی در جهت مخالف اتفاق می افتد ، در معاملات در معاملات در تجارت وجود دارد ، به ویژه هنگامی که روند قبل از شکل گیری الگوی در برابر تعصب الگوی است. 🎲 ورق تقلب
Trendoscope
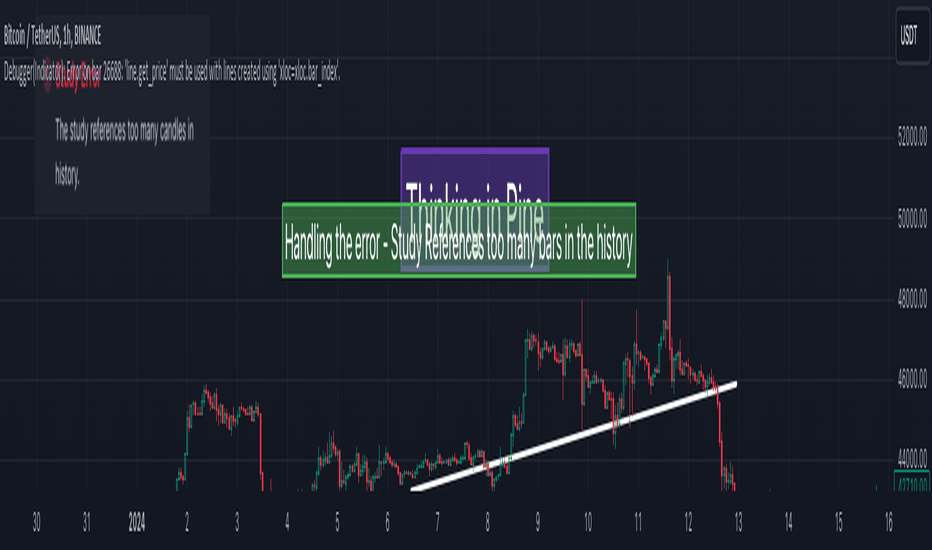
Thinking in Pine - Study References Too Many Bars In the History
خوش آمدید
"فکر کردن در کاج"
سریال های ویدیویی کوتاه در مباحث اسکریپت کاج.
موضوع امروز رسیدگی به خطا است -
"این مطالعه به شمع های زیادی در تاریخ اشاره می کند"
و سایر موارد مرتبط با BAR_INDEX.
اگر با مفاهیم سری زمان اسکریپت Pine آشنا نیستید ، لطفاً فیلم های قبلی ما را طی کنید.
فکر کردن در کاج - سریال های زمانی
تفکر در کاج - موارد خاص سری زمانی
🎲 مورد بحث
چه موقع خطا را دریافت می کنیم "منابع مطالعه تعداد زیادی شمع در تاریخ" و نحوه غلبه بر این مسئله.
محدودیت های BAR_INDEX با ترسیم اشیاء در نمودار.
🎯 برنامه مثال - اجرای جایگزین مرجع تاریخی
کاج اسکریپت®
// وقتی می بیش از یا برابر با 10000 میله قدیمی تر به تاریخ مراجعه کنیم
// مقدار شناور = بستن [10000]
// طرح (مقدار)
// اجرای جایگزین
مقادیر var = array.new
Trendoscope
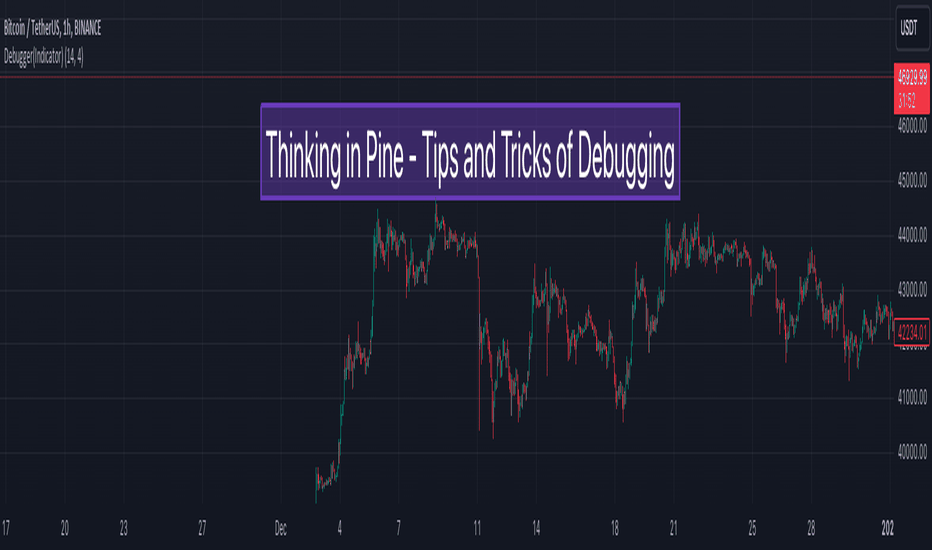
Thinking in Pine - Tricks and Tips of Debugging
خوش آمدید
"فکر کردن در کاج"
سریال های ویدیویی کوتاه در مباحث اسکریپت کاج.
نکته بحث امروز اشکال زدایی و ابزاری است که اسکریپت کاج ما را برای اشکال زدایی برنامه های خود فراهم می کند.
🎲 مورد بحث
اشکال زدایی با استفاده از «طرح» برای مقادیر سری عددی.
استفاده از سیاهههای مربوط به کاج برای اشکال زدایی برای مواردی که "طرح" مناسب نیست
🎯 برنامه مثال - اشکال زدایی با استفاده از طرح
کاج اسکریپت®
طول = input.int (14 ، "طول")
multiplier = input.float (4 ، "ضرب")
var dir = 1
var stumpdistance = ta.atr (طول) * ضرب
// حذف VAR را برای حل شماره اول
// متوقف کردن = ta.atr (طول) * ضرب
buystopcurrent = محاصره نزدیک
sellstopcurrent = بستن + متوقف کردن
var buystop = buystopcurrent
var sellstop = sellstopcurrent
خرید: = دیر> 0؟ Math.max (buystop ، buystopcurrent): buystopcurrent
فروش: = دیر <0؟ math.min (sellstop ، sellstopcurrent): sellstopcurrent
// از NZ برای غلبه بر مسائل NA با Math.max/ Math.min استفاده کنید
// buystop: = dir> 0؟ Math.max (NZ (buystop ، buystopcurrent) ، buystopcurrent): buystopcurrent
// sellstop: = dir <0؟ Math.min (NZ (Sellstop ، sellstopcurrent) ، sellstopcurrent): sellstopcurrent
dir: = dir == 1 و بستن
Trendoscope
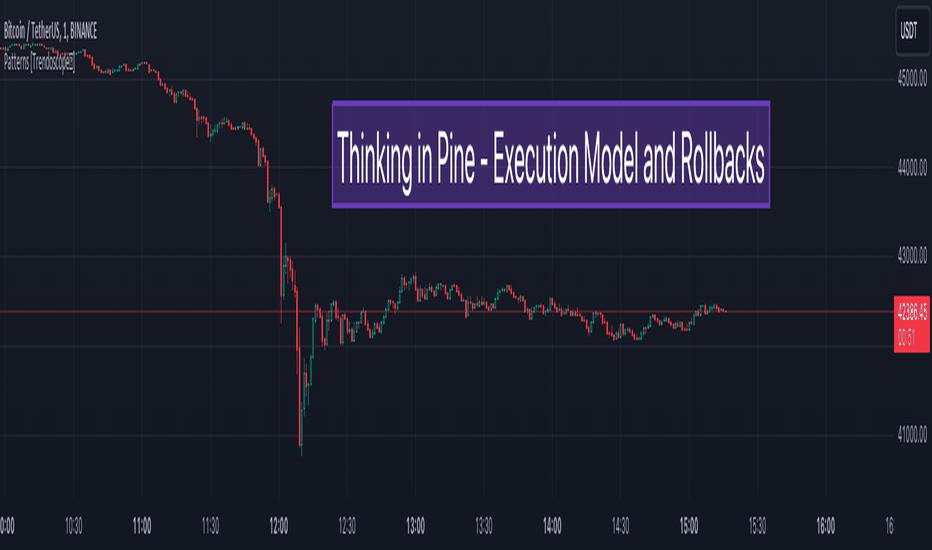
Thinking in Pine - Execution Model and Rollback on Realtime Bars
سلام به همه ،
به جلسه دیگری از "تفکر در کاج" خوش آمدید - آموزش های ویدئویی کوتاه در مورد اسکریپت کاج.
قبل از ادامه این فیلم ، اگر با متغیرهای VAR ، VARIP و منظم آشنا نیستید ، لطفاً ویدیوی قبلی ما را تماشا کنید -
"تفکر در کاج - وار ، وارپ و متغیرهای منظم"
points بحث امروز
چگونه کد اصلاح متغیر var ، varip و منظم با به روزرسانی های تاریخی و واقعی کار می کند.
مفهوم بازگشت متغیرهای VAR
🎯 برنامه مثال استفاده شده است
کاج اسکریپت®
// اظهارات در هر کنه اجرا می شود
تعداد = 0.0
تعداد+= 1
varip varipcount = 0 // فقط یک بار در اولین bar اجرا می شود
varipcount+= 1
// تنظیم مجدد پیشخوان در هر bar
// if (barstate.isconfirmed)
// varipcount: = 0
// بازگرداندن و اختصاص به هر کنه
var varcount = 0.0 // فقط یک بار در اولین bar اجرا می شود
varcount+= 1
// varcount: = varcount [1] - بازگشت
// varcount: = varcount + 1 - دوباره اجرا کنید
طرح (Varipcount ، 'Varip Count')
طرح (varcount ، 'var count')
طرح (تعداد ، "çount")
arrregular = array.new
Trendoscope
Thinking in Pine - Functions Containing Var Variables
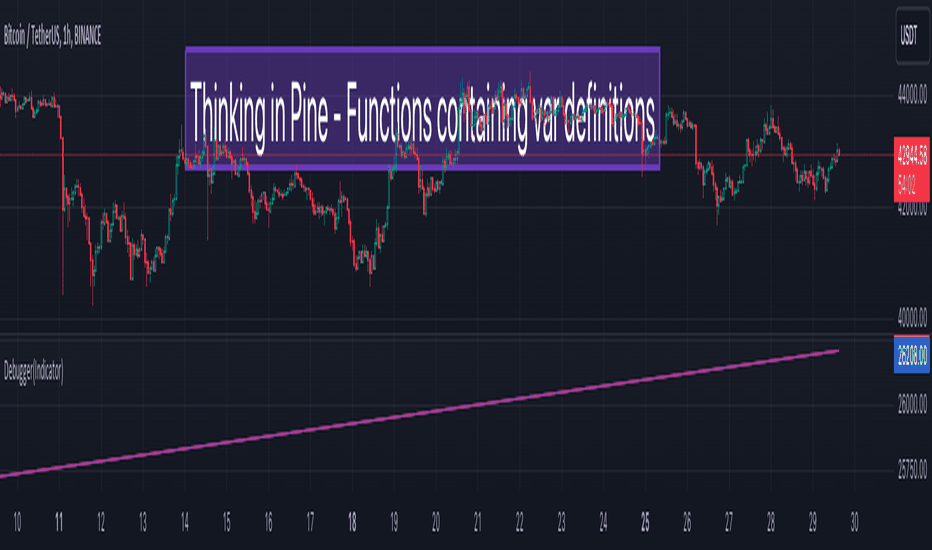
سلام به همه ، خوش آمدید به "فکر کردن در کاج" آموزش های ویدئویی کوتاه. در این فیلم ، ما در مورد موارد خاص استفاده از متغیرهای VAR در تعریف عملکرد بحث کرده ایم. اگر با متغیرهای VAR آشنا نیستید ، لطفاً یک قدم عقب بردارید و فیلم قبلی ما را تماشا کنید - "تفکر در کاج - وار ، وارپ و متغیرهای منظم" 🎲 خلاصه استفاده از VAR در یک محدوده عملکرد و نحوه رفتار با دعوت های متعدد. با استفاده از توابع حاوی تعاریف متغیر VAR در یک حلقه. 🎯 برنامه مثال استفاده شده است کاج اسکریپت® افزایش () => var i = 0 i+= 1 var1 = افزایش () var2 = افزایش () var3 = افزایش () // کد فوق معادل است // var i1 = 0 // i1+= 1 // var1 = i1 // var i2 = 0 // i2+= 1 // var2 = i2 // var i3 = 0 // i3+= 1 // var3 = i3 طرح (var1 ، "پیشخوان 1" ، رنگ = color.blue) طرح (var2 ، "پیشخوان 2" ، رنگ = رنگ. red) طرح (var3 ، "پیشخوان 3" ، رنگ = color.purple) arr = array.from (var1 ، var2 ، var3) برای i = 1 تا 3 arr.push (افزایش ()) // کد فوق معادل است // var i4 = 0 // i4+= 1 // arr.push (i4) if (bar_index == 4) log.info ("مقدار آرایه حاوی مقادیر افزایشی: {0} '، arr) 30 خط را گسترش دهید 🎲 منابع کتابچه راهنمای کاربر Pine Script® - اعلامیه های متغیر کتابچه راهنمای مرجع Pine Script® - var
Trendoscope
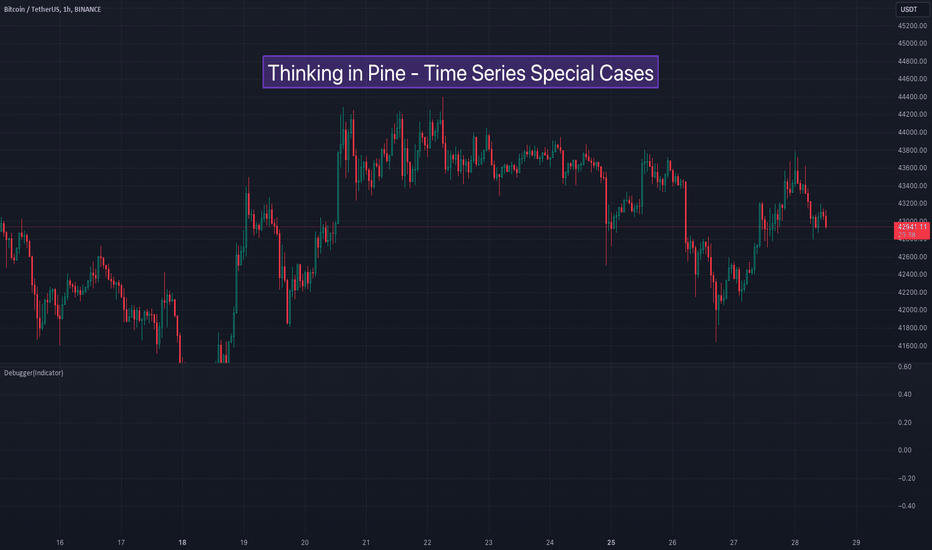
Thinking in Pine - Time Series Special Cases
سلام به همه ،
خوش آمدید به
"فکر کردن در کاج"
سری ویدیویی کوتاه. در این جلسه ، ما در مورد چند مورد خاص از متغیرهای سری زمانی و استفاده از اپراتور تاریخی در محدوده محلی بحث کرده ایم.
اگر فیلم قبلی ما را تماشا نکرده اید -
"فکر کردن در کاج - سری زمانی"
، request شما قبل از ادامه این فیلم این کار را انجام می دهید.
🎲 خلاصه بحث امروز ما
چگونه اپراتور تاریخی برای متغیرهای تعریف شده در یک بلوک مشروط کار می کند
چگونه اپراتور تاریخی برای متغیرهای تعریف شده در یک حلقه کار می کند.
🎯 برنامه مثال استفاده شده است
کاج اسکریپت®
// سری زمانی برای متغیرها در یک شرایط
Varip ShowloginLoop = درست است
if (bar_index ٪ 3 == 0)
ویژه barindex = bar_index
if (bar_index> last_bar_index-3 و ShowloginLoop)
log.info (فهرست ویژه و قبلی bar قبلی عبارتند از: {0} و {1} '، SpecialBarindex ، SpecialBarIndex [1])
ShowloginLoop: = نادرست
// سری متغیرهای زمانی در یک حلقه
arrayofx = array.new
سلب مسئولیت
هر محتوا و مطالب مندرج در سایت و کانالهای رسمی ارتباطی سهمتو، جمعبندی نظرات و تحلیلهای شخصی و غیر تعهد آور بوده و هیچگونه توصیهای مبنی بر خرید، فروش، ورود و یا خروج از بازارهای مالی نمی باشد. همچنین کلیه اخبار و تحلیلهای مندرج در سایت و کانالها، صرفا بازنشر اطلاعات از منابع رسمی و غیر رسمی داخلی و خارجی است و بدیهی است استفاده کنندگان محتوای مذکور، مسئول پیگیری و حصول اطمینان از اصالت و درستی مطالب هستند. از این رو ضمن سلب مسئولیت اعلام میدارد مسئولیت هرنوع تصمیم گیری و اقدام و سود و زیان احتمالی در بازار سرمایه و ارز دیجیتال، با شخص معامله گر است.