
TradeYourLogic
@t_TradeYourLogic

تریدر چه نمادی را توصیه به خرید کرده؟
سابقه خرید
تخمین بازدهی ماه به ماه تریدر
پیام های تریدر
فیلتر
نوع پیام
TradeYourLogic
WAVES/USDT

مشاوره مالی نیست ، لطفاً تحقیقات خود را انجام دهید بازه زمانی 1D مناطق خریداری کنید - 1.50 $ - 1.54 $ ضرر توقف - 1.48 $ (اگر شروع به ساخت پایین تر/تغییر روند کنیم) اهداف: - 1.67 $ - 1.85 $ موقعیت بسته در حدود 1 هدف. من به دنبال امکان خرید مجدد بود سود +6 ٪
TradeYourLogic
KDA/USDT

-- Not a financial advice, please, do your own research -- Finally, we are observing break out of our downward resistance(Falling Wedge, reversal pattern) with some significant volume and multiple RSI divergences. As for now, we need to await and see, how 1W candle gets closed(we still might end up with the fake break out). I have DCAed at different price levels: 0.77$, 0.52$ and hold it for long term If you have missed some recent KDA news and why I personally believe in project: - ledger support - increase of daily transactions volume(which signifies adoption) - constant technical developmentNeed to wait and check how 1W candle gets closed, however as for now, most probably, 0.3$ is incoming invalidation, if 1W gets closed above 0.52$4H time frame, we have a Falling Wedge pattern. If we break it out upward, then we can potentially see 0.51$ area, which at the same time will form Double Bottom pattern with the target around 0.6$As for now, Falling Wedge is in play on 4H timeframe and we also have a Double Bottom on 1D timeframe, in order to proceed, we need to break 0.51-0.53$ resistance area and retest it after P.S. I hold KDA for long term, as it is like ETH in 2015(not a financial advice, DYOR)3D timeframe, Double Bottom with the target 0.66-0.7$, if we break it and reach out target zone, then we can expect a re-test of our demand zone around 0.55$ and we should hold it in order to continue to growWaiting for 1W candle to get closed. As for now, price is 0.518$, per 12H timeframe I can observe some accumulation. Not a financial advise but there might be a pump soon up to 0.7$(daily 200MA zone)Short Update: if we break our 0.5$ support zone, we can dive to our support area at around 0.45$ P.S. I am holding it long term and I am accumulating, not sellingPrice dropped with significant volume probably due to the hacker, who stole it from CoinEx P.S. I keep holding and accumulatingBasically we are currently in our Triangle pattern and at our local support zone(0.48$). It will be amusing if we pump from here after this fuel(massive sell orders)As for now. in order to proceed with our uptrend we need to break and stay above 0.51$, otherwise we can go to 0.45$If we can't hold 0.47$ support, then we can drop to at least 0.45$. Additionally, if BTC decides to get dropped, we might see 0.3$ on KDA P.S as I mentioned before, I hold long term, only accumulate(solid tech project, decent team)Short update: As long as we hold 0.45-0.46$ level - we are fine(accumulation). As soon as we break and retest 0.54$ level - we can potentially visit 0.7$Please, like and subscribe as it motivates me to post more ideasSometimes simple "waiting" is the complexest thing. Patiently waiting until we break and successfully retest 0.54$Short Update: If we are not able to restore 0.475$ price level soon and afterwards break 0.54$ resistence within this week, then most probably we will drop to 0.36$ levelWe are BULLISHShort update: We are in a symmetrical triangle now(curr price is 0.512$), if we break 0.53$, then we can see KDA growing to 0.6$. P.S I am still holding long term and daily transaction volume is increasing(253k now), which signals adoption and continuous developmentAfter breaking out of symmetrical triangle we went to 0.59 - 0.60$ area, where our 200MA on 1D timeframe lays. As for now, we can see some correction, especially if BTC drops(I am not selling). If we break 200MA on daily timeframe(0.601$), then we can expect a movement up to 0.75$, which corresponds to the 100MA on 3D timeframeCrucial moment, we either break 0.6$(1D 200MA), gather liquidity and grow to 0.7$ or the price gets correctedShort update, for now I would expect a movement to 0.7$ and correction after(up to around 0.5$), especially if BTC gets corrected. If this scenario plays out, then we can potentially form Inverted Head and Shoulder with the potential up to 0.9$. Not a financial adviseAs I mentioned before, we have reached 0.7$, if you check 3D timeframe, you will notice we are kind of overbought( I am not selling!!! ), therefore, I am expecting some correction to happen soon. Additionally, if you open 1W timeframe you will observe tremendous buy volume, which is an extremely decent sign for upcoming future.Correction is in play as was mentioned above. We can see a drop to the 0.53$ level and bounce after, which will form our right shoulder in Inverse H&S pattern with the first target of 0.9$Short update: We might be forming our right shoulder, let's observe how our 3D candle gets closed, price now is 0.614$. If we get closed above 0.67$ we will have a BULLISH engulfing. In general, the local target I am waiting is 0.8$(our local H&S patter's target)Binance and CZ fud and correction after. As for KDA, 3D timeframe, we have inverted hammer candle(price is 0.58$). let's await and check the following 3D candle, whether we are forming a Right Shoulder now, if so, then we can see our 0.8$ target in the nearest time. Also be cautious(I am not selling!!!), because BTC has several bearish RSI divergences, so potentially it can drop in price, which will trigger market correctionShort Update: Once we break 0.69$ area with successful retest, our target will be 0.85-0.9$ P.S if you follow my IDEA, I would really appreciate if you LIKE it or SUBSCRIBEAnother Short Update: On KDA we've reached 0.74$, it is almost 2D 200MA. What are my expectations now? If you check USDT.D 1D chart you will see that we are kind of oversold now and we have a bullish divergence. For those who are not aware, when USDT.D chart drops in value - CRYPTO market grow, if USDT.D rises, then CRYPTO falls. As easy as it is. BTC chart, we are currently overbought, especially after the news that MicroStrategu bought another chunk of BTC supply. Additionally, we have open GAPs on BTC CME Futures chart, on 39,500$ and around 20,000$ !!! As for now, it makes sense if the market cools a bit down. therefore if you made some gains, do not forget to fix it. There is no trade in history who went bankrupt after taking his profits. Always keep it in mind and "don't marry your bags"I sold 40k+ of KDA and I will be waiting for BTC correction, not a financial advive and I might be wrong about selling, time will tell.Guess, I was right when I decided to sell. As for now, I am waiting for BTC correction, in long term BTC will grow, otherwise, why would MicroStrategy buy BTC, right? I will update this post, once I re-enter t\he marketI have rebought at 0.635$, expecting a move up to 0.96$Short update: I sold again at 0.72$ and I am expecting the market to correct soon, therefore I will stay outside for a while, not a financial advice.I have just re-bought at 0.7$ area and waiting BTC to retest 45k$Sold again at 0.72$, waiting for a correction after we could not break our 43.5k$ resistanceCongratulations to all who holded and manage to earn. I will publish a new post after the market correction.
TradeYourLogic
KDA/USDT pair

در حال حاضر ما در کانال نزولی حرکت می کنیم ، در این لحظه فعلی انتظار دارم که یک کاهش دیگر به حدود 0.35 دلار قیمت و مقداری از آن در آنجا با شکستن زیر به سمت بالا کاهش یابد اگر بتوانیم مقاومت را در 0.7 $ و چرخش R/S به هم بزنیم ، باطل می شود
TradeYourLogic
KDA/USDT

نه یک مشاوره مالی ، همیشه قبل از خرید هر چیزی ، تحقیقات خود را انجام دهید نمودار جدید و چشم انداز جدید من برای کادنا ، حداقل در حال حاضر من منتظر هستم تا ببینم که شمع سه بعدی ابتدا بسته می شود ، زیرا اکنون با مشروبات الکلی صعودی بسته می شود که به طور مداوم صعودی ما را القا می کند ، ما به پایان نرسیدیم که با Engulfing صعودی ، من منتظر بروزرسانی شمع شمع هفتگی بود ، شمع روزانه بسته می شود که با استفاده از ق " KDA می تواند به زودی سطح 1.5-1.6 $ را لمس کند من انتظار دارم که BTC به سطح 27-28k برسد و پس از تصحیح طبق معمول ، نه یک مشاوره مالی ، لطفاً تحقیقات خود را انجام دهید و منتظر بسته شدن شمع 1W باشید ، اگر ما موفق به بسته شدن بیش از 1.35 $ یا جایی در اطراف این منطقه شویم ، شمع هفتگی دو شمع تصحیح هفتگی را درگیر می کند که یک علامت بسیار صعودی بود و ما می توانیم برای حرکت بیشتر در نمودار 3D (ما در حال حاضر از نظر خود قرار بگیریم) در حال حاضر در زیر خط ما قرار داریم. ما می توانیم در 100mA (1،4 $) شرکت کنیم ، در صورتی که اگر بتوانیم زیر 1،08 دلار بسته شویم ، می توانیم از 1 $ و 0.9 $ نیز بازدید کنیم ، پشتیبانی محلی خود را شکسته ایم ، در الگوی سر و شانه های بالقوه 1 بعدی ، اگر گردن را بشکنیم (پشتیبانی از 1 دلار) ، هدف بالقوه ما بر اساس TA بود. در حال حاضر همه چیز به سر و شانه های معکوس btcpotential در بازه زمانی سه بعدی BTC با هدف در حدود 31-32K بستگی دارد ، RSI در منطقه Oversold است اگر BTC زیر 19 کیلو بسته شود ، بی اعتبار است USDC.D و USDT .d ، RSI در منطقه Overbought است که شما به روزرسانی Dipshort را خریداری کرده اید: من هنوز منتظر بسته شدن شمع هفتگی هستم ، اگر BTC از بین نرود ، ما شاهد صعود در KDA به منطقه مقاومت محلی خود بود همچنین به دلیل انتشار Miners KA3 که در نهایت باید روزانه KDA تولید شود ، که ممکن است باعث عرضه تقاضا شود ، که می تواند منجر به رشد قیمت شود ، معدنکاری نیز در حال افزایش است ، که می تواند منجر به رشد قیمت شود. اخیراً تولید روزانه حدود 60 000 از KDA بوده است و در حال حاضر آن را به حدود 45000 KDA کاهش داده است (هنوز 100 ٪ نیست ، هنوز هم اطلاعاتی را برای آمار درونی من جمع آوری کرده است) لطفاً ، اطلاعات قبلی را در مورد کاهش تولید روزانه ، من اشتباه می کنم ، من به طور اشتباه در BTC ، به طور شکنی انتظار می رود که در حدود 25K inivergences شروع به کار کند ، و در همان زمان که از آن استفاده می کند ، در همان زمان که باعث می شود یک بار از بین ببرد و در همان زمان ، یک بار را از بین ببرد ، و در همان زمان که از آن استفاده می کند ، باعث می شود که در همان زمان و در همان زمان ، یک بار را بسازد ، و در همان زمان ، یک بار در حال انجام است. در مورد KDA ، اگر مساحت 0.9 دلار را از دست بدهیم ، شروع به پایین آمدن پایین کرد ، این به معنای ادامه روند نزولی است ، با این وجود من آن را برای طولانی مدت نگه می دارم فقط مشاهده می کنم که چگونه این پروژه توسعه می یابد صادقانه بگویم ، KDA زیر 1 $ یک هدیه است اما هیچ یک از اینها یک به روزرسانی مشاوره مالی نیست ، هیچ چیز جدیدی اتفاق نیفتاده است ، فقط نگه دارید در حال حاضر ما می توانیم پمپاژ ALT را بعد از BTC در حال رشد و USDT .D که به سمت پایین حرکت می کند ، مشاهده کنیم ، انتظار دارم که این کار را ادامه دهد اما IMHO BTC واقعاً منطقه 32K را شکست داد در مورد KDA ، ما باید در یک بازه زمانی روزانه بالاتر از 1.10 $ بسته شویم تا در نظر بگیریم که به 1.40 $ بروید صبر همیشه می پردازد
TradeYourLogic
KDA/USDT

مشاوره مالی نیست الگوی سر و شانه های بالقوه بالقوه در بازه زمانی 4 ساعت اگر بتوانیم یک خط مقاومت رو به پایین را بشکنیم و بعد از اینکه می توانیم در آینده با 2-3 $ منطقه با نرخ شروع قیمت 1.2 $ - 1.4 $ رشد کنیم ، با موفقیت دوباره آن را دوباره امتحان کنیم. در مورد من ، من KDA را در جای خود قرار می دهم و منتظر هستم تا ببینم تیم KADENA ما را هدایت می کند ، 2023 سال امیدوار کننده است که یک تظاهرات کوتاه ، قیمت تصحیح شده است و در حال حاضر ، IMHO ، ما یک الگوی فنجان و دسته در بازه زمانی 4H+ با هدف در حدود 1،25 دلار داریم هیچکدام از اینها یک مشاوره مالی نیست ، آیا شما در حال حاضر تحقیقات خود را دارید ، ما در منطقه پشتیبانی 1 $ گیر کرده ایم ، اگر به زیر سطح 0.97 $ منطقه بپردازیم و برویم ، احتمالاً می توانیم از سطح 0.85 $ بازدید کنیم ، بیایید رعایت کنیم که ما در بازه زمانی 4 ساعت پایین و پایین پایین تر چاپ کرده ایم ، که می تواند یک علامت خوب باشد ، اما می تواند یک به روزرسانی باشد. بالاتر از 1.03 $ ، ما شانس مناسبی برای ادامه حرکت به سمت بالا به 1.2 $ - 1.3 $ ندارم که هنوز نمی نمودار جدیدی را ارسال کنم ، اما من نمودار KDA را در مورد Coinex بررسی کردم زیرا اطلاعات بیشتری دارد و به نظر می رسد که ما یک گوه در حال سقوط با ATH را به 3 دلار شکسته ایم ، از این رو اکنون می توانیم طی ماه های آینده به آن برسیم با این وجود ، ما هنوز باید فنجان خود را به سمت بالا بشکنیم و الگوی کنترل کنیم یک بازه زمانی مشاوره مالی 4H خوب به نظر نمی رسد ، KDA و یک بازار کامل دنبال می کند BTC ما ممکن است در حال حاضر قبل از صعودها ، یک مقطع پایین نهایی را در BTC مشاهده کنیم ، ما احتمالاً قصد داریم منطقه پشتیبانی خود را با 0.85 $ دوباره امتحان کنیم یا پایین تر شویم ، حتی 0.5 $ امکان پذیر است ، بیایید منتظر بمانیم و ببینیم ما همچنین ممکن است در یک تله خرس به پایان برسیم اگر BTC 16450 $ فنجان را حفظ کند و دسته باطل شود اما ممکن است در نهایت با هدف 1D با هدف 1 در حدود 1.35 $ و 2 هدف در حدود 1.7 $ قرار بگیریم. بیایید منتظر بمانیم که آیا این 100 ٪ مطمئن نیست ، اما ممکن است ما بخواهیم خط مقاومت رو به پایین خود را بشکنیم ، با پتانسیل 3 $ و در محلی می توانیم تشکیل و شکستن شکل گیری دوتایی خود را در 1D Timframestill که قادر به شکستن مقاومت به سمت پایین نیست ، تشکیل دهیم و می توانیم از 0.85 $ یا پایین بیاوریم. بازه زمانی 1D با اولین هدف 1.3 $ ما همچنین در بازه زمانی 1W واگرایی صعودی داریم و اگر بتوانیم بالاتر از 0.91 $+ را ببندیم ، در 1W مشارکت صعودی داشت که بسیار خوب است که یک شمع صعودی با صفر است ، من انتظار می رود 1،07 $ به زودی ، یک مشاوره مالی یک مشاوره مالی نباشد ، همانطور که اکنون ما دنبال می کنیم BTC و BTC نمودار ، که نشان می دهد که ما به زودی با تصحیح روبرو هستیم ، فراموش نکنید که یک مشاوره مالی را قفل کنید ما یک شکاف باز در آینده BTC CME داریم و احتمال زیادی وجود دارد که به زودی آن را ببندیم ، همچنین در هر USDT .D و USDC.D (هر دو oversold در هر RSI) تصحیح محلی بالقوه را نشان می دهید که شما برخی از سود را قفل کرده اید و دوباره کم می شود ، CME BTC شکاف هنوز پر نشده است ، من انتظار دارم که اول از آن لذت ببرید من ممکن است اشتباه کنم اما بسته KDA خود را با 1.31 $ فروخته ام تا سود را قفل کنم ، منتظر تصحیح بود زیرا ما در حال حاضر در منطقه پشتیبانی در هر USDC.D هستیم. ما همچنین 2 شکاف پر نشده در CME داریم بنابراین من سعی کرد که در حدود 1.18 $ AREANOT یک مشاوره مالی دوباره خریداری کنم من تصمیم گرفتم که پس از ارزیابی مجدد ، حدود 1.28 $ دوباره خرید کنم و فقط آن را نگه دارم ، در یک نمودار 1 متر ما در هر MFI (فهرست پول flow) در 1M Candlestick و همچنین یک مشاوره مالی داریم. من منتظر هستم تا شمعدانی سه بعدی بسته شود ، زیرا اکنون با یک فتیله فوقانی بسته می شود و این بدان معنی است که فروشندگان در حال حاضر کنترل می کنند و در این مرحله انتظار دارم قبل از ادامه کار ، ما باید بالاتر از 1.35 $ بسته شویم که 200 میلی آمپر ما در بازه زمانی روزانه ما است ، اگر این کار را انجام دهیم. در مورد BTC من انتظار دارم که 30K را در اواسط ترم 1.7 $ مشاهده کنم ممکن است بعدی باشد اما هنوز تأیید نشده است ، باید صبر کنید تا شمع هفتگی بسته شود من همچنین یک دید جدید با نمودار ارسال کرد
TradeYourLogic
KDA/USDT

اگر ما بتوانیم این خط مقاومت رو به پایین را با آزمایش مجدد موفق بشکنیم ، من انتظار دارم که از 1.5 $ ، 2 $ و حتی 3 دلار (به BTC بستگی داشته باشد) از آنجا که اکنون انتظار می رود که ما به حدود 1.55 $ $ برسیم که برابر با 12 ساعت 200 میلی آمپر ما باشد ، اما بعد از برخی از کشش ها بالاتر از 12H 100mA باقی می مانند ، که هنوز هم می تواند یک پیشنهاد خوب باشد. دستکاری رو به بالا ... امیدوارم که نفتی
TradeYourLogic
KDA/USDT

سر و شانه های معکوس بالقوه در بازه زمانی 1D ، همچنین واگرایی RSI صعودی در بازه زمانی 1W اگر BTC قیمت به سطح 25L+ معکوس می شود ، همچنین به خاطر داشته باشید که ما شکاف هایی را در CME Exchange در سطح 28K و 35K قرار داده ایم ، از این رو می توانم انتظار داشته باشم که KDA قیمت زیر BTC باشد و به طور بالقوه به 3 $ یا 4 $ سطح برسد I am also awaiting for the announce of 2nd KDA cohort or future projects, in general Kadena is long term investment, we have brillian team, therefore I sincerely believe that KDA has a bright futureBe prepared and patient, if BTC keeps falling, we can hit 1.2$ level and even lower as well but keep in mind, the best time to buy is when everyone is fearful and when everything is falling, you basically buy cheap assets, especially when it refers به پروژه امیدوار کننده مانند KDA
TradeYourLogic
KDA/USDT Cup&Handle?

آیا می توانیم در اینجا قیمت را معکوس کنیم و form یک فنجان و الگوی رسیدگی در اینجا در نهایت با نرخ 2.7 دلار به پایان می رسد؟ من هنوز 100 ٪ مطمئن نیستم اما همانطور که قبلاً اشاره کردم واقعاً به KDA بلند مدت اعتقاد دارم و ورود خود را در حال DCA هستم. هنگامی که سیستم ECO و DEFI TVL خود را گسترش دادیم ، قیمت به شدت صعود می کند ، قطعاً ارزش آن را به طور طولانی مدت به ارزش نگه می دارد ، مقاومت خود را شکستیم ، بیایید بررسی کنیم که آیا می توانیم 1.4 $ سطح داشته باشیم من dcaing هستم و آن را طولانی مدت نگه می دارم.
TradeYourLogic
KDA/USDT

مشاوره مالی نیست من تحقیقات کمی در مورد KDA انجام داده ام و صادقانه بگویم ، صریحاً معتقدم که پتانسیل عظیمی دارد (شبیه به EGLD ، هارمونی ، Solana قبل از اوج قیمت آنها) ، بنابراین تصمیم گرفتم که آن را DCA کنم. همانطور که می بینید در حال حاضر در هر RSI در منطقه Overbought قرار دارد ، از این رو تصحیح صورت می گیرد اما اگر شمع هفتگی آن را بررسی کنید ، یک مشروبات الکلی صعودی مشاهده کرد من این پست را به روز می کنم ، اگر هر چیزی که از این اتفاق بیفتد ، شما موفق به کسب برخی از دستاوردهای مناسب هستید ، فراموش نکنید که آن را برطرف کنید ، همچنین به خاطر داشته باشید که ما در هر RSI کاملاً بیش از حد فکر کرده ایم و در هر USDT. DIT CONTION PONTATION ممکن است در حال آمدن باشد ، همانطور که قبلاً گفتم ، تصحیح در بازی ، نگه داشتن DCAING و نگه داشتن یک ترمی طولانی مدت سال را دارد که آیا We We We Geg up 2 - 2.2 $.
TradeYourLogic
CLV/USDT
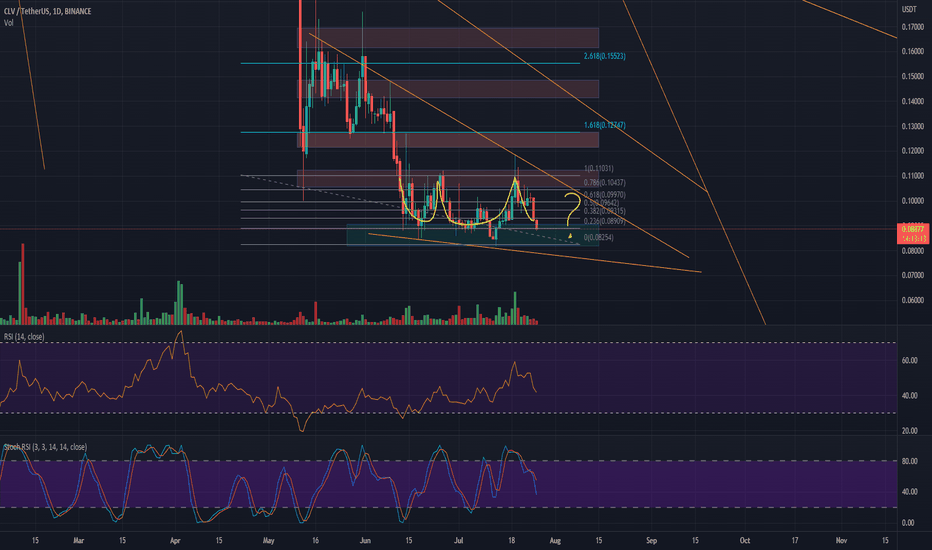
اگر در منطقه تقاضا پشتیبانی کنیم ، پایین سه گانه بالقوه در بازه زمانی 1D اهداف در یک نمودار به نمودار تسلط USDT و USDC ، همانطور که به سطح بیش از حد رسید ، من موقعیت CLV خود را بسته ام ، انتظار دارم که برخی از اصلاحات در هر BTC و ALTS ، بنابراین من ایده های جدیدی را ارسال می کنم تا این را ذکر کنم که من دوباره فکر کرده ام CLV و مقدار آن را پس از پمپ های محلی افزایش داده ام. در حال حاضر ما در بازه زمانی 12 ساعت به 200mA نزدیک می شویم ، بیایید ببینیم که آیا ما می توانیم آن را بشکنیم و در بالا بمانیم همچنین در تاریخ 10 آگوست ، ما تعداد تورم جدیدی داشت ، از این رو من انتظار برخی از نوسانات در بازار را داریم ، علاوه بر این در نمودار USDT. در نمودار USDT قرار داریم. به همین دلیل ممکن است معکوس باشد ، بنابراین من توصیه می کنم که از دست دادن توقف محکم استفاده کنید ، مگر اینکه شما طولانی مدت را نگه دارید (مانند من) من تصمیم گرفتم که CLV تجارت را ببندم و برای تصحیح کل بازار بیدار شوید.
سلب مسئولیت
هر محتوا و مطالب مندرج در سایت و کانالهای رسمی ارتباطی سهمتو، جمعبندی نظرات و تحلیلهای شخصی و غیر تعهد آور بوده و هیچگونه توصیهای مبنی بر خرید، فروش، ورود و یا خروج از بازارهای مالی نمی باشد. همچنین کلیه اخبار و تحلیلهای مندرج در سایت و کانالها، صرفا بازنشر اطلاعات از منابع رسمی و غیر رسمی داخلی و خارجی است و بدیهی است استفاده کنندگان محتوای مذکور، مسئول پیگیری و حصول اطمینان از اصالت و درستی مطالب هستند. از این رو ضمن سلب مسئولیت اعلام میدارد مسئولیت هرنوع تصمیم گیری و اقدام و سود و زیان احتمالی در بازار سرمایه و ارز دیجیتال، با شخص معامله گر است.