
TradeStation
@t_TradeStation

تریدر چه نمادی را توصیه به خرید کرده؟
سابقه خرید
تخمین بازدهی ماه به ماه تریدر
پیام های تریدر
فیلتر
نوع سیگنال
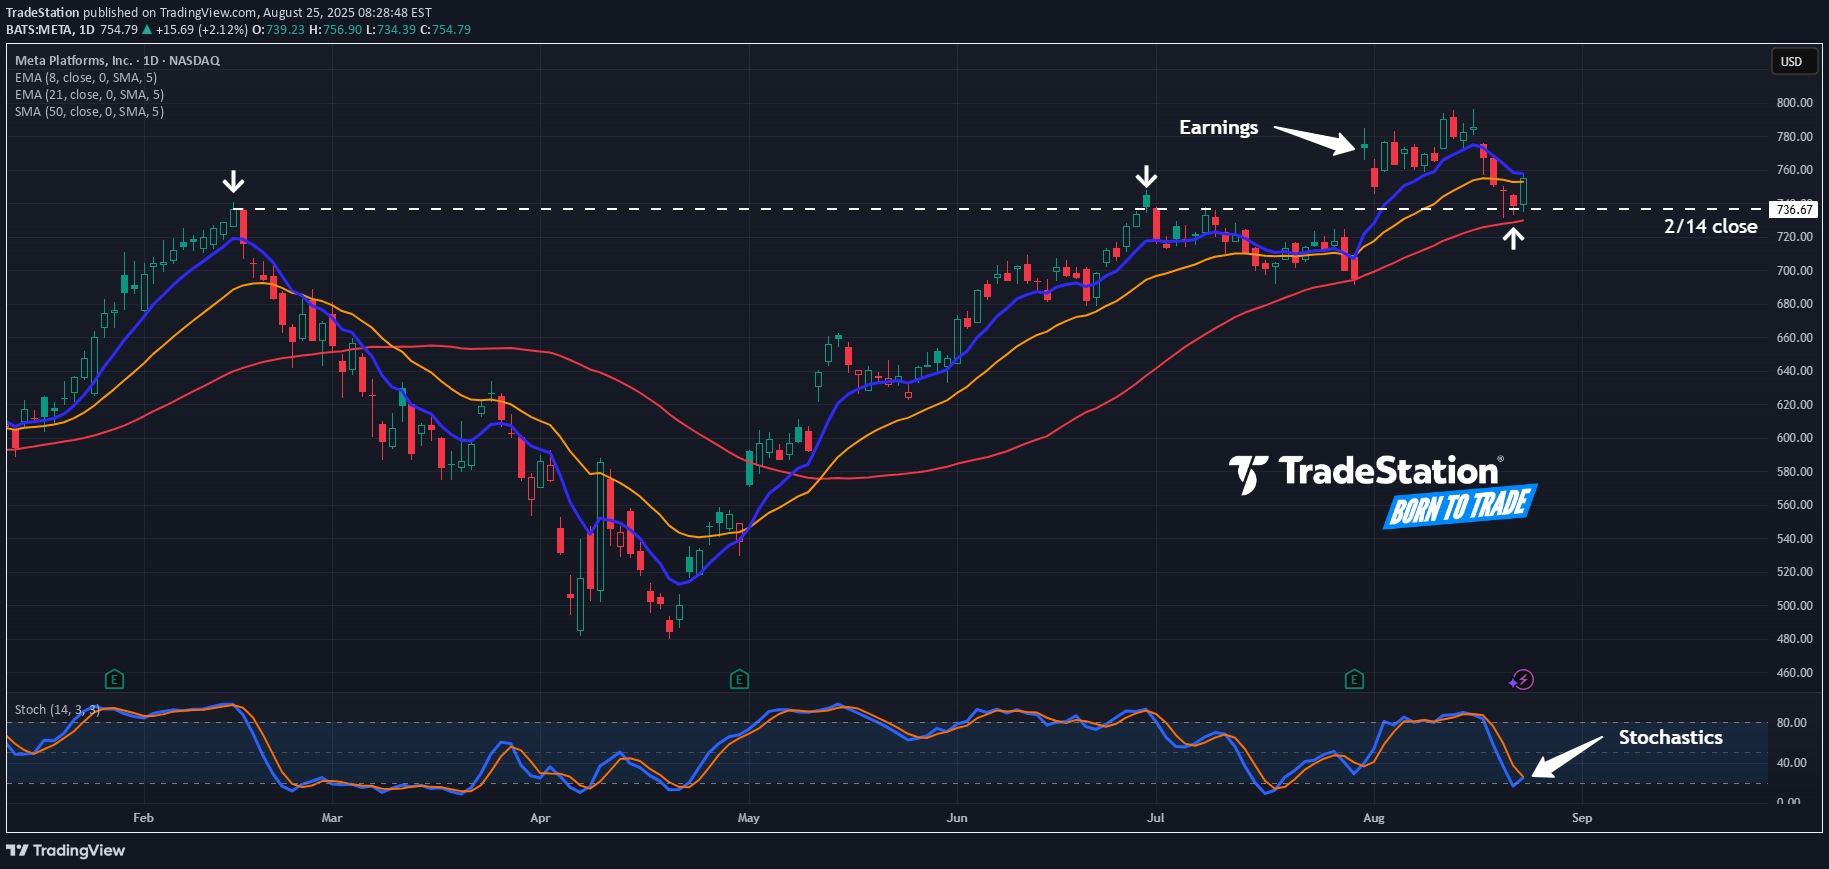
سیستم عامل متا اخیراً عقب کشیده شده است ، اما برخی از معامله گران ممکن است فکر کنند که هنوز هم بالاتر است. اولین الگوی موجود در نمودار امروز ، شکاف جدید همه زمانها پس از نتایج سه ماهه برآورد است. این ممکن است منعکس کننده اصول قوی در غول رسانه های اجتماعی باشد. دوم نزدیک هفتگی 736.67 دلار از 14 فوریه است. متا در اواخر ماه ژوئن در سطح متوقف شد اما هفته گذشته آن را برگزار کرد. آیا مقاومت قدیمی به پشتیبانی جدید تبدیل شده است؟ سوم ، stochastics از یک وضعیت فراوان در حال ظهور است. در مرحله بعد ، افزایش میانگین حرکت 50 روزه به طور بالقوه نشان می دهد که یک صعود میانی در مدت زمان انجام می شود. میانگین حرکت 8 روزه نمایی (EMA) نیز بالاتر از EMA 21 روزه است. این ممکن است با یک صعود کوتاه مدت سازگار باشد. آخر ، متا یک زیربنایی فعال در بازار گزینه ها است. (Its average daily volume of 453,000 contracts ranks tenth in the S&P 500 over the last month, according to TradeStation data.) That could help traders take positions with calls and puts. تراکم برای ده ها سال است که صنعت تجارت را پیشرفت کرده و دسترسی به سهام ، گزینه ها و آینده را فراهم می کند. اگر برای تجارت متولد شده اید ، ما می توانیم برای شما باشیم. ما را ببینید نمای کلی برای اطلاعات بیشتر عملکرد گذشته ، چه واقعی باشد و چه با آزمون های تاریخی استراتژی ها ، هیچ تضمینی برای عملکرد یا موفقیت آینده ندارد. There is a possibility that you may sustain a loss equal to or greater than your entire investment regardless of which asset class you trade (equities, options or futures); بنابراین ، شما نباید سرمایه گذاری کنید یا پولی را که نمی توانید از دست بدهید ، سرمایه گذاری کنید. تجارت آنلاین برای همه سرمایه گذاران مناسب نیست. مشاهده سندی با عنوان ویژگی ها و خطرات گزینه های استاندارد در https://www.tradestation.com/disclosteroptions بشر قبل از معامله هر کلاس دارایی ، مشتریان باید بیانیه های مربوط به افشای ریسک را بخوانند https://www.tradestation.com/Immentantent-Information/ بشر System access and trade placement and execution may be delayed or fail due to market volatility and volume, quote delays, system and software errors, Internet traffic, outages and other factors. Securities and futures trading is offered to self-directed customers by TradeStation Securities, Inc., a broker-dealer registered with the Securities and Exchange Commission and a futures commission merchant licensed with the Commodity Futures Trading Commission). اوراق بهادار Tradestation عضو سازمان نظارتی صنعت مالی ، انجمن ملی آینده و تعدادی از صرافی ها است. معاملات گزینه ها برای همه سرمایه گذاران مناسب نیست. Your TradeStation Securities’ account application to trade options will be considered and approved or disapproved based on all relevant factors, including your trading experience. دیدن https://www.tradestation.com/disclosteroptions بشر بازدید https://www.tradestation.com/pricing برای جزئیات کامل در مورد هزینه ها و هزینه های مرتبط با گزینه ها. معاملات حاشیه شامل خطرات است و مهم است که شما قبل از تجارت در حاشیه ، آن خطرات را کاملاً درک کنید. بیانیه افشای حاشیه بسیاری از این خطرات را تشریح می کند ، از جمله اینکه می توانید بودجه بیشتری را نسبت به واریز در حساب حاشیه خود از دست دهید. شرکت کارگزاری شما می تواند فروش اوراق بهادار را در حساب شما مجبور کند. شرکت کارگزاری شما می تواند اوراق بهادار شما را بدون تماس با شما بفروشد. و شما حق ندارید در یک تماس حاشیه ای تمدید کنید. بیانیه افشای حاشیه را در مرور کنید https://www.tradestation.com/disclosuremargin بشر TradeStation Securities, Inc. and TradeStation Technologies, Inc. are each wholly owned subsidiaries of TradeStation Group, Inc., both operating, and providing products and services, under the TradeStation brand and trademark. When applying for, or purchasing, accounts, subscriptions, products and services, it is important that you know which company you will be dealing with. بازدید https://www.tradestation.com/disclosuretscompans برای اطلاعات مهم بیشتر توضیح می دهد که این به چه معنی است.

تسلا در اواخر سال 2024 به شدت تظاهرات کرد و پس از آن افت در سه ماهه اول. اکنون ، پس از مدت طولانی ادغام ، برخی از معامله گران ممکن است فکر کنند که EV maker آماده می شود تا دوباره حرکت کند. اولین الگوی در نمودار امروز ، سری پایین تر و پایین تر از ماه مه است. این مثلث همگرا ممکن است پتانسیل شکستن TSLA را ایجاد کند. دوم ، پهنای باند بولینگر به پایین 13 ماهه فشرده شده است. آیا این فشرده سازی قیمت جای خود را می دهد؟ سوم ، افزایش میانگین حرکت ساده 200 روزه ممکن است نشان دهد که یک صعود طولانی مدت در اثر عمل باقی مانده است. در مرحله بعد ، قیمت ها در تلاشند تا بالاتر از میانگین حرکت 21 روزه در حال حرکت باشند. این ممکن است با افزایش صعودی در کوتاه مدت سازگار باشد. سرانجام ، TSLA یک زیر نظر بسیار فعال در بازار گزینه ها است. (متوسط حجم روزانه آن 2.3 میلیون قرارداد تنها در NVIDIA در S&P 500 قرار دارد. تراکم برای ده ها سال است که صنعت تجارت را پیشرفت کرده و دسترسی به سهام ، گزینه ها و آینده را فراهم می کند. اگر برای تجارت متولد شده اید ، ما می توانیم برای شما باشیم. ما را ببینید نمای کلی برای اطلاعات بیشتر عملکرد گذشته ، چه واقعی باشد و چه با آزمون های تاریخی استراتژی ها ، هیچ تضمینی برای عملکرد یا موفقیت آینده ندارد. این احتمال وجود دارد که شما بدون توجه به اینکه کدام کلاس دارایی را تجارت می کنید (سهام ، گزینه ها یا آینده) ممکن است ضرر برابر یا بیشتر از کل سرمایه گذاری خود را تحمل کنید. بنابراین ، شما نباید سرمایه گذاری کنید یا پولی را که نمی توانید از دست بدهید ، سرمایه گذاری کنید. تجارت آنلاین برای همه سرمایه گذاران مناسب نیست. مشاهده سندی با عنوان ویژگی ها و خطرات گزینه های استاندارد در https://www.tradestation.com/disclosteroptions بشر قبل از معامله هر کلاس دارایی ، مشتریان باید بیانیه های مربوط به افشای ریسک را بخوانند https://www.tradestation.com/Immentantent-Information/ بشر دسترسی به سیستم و قرار دادن تجارت و اجرای تجارت ممکن است به دلیل نوسانات و حجم بازار ، تأخیر در نقل قول ، خطاهای سیستم و نرم افزار ، ترافیک اینترنت ، قطع و سایر عوامل به تأخیر بیفتد. معاملات اوراق بهادار و معاملات آتی توسط TradeStation Securities ، Inc. ، یک دلال دلال ثبت شده در کمیسیون اوراق بهادار و بورس و یک بازرگان کمیسیون آینده دارای مجوز در کمیسیون معاملات آینده کالاها به مشتریان خود مستقر ارائه می شود). اوراق بهادار Tradestation عضو سازمان نظارتی صنعت مالی ، انجمن ملی آینده و تعدادی از صرافی ها است. معاملات گزینه ها برای همه سرمایه گذاران مناسب نیست. درخواست حساب اوراق بهادار TradeStation شما به گزینه های تجارت بر اساس کلیه عوامل مرتبط ، از جمله تجربه معاملاتی شما ، در نظر گرفته می شود و تأیید یا تأیید می شود. دیدن https://www.tradestation.com/disclosteroptions بشر بازدید https://www.tradestation.com/pricing برای جزئیات کامل در مورد هزینه ها و هزینه های مرتبط با گزینه ها. معاملات حاشیه شامل خطرات است و مهم است که شما قبل از تجارت در حاشیه ، آن خطرات را کاملاً درک کنید. بیانیه افشای حاشیه بسیاری از این خطرات را تشریح می کند ، از جمله اینکه می توانید بودجه بیشتری را نسبت به واریز در حساب حاشیه خود از دست دهید. شرکت کارگزاری شما می تواند فروش اوراق بهادار را در حساب شما مجبور کند. شرکت کارگزاری شما می تواند اوراق بهادار شما را بدون تماس با شما بفروشد. و شما حق ندارید در یک تماس حاشیه ای تمدید کنید. بیانیه افشای حاشیه را در مرور کنید https://www.tradestation.com/disclosuremargin بشر TradeStation Securities ، Inc. و Tradestation Technologies ، Inc. هر یک از شرکتهای تابعه کاملاً متعلق به گروه Tradestation ، Inc. ، هم عملیاتی و هم ارائه محصولات و خدمات ، تحت برند و علائم تجاری هستند. هنگام درخواست ، یا خرید ، حساب ها ، اشتراک ها ، محصولات و خدمات ، مهم است که بدانید با کدام شرکت برخورد کرد. بازدید https://www.tradestation.com/disclosuretscompans برای اطلاعات مهم بیشتر توضیح می دهد که این به چه معنی است.

تسلا بین اوایل آوریل و اواخر ماه مه گزاف گویی کرد ، اما اکنون ممکن است متوقف شود. اولین الگوی در نمودار امروز پایین ترین هفته 331.39 دلار از 22 ماه مه است. TSLA دو هفته پیش زیر آن سطح سقوط کرد و هفته گذشته در همان منطقه قیمت رد شد. آیا حمایت قدیمی به مقاومت جدیدی تبدیل شده است؟ دوم ، سهام در زیر میانگین های حرکت 8- و 21 روزه خود (EMA) کاهش یافته است. EMA 8 روزه نیز در معرض خطر لغزش زیر EMA 21 روزه است. چنین الگوهای ممکن است نشان دهنده نزولی کوتاه مدت باشد. سقوط MACD یک تصویر مشابه را نقاشی می کند. سوم ، سهام EV در ماه دسامبر 488.54 دلار به اوج خود رسید - بالاتر از بالاتر از 414.50 دلار از نوامبر 2021. اما نتوانست نگه داشته شود ، که می تواند به عنوان یک شکست کاذب تلقی شود. این سیگنال ها می توانند توجه معامله گران را به پایین آوریل 214.15 دلار متمرکز کنند ، که هنوز هم بیش از 100 دلار پایین تر از نزدیک TSLA در روز سه شنبه است. سرانجام ، TSLA گزینه های فعال زیرین است. (متوسط حجم روزانه آن 2.6 میلیون قرارداد در ماه گذشته در کل بازار در رده سوم قرار گرفت ، با توجه به TradeStation data.) این می تواند برای معامله گران بتواند موقعیت ها را با تماس ها و تماس ها آسان تر کند. TradingView را بررسی کنید جهش رقابت حمایت مالی توسط Tradestation. تراکم برای ده ها سال است که صنعت تجارت را پیشرفت کرده و دسترسی به سهام ، گزینه ها و آینده را فراهم می کند. اگر برای تجارت متولد شده اید ، ما می توانیم برای شما باشیم. ما را ببینید نمای کلی برای اطلاعات بیشتر عملکرد گذشته ، چه واقعی باشد و چه با آزمون های تاریخی استراتژی ها ، هیچ تضمینی برای عملکرد یا موفقیت آینده ندارد. این احتمال وجود دارد که شما بدون توجه به اینکه کدام کلاس دارایی را تجارت می کنید (سهام ، گزینه ها یا آینده) ممکن است ضرر برابر یا بیشتر از کل سرمایه گذاری خود را تحمل کنید. بنابراین ، شما نباید سرمایه گذاری کنید یا پولی را که نمی توانید از دست بدهید ، سرمایه گذاری کنید. تجارت آنلاین برای همه سرمایه گذاران مناسب نیست. مشاهده سندی با عنوان ویژگی ها و خطرات گزینه های استاندارد در https://www.tradestation.com/disclosteroptions بشر قبل از معامله هر کلاس دارایی ، مشتریان باید بیانیه های مربوط به افشای ریسک را بخوانند https://www.tradestation.com/Immentantent-Information/ بشر دسترسی به سیستم و قرار دادن تجارت و اجرای تجارت ممکن است به دلیل نوسانات و حجم بازار ، تأخیر در نقل قول ، خطاهای سیستم و نرم افزار ، ترافیک اینترنت ، قطع و سایر عوامل به تأخیر بیفتد. معاملات اوراق بهادار و معاملات آتی توسط TradeStation Securities ، Inc. ، یک دلال دلال ثبت شده در کمیسیون اوراق بهادار و بورس و یک بازرگان کمیسیون آینده دارای مجوز در کمیسیون معاملات آینده کالاها به مشتریان خود مستقر ارائه می شود). اوراق بهادار Tradestation عضو سازمان نظارتی صنعت مالی ، انجمن ملی آینده و تعدادی از صرافی ها است. معاملات گزینه ها برای همه سرمایه گذاران مناسب نیست. درخواست حساب اوراق بهادار TradeStation شما به گزینه های تجارت بر اساس کلیه عوامل مرتبط ، از جمله تجربه معاملاتی شما ، در نظر گرفته می شود و تأیید یا تأیید می شود. دیدن https://www.tradestation.com/disclosteroptions بشر بازدید https://www.tradestation.com/pricing برای جزئیات کامل در مورد هزینه ها و هزینه های مرتبط با گزینه ها. معاملات حاشیه شامل خطرات است و مهم است که شما قبل از تجارت در حاشیه ، آن خطرات را کاملاً درک کنید. بیانیه افشای حاشیه بسیاری از این خطرات را تشریح می کند ، از جمله اینکه می توانید بودجه بیشتری را نسبت به واریز در حساب حاشیه خود از دست دهید. شرکت کارگزاری شما می تواند فروش اوراق بهادار را در حساب شما مجبور کند. شرکت کارگزاری شما می تواند اوراق بهادار شما را بدون تماس با شما بفروشد. و شما حق ندارید در یک تماس حاشیه ای تمدید کنید. بیانیه افشای حاشیه را در مرور کنید https://www.tradestation.com/disclosuremargin بشر TradeStation Securities ، Inc. و Tradestation Technologies ، Inc. هر یک از شرکتهای تابعه کاملاً متعلق به گروه Tradestation ، Inc. ، هم عملیاتی و هم ارائه محصولات و خدمات ، تحت برند و علائم تجاری هستند. هنگام درخواست ، یا خرید ، حساب ها ، اشتراک ها ، محصولات و خدمات ، مهم است که بدانید با کدام شرکت برخورد کرد. بازدید https://www.tradestation.com/disclosuretscompans برای اطلاعات مهم بیشتر توضیح می دهد که این به چه معنی است.

اپل در تمام سال دست و پنجه نرم کرده است و ممکن است شواهدی از روند نزولی در غول فناوری در حال رشد باشد. اولین الگوی نمودار امروز پایین تر از اواسط ماه مه است. همراه با پایین 7 مه 193.25 دلار ، برخی از معامله گران ممکن است فکر کنند که یک مثلث نزولی شکل می گیرد. این یک شکل گیری بالقوه نزولی است. دوم ، Tradestation data نشان می دهد که AAPL تنها شرکت تریلیون دلاری است که هم اکنون زیر میانگین حرکت ساده 200 روزه خود (SMA) معامله می کند. SMA 200 روزه نیز پایین تر شده است. این نقاط ممکن است تأیید کنند که عمل قیمت بلند مدت کمتر صعودی است. در مرحله بعد ، قیمت های باقی مانده در زیر سقوط 50 روزه SMA ممکن است ضعف واسطه ای را نشان دهد. چهارم ، روندهای کوتاه مدت ممکن است در حال افزایش باشد: میانگین حرکت 8 روزه نمایی (EMA) زیر EMA 21 روزه است و MACD در حال سقوط است. سرانجام ، AAPL یکی از فعال ترین زمینه های بازار گزینه ها است. این می تواند به بازرگانان کمک کند تا با تماس ها و قرار دادن مواضع خود را بگیرند. TradingView را بررسی کنید جهش رقابت حمایت مالی توسط Tradestation. تراکم برای ده ها سال است که صنعت تجارت را پیشرفت کرده و دسترسی به سهام ، گزینه ها و آینده را فراهم می کند. اگر برای تجارت متولد شده اید ، ما می توانیم برای شما باشیم. ما را ببینید نمای کلی برای اطلاعات بیشتر عملکرد گذشته ، چه واقعی باشد و چه با آزمون های تاریخی استراتژی ها ، هیچ تضمینی برای عملکرد یا موفقیت آینده ندارد. این احتمال وجود دارد که شما بدون توجه به اینکه کدام کلاس دارایی را تجارت می کنید (سهام ، گزینه ها یا آینده) ممکن است ضرر برابر یا بیشتر از کل سرمایه گذاری خود را تحمل کنید. بنابراین ، شما نباید سرمایه گذاری کنید یا پولی را که نمی توانید از دست بدهید ، سرمایه گذاری کنید. تجارت آنلاین برای همه سرمایه گذاران مناسب نیست. مشاهده سندی با عنوان ویژگی ها و خطرات گزینه های استاندارد در https://www.tradestation.com/disclosteroptions بشر قبل از معامله هر کلاس دارایی ، مشتریان باید بیانیه های مربوط به افشای ریسک را بخوانند https://www.tradestation.com/Immentantent-Information/ بشر دسترسی به سیستم و قرار دادن تجارت و اجرای تجارت ممکن است به دلیل نوسانات و حجم بازار ، تأخیر در نقل قول ، خطاهای سیستم و نرم افزار ، ترافیک اینترنت ، قطع و سایر عوامل به تأخیر بیفتد. معاملات اوراق بهادار و معاملات آتی توسط TradeStation Securities ، Inc. ، یک دلال دلال ثبت شده در کمیسیون اوراق بهادار و بورس و یک بازرگان کمیسیون آینده دارای مجوز در کمیسیون معاملات آینده کالاها به مشتریان خود مستقر ارائه می شود). اوراق بهادار Tradestation عضو سازمان نظارتی صنعت مالی ، انجمن ملی آینده و تعدادی از صرافی ها است. معاملات گزینه ها برای همه سرمایه گذاران مناسب نیست. درخواست حساب اوراق بهادار TradeStation شما به گزینه های تجارت بر اساس کلیه عوامل مرتبط ، از جمله تجربه معاملاتی شما ، در نظر گرفته می شود و تأیید یا تأیید می شود. دیدن https://www.tradestation.com/disclosteroptions بشر بازدید https://www.tradestation.com/pricing برای جزئیات کامل در مورد هزینه ها و هزینه های مرتبط با گزینه ها. معاملات حاشیه شامل خطرات است و مهم است که شما قبل از تجارت در حاشیه ، آن خطرات را کاملاً درک کنید. بیانیه افشای حاشیه بسیاری از این خطرات را تشریح می کند ، از جمله اینکه می توانید بودجه بیشتری را نسبت به واریز در حساب حاشیه خود از دست دهید. شرکت کارگزاری شما می تواند فروش اوراق بهادار را در حساب شما مجبور کند. شرکت کارگزاری شما می تواند اوراق بهادار شما را بدون تماس با شما بفروشد. و شما حق ندارید در یک تماس حاشیه ای تمدید کنید. بیانیه افشای حاشیه را در مرور کنید https://www.tradestation.com/disclosuremargin بشر TradeStation Securities ، Inc. و Tradestation Technologies ، Inc. هر یک از شرکتهای تابعه کاملاً متعلق به گروه Tradestation ، Inc. ، هم عملیاتی و هم ارائه محصولات و خدمات ، تحت برند و علائم تجاری هستند. هنگام درخواست ، یا خرید ، حساب ها ، اشتراک ها ، محصولات و خدمات ، مهم است که بدانید با کدام شرکت برخورد کرد. بازدید https://www.tradestation.com/disclosuretscompans برای اطلاعات مهم بیشتر توضیح می دهد که این به چه معنی است.

S&P 500 در ماه فوریه به یک سطح جدید جدید رسید. با این حال ، با یک اندازه گیری در تمام قرن در بازار خرس بوده است. نمودار ماهانه امروز نشان می دهد SPX به عنوان نسبت در برابر طلا. با استفاده از این مقایسه ، از زمانی که بیل کلینتون هنوز رئیس جمهور در اوت 2000 بود ، سهام کمتری داشت. این نشان می دهد که چگونه سهام در دهه 1970 ، قبل از شروع یک اجرای 18 ساله در برابر "یادگار وحشیانه" (برای وام گرفتن از جان مینارد کینز) ، چگونه فروپاشیده می شود. سپس حباب بزرگ Equity شکسته شد و سرمایه گذاران اولین مهاجرت خود را به طلا آغاز کردند. آنها متعاقباً در بازارهای نوظهور متنوع شدند و باعث ایجاد بازار خرس سکولار در ایالات متحده شدند. سهام هایی که با بحران فرعی به پایان رسید. S&P 500 در برابر شمش تا سال 2011 ، هنگامی که بانک مردم چین به لرزه درآمده بود ، ادامه یافت. یک یا دو سال بعد ، سهام با شکستن بالاتر از سطح قبلی خود از سال 2007 وارد بازار گاو نر جدید شد. این روند صعودی تا اواخر سال 2021 ادامه یافت ، هنگامی که تورم پس از نفوذ نرخ بهره را بالا برد. طلای جالب توجه خود را به عنوان سیاست محکم فدرال رزرو ، نشانه اولیه قدرت در حال ظهور نگه داشت. لحظه جالب بعدی اوایل سال 2024 بود ، هنگامی که سهام و زرد metal هر دو به اوج های جدید رسیدند. با این حال ، S&P 500 هنوز هم به عنوان نسبت به طلا بیان می شود. با توجه به نگرانی در مورد U. S. برخی از سرمایه گذاران ممکن است تعجب کنند که آیا روند شروع شده از 25 سال پیش ممکن است عملی شود. TradingView را بررسی کنید جهش رقابت حمایت مالی توسط Tradestation. تراکم برای ده ها سال است که صنعت تجارت را پیشرفت کرده و دسترسی به سهام ، گزینه ها و آینده را فراهم می کند. اگر برای تجارت متولد شده اید ، ما می توانیم برای شما باشیم. ما را ببینید نمای کلی برای اطلاعات بیشتر عملکرد گذشته ، چه واقعی باشد و چه با آزمون های تاریخی استراتژی ها ، هیچ تضمینی برای عملکرد یا موفقیت آینده ندارد. این احتمال وجود دارد که شما بدون توجه به اینکه کدام کلاس دارایی را تجارت می کنید (سهام ، گزینه ها یا آینده) ممکن است ضرر برابر یا بیشتر از کل سرمایه گذاری خود را تحمل کنید. بنابراین ، شما نباید سرمایه گذاری کنید یا پولی را که نمی توانید از دست بدهید ، سرمایه گذاری کنید. تجارت آنلاین برای همه سرمایه گذاران مناسب نیست. مشاهده سندی با عنوان ویژگی ها و خطرات گزینه های استاندارد در https://www.tradestation.com/disclosteroptions بشر قبل از معامله هر کلاس دارایی ، مشتریان باید بیانیه های مربوط به افشای ریسک را بخوانند https://www.tradestation.com/Immentantent-Information/ بشر دسترسی به سیستم و قرار دادن تجارت و اجرای تجارت ممکن است به دلیل نوسانات و حجم بازار ، تأخیر در نقل قول ، خطاهای سیستم و نرم افزار ، ترافیک اینترنت ، قطع و سایر عوامل به تأخیر بیفتد. معاملات اوراق بهادار و معاملات آتی توسط TradeStation Securities ، Inc. ، یک دلال دلال ثبت شده در کمیسیون اوراق بهادار و بورس و یک بازرگان کمیسیون آینده دارای مجوز در کمیسیون معاملات آینده کالاها به مشتریان خود مستقر ارائه می شود). اوراق بهادار Tradestation عضو سازمان نظارتی صنعت مالی ، انجمن ملی آینده و تعدادی از صرافی ها است. TradeStation Securities ، Inc. و Tradestation Technologies ، Inc. هر یک از شرکتهای تابعه کاملاً متعلق به Tradestation Group ، Inc. ، هم عملیاتی و هم ارائه محصولات و خدمات ، تحت برند و علائم تجاری هستند. هنگام درخواست ، یا خرید ، حساب ها ، اشتراک ها ، محصولات و خدمات ، مهم است که بدانید با کدام شرکت برخورد کرد. بازدید https://www.tradestation.com/disclosuretscompans برای اطلاعات مهم بیشتر توضیح می دهد که این به چه معنی است.

S&P 500 در ماه گذشته از یک تجمع قدرتمند برخوردار بوده است و اکنون ممکن است برخی از معامله گران پیش بینی کنند که یک حرکت جانبی را پیش بینی کنند. اولین الگوی در نمودار امروز 5،971 ، آخرین هفته آخر هفته 2024 است. این شاخص در هر دو طرف چند بار در ژانویه و اوایل فوریه خرد شده است. در اواخر فوریه و اوایل مارس در آنجا متوقف شد زیرا تعرفه ها در مکزیک و کانادا تأیید شد. SPX قبل از توقف فقط سه امتیاز پایین تر از آن قیمت را به اوج خود رسید. آیا مقاومت قدیمی هنوز عملی است؟ دوم ، SPX در آن جلسه پایین تر و بالاتر از آن قرار گرفت. سه شنبه درست برعکس بود. این ترکیب یک شمع بیرونی و به دنبال آن یک شمع داخل ، ممکن است نشان دهد که تغییر جهت در حال آمدن است. سوم ، شاخص قدرت نسبی وایلدر (RSI) پس از نزدیک شدن به یک وضعیت بیش از حد ، رد شد. در صورت بروز عقب نشینی ، معامله گران ممکن است تقریباً 5،773 را به عنوان پشتیبانی نگاه کنند. این در ژانویه پایین بود و در اواخر ماه مارس زیاد بود. در مرحله بعد ، قیمت ها از نظر تاریخی بسیار بالاتر از میانگین حرکت ساده 50 روزه (SMA) هستند. با این حال ، SMA به سمت بالا می چرخد. این می تواند نشان دهد که روند میانی مدت مثبت تر شده است ، که ممکن است عقب نشینی ها را کم عمق نگه دارد. سرانجام ، به نظر می رسد چند رویداد مهم قبل از چهارشنبه آینده برنامه ریزی شده است. (دقایقی از آخرین جلسه فدرال رزرو و درآمد NVIDIA هر دو در آن زمان انجام می شود.) این که کمبود کاتالیزور نیز ممکن است باعث ایجاد رانش شود - به خصوص با نزدیک شدن به تعطیلات آخر هفته طولانی. TradingView را بررسی کنید جهش رقابت حمایت مالی توسط Tradestation. تراکم برای ده ها سال است که صنعت تجارت را پیشرفت کرده و دسترسی به سهام ، گزینه ها و آینده را فراهم می کند. اگر برای تجارت متولد شده اید ، ما می توانیم برای شما باشیم. ما را ببینید نمای کلی برای اطلاعات بیشتر عملکرد گذشته ، چه واقعی باشد و چه با آزمون های تاریخی استراتژی ها ، هیچ تضمینی برای عملکرد یا موفقیت آینده ندارد. این احتمال وجود دارد که شما بدون توجه به اینکه کدام کلاس دارایی را تجارت می کنید (سهام ، گزینه ها یا آینده) ممکن است ضرر برابر یا بیشتر از کل سرمایه گذاری خود را تحمل کنید. بنابراین ، شما نباید سرمایه گذاری کنید یا پولی را که نمی توانید از دست بدهید ، سرمایه گذاری کنید. تجارت آنلاین برای همه سرمایه گذاران مناسب نیست. مشاهده سندی با عنوان ویژگی ها و خطرات گزینه های استاندارد در https://www.tradestation.com/disclosteroptions بشر قبل از معامله هر کلاس دارایی ، مشتریان باید بیانیه های مربوط به افشای ریسک را بخوانند https://www.tradestation.com/Immentantent-Information/ بشر دسترسی به سیستم و قرار دادن تجارت و اجرای تجارت ممکن است به دلیل نوسانات و حجم بازار ، تأخیر در نقل قول ، خطاهای سیستم و نرم افزار ، ترافیک اینترنت ، قطع و سایر عوامل به تأخیر بیفتد. معاملات اوراق بهادار و معاملات آتی توسط TradeStation Securities ، Inc. ، یک دلال دلال ثبت شده در کمیسیون اوراق بهادار و بورس و یک بازرگان کمیسیون آینده دارای مجوز در کمیسیون معاملات آینده کالاها به مشتریان خود مستقر ارائه می شود). اوراق بهادار Tradestation عضو سازمان نظارتی صنعت مالی ، انجمن ملی آینده و تعدادی از صرافی ها است. TradeStation Securities ، Inc. و Tradestation Technologies ، Inc. هر یک از شرکتهای تابعه کاملاً متعلق به گروه Tradestation ، Inc. ، هم عملیاتی و هم ارائه محصولات و خدمات ، تحت برند و علائم تجاری هستند. هنگام درخواست ، یا خرید ، حساب ها ، اشتراک ها ، محصولات و خدمات ، مهم است که بدانید با کدام شرکت برخورد کرد. بازدید https://www.tradestation.com/disclosuretscompans برای اطلاعات مهم بیشتر توضیح می دهد که این به چه معنی است.

بازار وسیع تر در یک ماه گذشته به شدت دوباره به وجود آمده است ، اما ممکن است اپل عقب بماند. اولین الگوی نمودار امروز اوج 15 آوریل 212.94 دلار است. غول گوشی های هوشمند در اوایل ماه مه و هفته گذشته بدون شکستن آن ، آن سطح را بررسی کرد. (بالاترین سطح اخیر نیز کمی پایین تر بود.) که ممکن است نشان دهد مقاومت در دست است. دوم ، NASDAQ-100 و S&P 500 از اواخر فوریه و اوایل مارس به سطح بازگشتند. گزاف گویی کوچکتر AAPL در مقایسه با بازار گسترده تر ممکن است نشان دهنده قدرت نسبی ضعیف تر باشد. سوم ، سهام پایین تر از میانگین حرکت روز ساده 200 روزه خود (SMA) است. این همچنین با شاخص های بزرگتر ، که بالاتر از SMA های 200 روزه مربوط به آنها هستند ، در تضاد است. چهارم ، SMA 50 روزه در اوایل ماه آوریل a "صلیب مرگ" زیر SMA 200 روزه داشت و از آن زمان تاکنون در آنجا باقی مانده است. در مرحله بعد ، Stochastics از یک وضعیت بیش از حد در حال غرق شدن است. سرانجام ، AAPL یکی از فعال ترین زمینه های بازار گزینه ها است. (با توجه به TradeStation data.) این می تواند به معامله گران کمک کند تا با تماس ها و قرار دادن مواضع خود را بگیرند. تراکم برای ده ها سال است که صنعت تجارت را پیشرفت کرده و دسترسی به سهام ، گزینه ها و آینده را فراهم می کند. اگر برای تجارت متولد شده اید ، ما می توانیم برای شما باشیم. ما را ببینید نمای کلی برای اطلاعات بیشتر عملکرد گذشته ، چه واقعی باشد و چه با آزمون های تاریخی استراتژی ها ، هیچ تضمینی برای عملکرد یا موفقیت آینده ندارد. این احتمال وجود دارد که شما ممکن است ضرر a برابر یا بیشتر از کل سرمایه گذاری خود را بدون توجه به کلاس دارایی که تجارت می کنید (سهام ، گزینه ها یا آینده) حفظ کنید. بنابراین ، شما نباید سرمایه گذاری کنید یا پولی را که نمی توانید از دست بدهید ، سرمایه گذاری کنید. تجارت آنلاین برای همه سرمایه گذاران مناسب نیست. مشاهده سندی با عنوان ویژگی ها و خطرات گزینه های استاندارد در https://www.tradestation.com/disclosteroptions بشر قبل از معامله هر کلاس دارایی ، مشتریان باید بیانیه های مربوط به افشای ریسک را بخوانند https://www.tradestation.com/Immentantent-Information/ بشر دسترسی به سیستم و قرار دادن تجارت و اجرای تجارت ممکن است به دلیل نوسانات و حجم بازار ، تأخیر در نقل قول ، خطاهای سیستم و نرم افزار ، ترافیک اینترنت ، قطع و سایر عوامل به تأخیر بیفتد. معاملات اوراق بهادار و معاملات آتی به مشتریان خود هدایت شده توسط Tradestation Securities ، Inc. ، a دلال کارگزار ثبت شده در کمیسیون بورس و اوراق بهادار و a بازرگان آتی دارای مجوز با کمیسیون معاملات آینده کالا) ارائه می شود. اوراق بهادار معامله گر a عضو سازمان تنظیم مقررات صنعت مالی ، انجمن ملی آینده و تعداد 7> صرافی ها است. معاملات گزینه ها برای همه سرمایه گذاران مناسب نیست. درخواست حساب اوراق بهادار TradeStation شما به گزینه های تجارت بر اساس کلیه عوامل مرتبط ، از جمله تجربه معاملاتی شما ، در نظر گرفته می شود و تأیید یا تأیید می شود. دیدن https://www.tradestation.com/disclosteroptions بشر بازدید https://www.tradestation.com/pricing برای جزئیات کامل در مورد هزینه ها و هزینه های مرتبط با گزینه ها. معاملات حاشیه شامل خطرات است و مهم است که شما قبل از تجارت در حاشیه ، آن خطرات را کاملاً درک کنید. بیانیه افشای حاشیه بسیاری از این خطرات را تشریح می کند ، از جمله اینکه می توانید بودجه بیشتری را نسبت به واریز در حساب حاشیه خود از دست دهید. شرکت کارگزاری شما می تواند فروش اوراق بهادار را در حساب شما مجبور کند. شرکت کارگزاری شما می تواند اوراق بهادار شما را بدون تماس با شما بفروشد. و شما حق ندارید در تماس با حاشیه a زمان تمدید کنید. بیانیه افشای حاشیه را در مرور کنید https://www.tradestation.com/disclosuremargin بشر TradeStation Securities ، Inc. و Tradestation Technologies ، Inc. هر یک از شرکتهای تابعه کاملاً متعلق به گروه Tradestation ، Inc. ، هم عملیاتی و هم ارائه محصولات و خدمات ، تحت برند و علائم تجاری هستند. هنگام درخواست ، یا خرید ، حساب ها ، اشتراک ها ، محصولات و خدمات ، مهم است که بدانید با کدام شرکت برخورد کرد. بازدید https://www.tradestation.com/disclosuretscompans برای اطلاعات مهم بیشتر توضیح می دهد که این به چه معنی است.

تسلا برای دو ماه گذشته محدود شده است و برخی از معامله گران ممکن است فکر کنند که این کار از جاده خارج شده است. اولین الگوی در نمودار امروز ، مارس بالاتر از 291.85 دلار است. EV maker در اواخر ماه آوریل به همان سطح رسید و در اوایل ماه مه دوباره در آنجا گیر کرده است. این ممکن است نشان دهد مقاومت در دست است. آیا معامله گران به دنبال بازگشت a به پایین ترین سطح اخیر زیر 220 دلار بود؟ در مرحله بعد ، نوسان ساز تصادفی از قلمرو Overbought در حال خاموش شدن است. سوم ، میانگین متحرک 50 روزه (SMA) a "صلیب مرگ" تحت SMA 200 روزه در اواسط آوریل داشت. این ممکن است نشان دهد که روند طولانی مدت آن نزولی تر می شود. سرانجام ، TSLA یکی از فعال ترین زیر مجموعه های بازار گزینه ها است. (طبق گفته های TradeStation data.) این ممکن است به معامله گران کمک کند تا با تماس و قرار دادن مواضع بگیرند. تراکم برای ده ها سال است که صنعت تجارت را پیشرفت کرده و دسترسی به سهام ، گزینه ها و آینده را فراهم می کند. اگر برای تجارت متولد شده اید ، ما می توانیم برای شما باشیم. ما را ببینید نمای کلی برای اطلاعات بیشتر عملکرد گذشته ، چه واقعی باشد و چه با آزمون های تاریخی استراتژی ها ، هیچ تضمینی برای عملکرد یا موفقیت آینده ندارد. این احتمال وجود دارد که شما ممکن است ضرر a برابر یا بیشتر از کل سرمایه گذاری خود را بدون توجه به اینکه کدام کلاس دارایی را تجارت می کنید (سهام ، گزینه ها یا آینده) تحمل کنید. بنابراین ، شما نباید سرمایه گذاری کنید یا پولی را که نمی توانید از دست بدهید ، سرمایه گذاری کنید. تجارت آنلاین برای همه سرمایه گذاران مناسب نیست. مشاهده سندی با عنوان ویژگی ها و خطرات گزینه های استاندارد در https://www.tradestation.com/disclosteroptions بشر قبل از معامله هر کلاس دارایی ، مشتریان باید بیانیه های مربوط به افشای ریسک را بخوانند https://www.tradestation.com/Immentantent-Information/ بشر دسترسی به سیستم و قرار دادن تجارت و اجرای تجارت ممکن است به دلیل نوسانات و حجم بازار ، تأخیر در نقل قول ، خطاهای سیستم و نرم افزار ، ترافیک اینترنت ، قطع و سایر عوامل به تأخیر بیفتد. معاملات اوراق بهادار و معاملات آتی به مشتریان خود هدایت شده توسط Tradestation Securities ، Inc. ، a دلال کارگزار ثبت شده در کمیسیون اوراق بهادار و بورس و a بازرگان کمیسیون آینده دارای مجوز با کمیسیون معاملات آینده کالا) ارائه می شود. اوراق بهادار Tradestation a عضو سازمان تنظیم مقررات صنعت مالی ، انجمن ملی آینده و تعداد a مبادلات است. معاملات گزینه ها برای همه سرمایه گذاران مناسب نیست. درخواست حساب اوراق بهادار TradeStation شما به گزینه های تجارت بر اساس کلیه عوامل مرتبط ، از جمله تجربه معاملاتی شما ، در نظر گرفته می شود و تأیید یا تأیید می شود. دیدن https://www.tradestation.com/disclosteroptions بشر بازدید https://www.tradestation.com/pricing برای جزئیات کامل در مورد هزینه ها و هزینه های مرتبط با گزینه ها. معاملات حاشیه شامل خطرات است و مهم است که شما قبل از تجارت در حاشیه ، آن خطرات را کاملاً درک کنید. بیانیه افشای حاشیه بسیاری از این خطرات را تشریح می کند ، از جمله اینکه می توانید بودجه بیشتری را نسبت به واریز در حساب حاشیه خود از دست دهید. شرکت کارگزاری شما می تواند فروش اوراق بهادار را در حساب شما مجبور کند. شرکت کارگزاری شما می تواند اوراق بهادار شما را بدون تماس با شما بفروشد. و شما حق ندارید در تماس با حاشیه a زمان تمدید داشته باشید. بیانیه افشای حاشیه را در مرور کنید https://www.tradestation.com/disclosuremargin بشر TradeStation Securities ، Inc. و Tradestation Technologies ، Inc. هر یک از شرکتهای تابعه کاملاً متعلق به Tradestation Group ، Inc. ، هم عملیاتی و هم ارائه محصولات و خدمات ، تحت برند و علائم تجاری هستند. هنگام درخواست ، یا خرید ، حساب ها ، اشتراک ها ، محصولات و خدمات ، مهم است که بدانید با کدام شرکت برخورد کرد. بازدید https://www.tradestation.com/disclosuretscompans برای اطلاعات مهم بیشتر توضیح می دهد که این به چه معنی است.

Nvidia به همراه بازار وسیع دوباره در حال بازگشت است و برخی از معامله گران ممکن است فکر کنند که آماده شتاب می شود. اولین الگوی در نمودار امروز 9 آوریل از 115.10 دلار است. غول تراشه در دو جلسه اخیر این سطح را به چالش کشیده است. نزدیک به این مقاومت ممکن است به عنوان تأیید یک شکست تلقی شود. دوم سری اوج پایین از اواسط فوریه است. دیروز NVDA بالاتر از آن خط روند سقوط بسته و امروز بالاتر از آن است. سوم ، MACD بالاتر شده است. سرانجام ، NVDA یک زیر نظر بسیار فعال در بازار گزینه ها است. (طبق گفته های TradeStation data.) این می تواند به معامله گران کمک کند تا با تماس و تماس با آنها موضع بگیرند. تراکم برای ده ها سال است که صنعت تجارت را پیشرفت کرده و دسترسی به سهام ، گزینه ها و آینده را فراهم می کند. اگر برای تجارت متولد شده اید ، ما می توانیم برای شما باشیم. ما را ببینید نمای کلی برای اطلاعات بیشتر عملکرد گذشته ، چه واقعی باشد و چه با آزمون های تاریخی استراتژی ها ، هیچ تضمینی برای عملکرد یا موفقیت آینده ندارد. این احتمال وجود دارد که شما بدون توجه به اینکه کدام کلاس دارایی را تجارت می کنید (سهام ، گزینه ها یا آینده) ممکن است ضرر برابر یا بیشتر از کل سرمایه گذاری خود را تحمل کنید. بنابراین ، شما نباید سرمایه گذاری کنید یا پولی را که نمی توانید از دست بدهید ، سرمایه گذاری کنید. تجارت آنلاین برای همه سرمایه گذاران مناسب نیست. مشاهده سندی با عنوان ویژگی ها و خطرات گزینه های استاندارد در https://www.tradestation.com/disclosteroptions بشر قبل از معامله هر کلاس دارایی ، مشتریان باید بیانیه های مربوط به افشای ریسک را بخوانند https://www.tradestation.com/Immentantent-Information/ بشر دسترسی به سیستم و قرار دادن تجارت و اجرای تجارت ممکن است به دلیل نوسانات و حجم بازار ، تأخیر در نقل قول ، خطاهای سیستم و نرم افزار ، ترافیک اینترنت ، قطع و سایر عوامل به تأخیر بیفتد. معاملات اوراق بهادار و معاملات آتی توسط TradeStation Securities ، Inc. ، یک دلال دلال ثبت شده در کمیسیون اوراق بهادار و بورس و یک بازرگان کمیسیون آینده دارای مجوز در کمیسیون معاملات آینده کالاها به مشتریان خود مستقر ارائه می شود). اوراق بهادار Tradestation عضو سازمان نظارتی صنعت مالی ، انجمن ملی آینده و تعدادی از صرافی ها است. معاملات گزینه ها برای همه سرمایه گذاران مناسب نیست. درخواست حساب اوراق بهادار TradeStation شما به گزینه های تجارت بر اساس کلیه عوامل مرتبط ، از جمله تجربه معاملاتی شما ، در نظر گرفته می شود و تأیید یا تأیید می شود. دیدن https://www.tradestation.com/disclosteroptions بشر بازدید https://www.tradestation.com/pricing برای جزئیات کامل در مورد هزینه ها و هزینه های مرتبط با گزینه ها. معاملات حاشیه شامل خطرات است و مهم است که شما قبل از تجارت در حاشیه ، آن خطرات را کاملاً درک کنید. بیانیه افشای حاشیه بسیاری از این خطرات را تشریح می کند ، از جمله اینکه می توانید بودجه بیشتری را نسبت به واریز در حساب حاشیه خود از دست دهید. شرکت کارگزاری شما می تواند فروش اوراق بهادار را در حساب شما مجبور کند. شرکت کارگزاری شما می تواند اوراق بهادار شما را بدون تماس با شما بفروشد. و شما حق ندارید در یک تماس حاشیه ای تمدید کنید. بیانیه افشای حاشیه را در مرور کنید https://www.tradestation.com/disclosuremargin بشر TradeStation Securities ، Inc. و Tradestation Technologies ، Inc. هر یک از شرکتهای تابعه کاملاً متعلق به Tradestation Group ، Inc. ، هم عملیاتی و هم ارائه محصولات و خدمات ، تحت برند و علائم تجاری هستند. هنگام درخواست ، یا خرید ، حساب ها ، اشتراک ها ، محصولات و خدمات ، مهم است که بدانید با کدام شرکت برخورد کرد. بازدید https://www.tradestation.com/disclosuretscompans برای اطلاعات مهم بیشتر توضیح می دهد که این به چه معنی است.

طلا در سال جاری روند صعودی داشته است و برخی از خریداران در کفهای قیمتی ممکن است در آخرین اصلاح قیمت آن فرصتی را ببینند. اولین الگو در نمودار امروز، سری سقفها و کفهای بالاتر از ماه ژانویه است. XAUUSD تا پایین کانال صعودی خود کاهش یافته است. آیا این کاهش به کف قیمتی بالاتر دیگری تبدیل شد؟ دوم، اصلاح قیمت در نزدیکی سقف فوریه در حدود 2956 تثبیت شده است. این می تواند نشان دهد که مقاومت قبلی به حمایت جدید تبدیل شده است. سوم، استوکاستیک به وضعیت اشباع فروش رسیده است. در نهایت، میانگین متحرک ساده 50 روزه از پایین در حال افزایش است. TradeStation برای دههها صنعت تجارت را توسعه داده و دسترسی به سهام، آپشن و فیوچرز را فراهم کرده است. اگر برای تجارت متولد شدهاید، ما میتوانیم برای شما مناسب باشیم. برای اطلاعات بیشتر به صفحه Overview ما مراجعه کنید. عملکرد گذشته، چه واقعی باشد و چه با آزمایشهای تاریخی استراتژیها نشان داده شده باشد، تضمینی برای عملکرد یا موفقیت در آینده نیست. این احتمال وجود دارد که شما ضرری برابر یا بیشتر از کل سرمایه گذاری خود را متحمل شوید، صرف نظر از اینکه در کدام طبقه دارایی (سهام، آپشن یا فیوچرز) معامله می کنید. بنابراین، نباید پولی را سرمایه گذاری یا به خطر بیندازید که توانایی از دست دادن آن را ندارید. معاملات آنلاین برای همه سرمایه گذاران مناسب نیست. سند با عنوان "ویژگی ها و خطرات آپشن های استاندارد" را در https://www.TradeStation.com/DisclosureOptions مشاهده کنید. قبل از معامله هر طبقه دارایی، مشتریان باید بیانیه های افشای خطر مربوطه را در https://www.TradeStation.com/Important-Information/ مطالعه کنند. دسترسی به سیستم و قرار دادن و اجرای معاملات ممکن است به دلیل نوسانات و حجم بازار، تاخیر در قیمتها، خطاهای سیستم و نرمافزار، ترافیک اینترنت، قطعیها و سایر عوامل به تاخیر بیفتد یا با شکست مواجه شود. معاملات اوراق بهادار و فیوچرز به مشتریان خودگردان توسط TradeStation Securities, Inc.، یک کارگزار-معاملهگر ثبتشده با کمیسیون بورس و اوراق بهادار و یک کارگزار کمیسیون فیوچرز دارای مجوز از کمیسیون معاملات آتی کالا، ارائه میشود. TradeStation Securities عضو سازمان نظارت مالی (FINRA)، انجمن ملی معاملات آتی (NFA) و تعدادی از صرافیها است. TradeStation Securities, Inc. و TradeStation Technologies, Inc. هر دو شرکت تابعه کاملاً متعلق به TradeStation Group, Inc. هستند که هر دو تحت برند و علامت تجاری TradeStation فعالیت میکنند و محصولات و خدمات ارائه میدهند. هنگام درخواست یا خرید حسابها، اشتراکها، محصولات و خدمات، مهم است که بدانید با کدام شرکت سروکار داشت. برای اطلاعات مهم بیشتر که توضیح میدهد این به چه معناست، به https://www.TradeStation.com/DisclosureTSCompanies مراجعه کنید.
سلب مسئولیت
هر محتوا و مطالب مندرج در سایت و کانالهای رسمی ارتباطی سهمتو، جمعبندی نظرات و تحلیلهای شخصی و غیر تعهد آور بوده و هیچگونه توصیهای مبنی بر خرید، فروش، ورود و یا خروج از بازار بورس و ارز دیجیتال نمی باشد. همچنین کلیه اخبار و تحلیلهای مندرج در سایت و کانالها، صرفا بازنشر اطلاعات از منابع رسمی و غیر رسمی داخلی و خارجی است و بدیهی است استفاده کنندگان محتوای مذکور، مسئول پیگیری و حصول اطمینان از اصالت و درستی مطالب هستند. از این رو ضمن سلب مسئولیت اعلام میدارد مسئولیت هرنوع تصمیم گیری و اقدام و سود و زیان احتمالی در بازار سرمایه و ارز دیجیتال، با شخص معامله گر است.