
TheCryptagon
@t_TheCryptagon

تریدر چه نمادی را توصیه به خرید کرده؟
سابقه خرید
تخمین بازدهی ماه به ماه تریدر
پیام های تریدر
فیلتر
نوع پیام
TheCryptagon
S&P500 finishing re-accumulation and sets eyes on 6230.
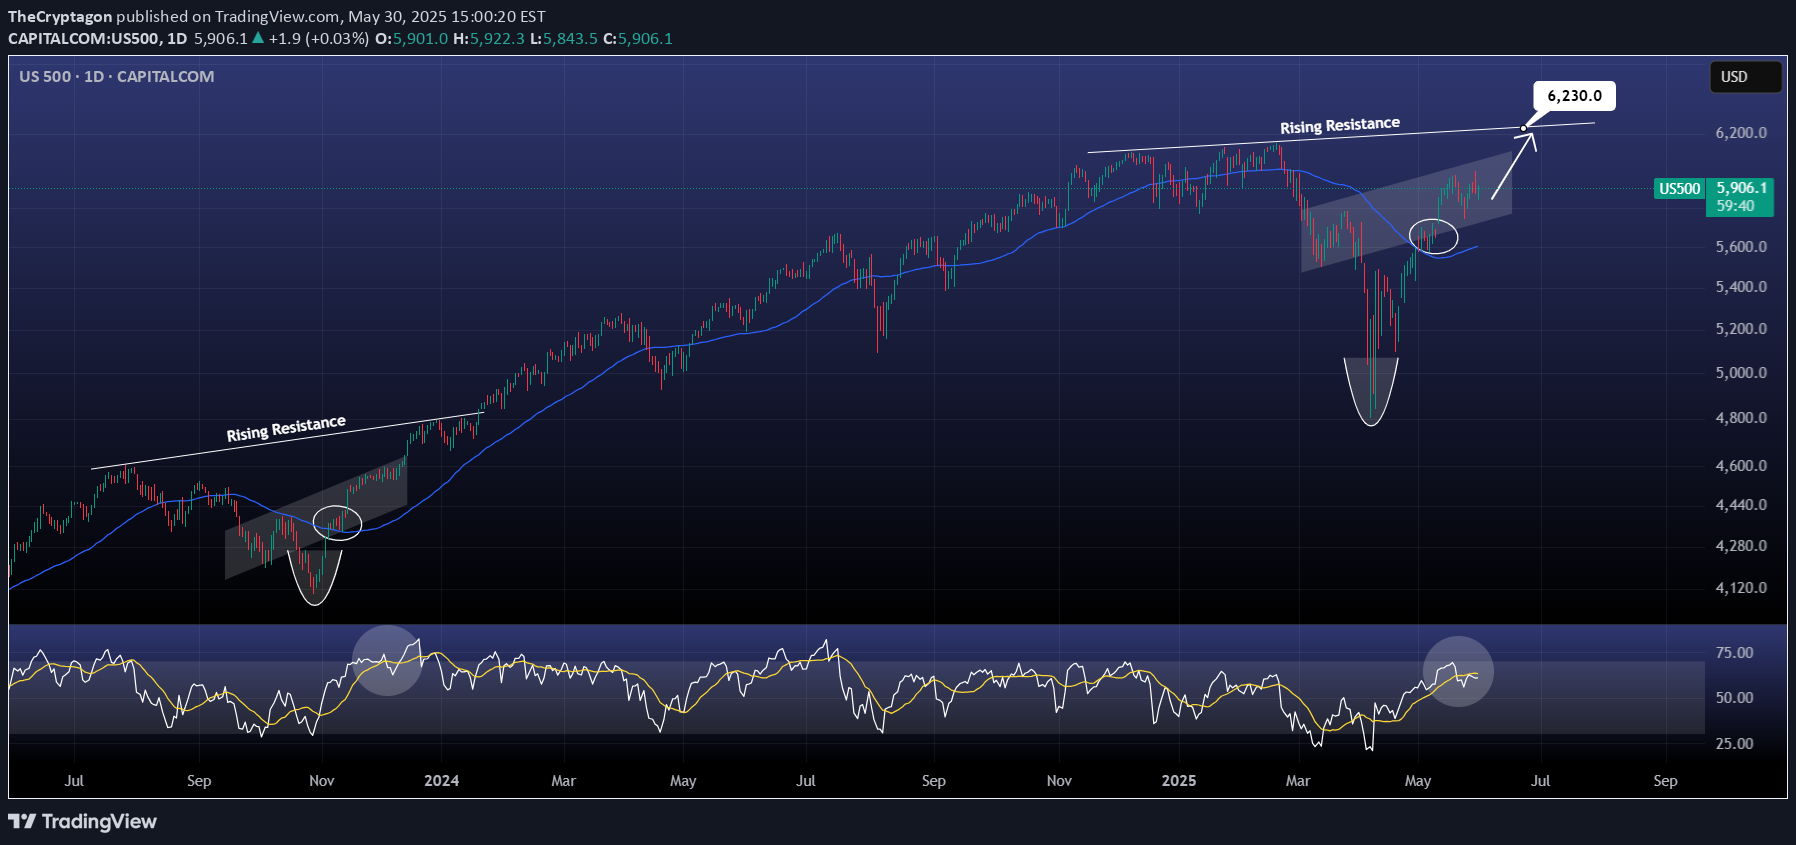
S & P500 / SPX پس از بهبودی چشمگیر از پایین آوریل ، به پهلو تبدیل شده است. 1DAY MA50 همان نوع پشتیبانی را که پس از بازگشت در اکتبر 2023 انجام داد ، فراهم می کند. الگوی RSI در هر دو سکانس نیز مشابه است و نشان می دهد که قیمت در جایی است که به سمت بالا به مقاومت در حال افزایش می رسد. هدف 6230. مانند ایده ، ما را دنبال کنید و نظر خود را در زیر بگذارید !!
TheCryptagon
GOLD Consolidation not over but long term still bullish.

Gold / Xauusd روند طولانی مدت خود را تغییر نداده است ، که از اکتبر 2023 در داخل یک کانال صعودی باقی مانده است. هرچند که ، بیشتر از این نیست که ادغام آن را از 21 آوریل تمدید کند. ایده را در زیر بگذارید !!
TheCryptagon
Will XMR tripple top?
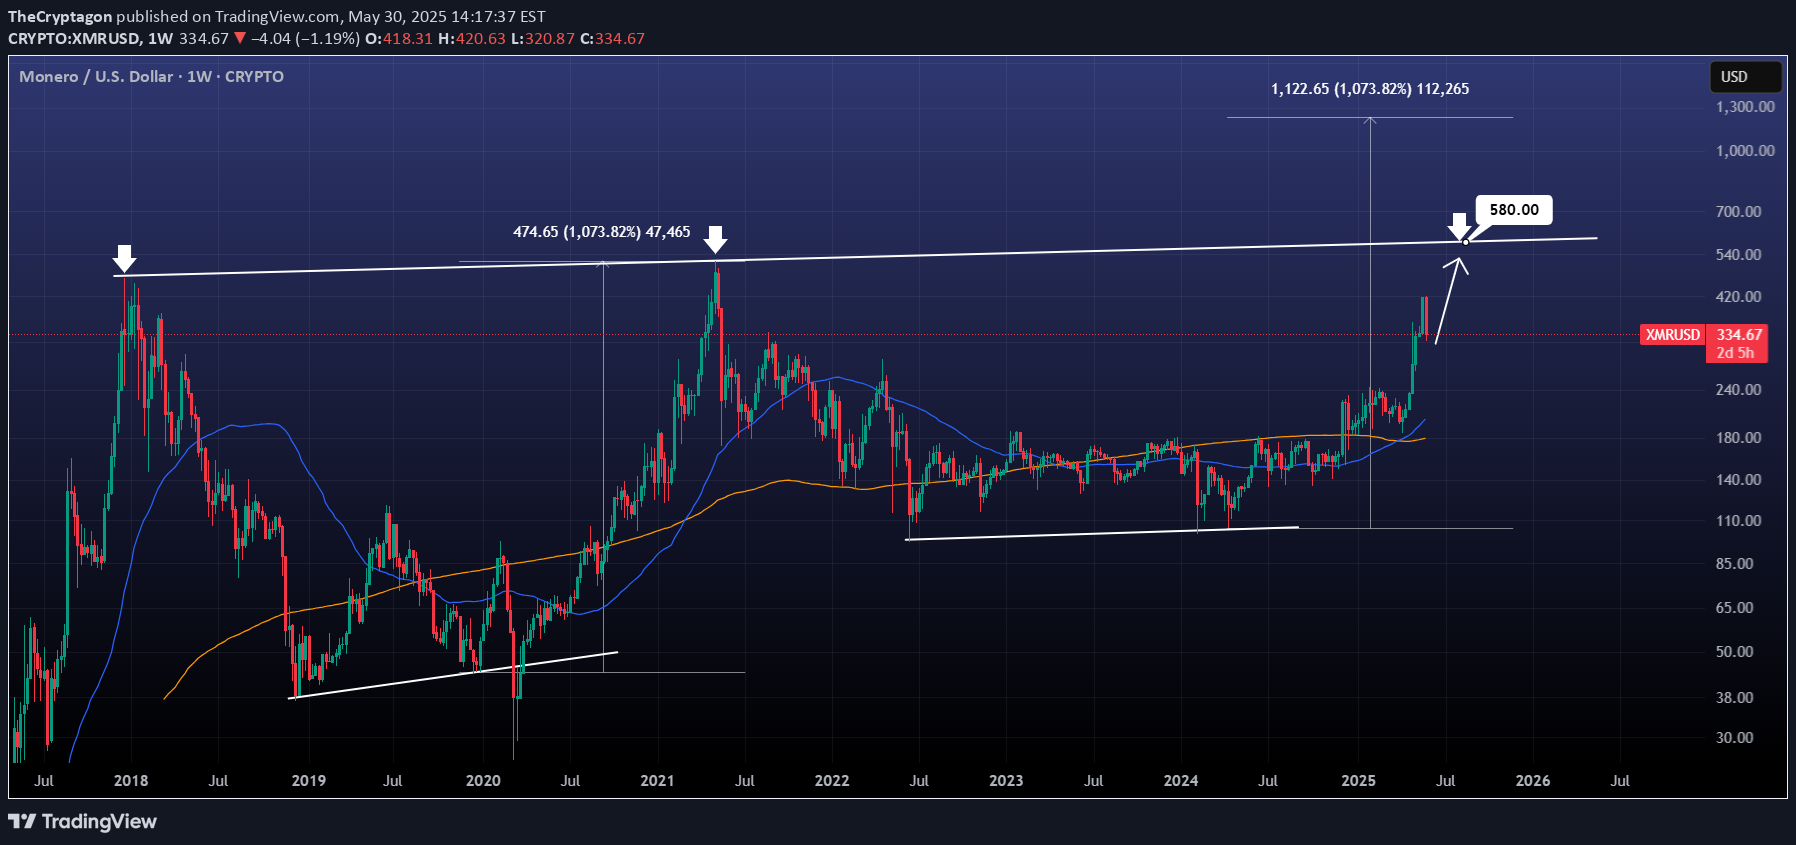
Monero / XMRUSD با وجود اصلاح فنی طبیعی این هفته ، از 7 ماه آوریل دستاوردهای شگفت انگیزی را مشاهده کرده است. مقاومت گسترده ای وجود دارد که منشأ آن از 18 دسامبر 2017 است که قیمت آن را نیز در بالای چرخه 2021 قرار داده است ، که به عنوان هدفمندترین هدف بعدی قرار دارد. 2021. ما را مانند ایده دنبال کنید و نظر خود را در زیر بگذارید !!
TheCryptagon
ETHEREUM can reach $10000 if 2017 is repeated.

Ethereum / EthusD در حال ادغام تحت 1Day MA200 (مقاومت) و بیش از 1Day MA50 (پشتیبانی) است. تصحیح 2025 تاکنون کاملاً مشابه سال 2016 بوده است ، هر دو کانال نزولی که روی یک الگوی مثلث قرار دارند ، و سپس دوباره بازگشتند. دوباره به این نتیجه می رسد که این زمان به سرعت در حال افزایش است و می تواند به سرعت در حال افزایش باشد. 3.0 فیبر در 10000 و form صدر این چرخه. ما را مانند ایده دنبال کنید و نظر خود را در زیر بگذارید !!
TheCryptagon
TONUSD forming the new bottom. Target $14.000.

تونکوین / TONUSD در حال تثبیت بالای خط حمایت صعودی بلندمدت خود است. آخرین باری که این اتفاق افتاد، قیمت یک صعود سهموی به سمت سطح 4.0 فیبوناچی اکستنشن را آغاز کرد. خرید کنید و هدف خود را 14.000 قرار دهید. ما را دنبال کنید، ایده را لایک کنید و در زیر نظر بگذارید!!
TheCryptagon
BITCOIN can aim as high as $300k on this Cycle

جفت ارزی ۰/ BTCUSD از زمان اوج دسامبر ۲۰۱۷ در یک کانال صعودی معامله میشود. این الگو در حال حاضر ۲ چرخه را طی کرده و از نظر فنی، هدف آن رسیدن به بالای کانال صعودی است. یک افزایش جدید +۲۱۱۹ درصدی تا سقف کانال میتواند از ۳۰۰ هزار دلار فراتر رود. ما را دنبال کنید، این ایده را بپسندید و در زیر نظر خود را بنویسید!!
TheCryptagon
XLMUSD Huge breakout may happen any moment.

Stellar / XLMUSD دوباره در حال آزمایش مقاومت نزولی 6 ماهه است، در حالی که در داخل یک کانال صعودی معامله می شود. RSI یک روزه به شدت از این حرکت پشتیبانی می کند و ممکن است در نهایت یک کندل یک روزه را مجبور به بسته شدن بالای مقاومت کند. اگر این اتفاق بیفتد، وارد موقعیت خرید شوید و هدف 0.3650 (+32.79%) را تعیین کنید. نمودار قبلی: ما را دنبال کنید، ایده را لایک کنید و در زیر نظر بگذارید!!
TheCryptagon
TRUMPUSDT Massive breakout above the Triangle.

رسمی Trump / TRUMPUSDT به تازگی از الگوی مثلثی یک ماهه خود عبور کرد، پس از جهش در 6 می بر روی میانگین متحرک 50 روزه. پتانسیل صعودی در بلندمدت بسیار زیاد است، اما حتی در آینده نزدیک، از نظر فنی، هدف آن گسترش 2.0 فیبوناچی است. بخرید و هدف 25.50 را در نظر بگیرید. ما را دنبال کنید، ایده را لایک کنید و در زیر نظر بگذارید!!
TheCryptagon
SANDUSD targeting the 1day MA200 at 0.42000

سنباکس / SANDUSD از زمانی که در حمایت A به کف دوقلو رسید و از مقاومت نزولی عبور کرد، وارد ساختار کانال صعودی شده است. اکنون توسط میانگین متحرک 50 روزه (MA50) حمایت میشود و هدف آن دستیابی به اوج بالاتر جدید در میانگین متحرک 200 روزه (MA200) است. هدف: 0.42000 ما را دنبال کنید، ایده را لایک کنید و در زیر نظر بگذارید!!
TheCryptagon
XRPUSD Bull Flag broken. Can it go x10 from here?

XRPUSD از الگوی پرچم گاوی خود عبور کرده است، که الگوی اصلاحی جنگ تجاری از اوج ژانویه بوده است. همزمان، یک تقاطع طلایی یک روزه در حال شکلگیری است و اگر همان صعودی را که پس از انتخابات اخیر S آمریکا شاهد بودیم، تجربه کنیم، قیمت ممکن است به گسترش فیبوناچی 2.0 hit. برسد. این نشاندهنده یک حرکت جسورانه ۱۰ برابری از اینجا با هدف ۲۳ دلار است. آیا فکر میکنید این در این چرخه امکانپذیر است؟ ما را دنبال کنید، ایده را لایک کنید و نظر خود را در زیر بنویسید!!
سلب مسئولیت
هر محتوا و مطالب مندرج در سایت و کانالهای رسمی ارتباطی سهمتو، جمعبندی نظرات و تحلیلهای شخصی و غیر تعهد آور بوده و هیچگونه توصیهای مبنی بر خرید، فروش، ورود و یا خروج از بازارهای مالی نمی باشد. همچنین کلیه اخبار و تحلیلهای مندرج در سایت و کانالها، صرفا بازنشر اطلاعات از منابع رسمی و غیر رسمی داخلی و خارجی است و بدیهی است استفاده کنندگان محتوای مذکور، مسئول پیگیری و حصول اطمینان از اصالت و درستی مطالب هستند. از این رو ضمن سلب مسئولیت اعلام میدارد مسئولیت هرنوع تصمیم گیری و اقدام و سود و زیان احتمالی در بازار سرمایه و ارز دیجیتال، با شخص معامله گر است.