
TVSltd_algoindicators
@t_TVSltd_algoindicators

تریدر چه نمادی را توصیه به خرید کرده؟
سابقه خرید
تخمین بازدهی ماه به ماه تریدر
پیام های تریدر
فیلتر
نوع پیام
TVSltd_algoindicators
Buy ETH Today to Double Tomorrow

خرید ETH امروز برای دو برابر کردن فردا - فرصت سرمایه گذاری در میان مدت ، این افراد دوباره Tradevietstock هستند! ETH دارندگان از عمل جانبی خسته شده اند - و به طور قابل ملاحظه ای. اما من معتقدم که لحظه مناسب در نهایت نزدیک می شود - و این می تواند همه چیز را تغییر دهد. این فرصت آینده می تواند به شما امکان دهد سرمایه گذاری خود را دو برابر کنید ، سوار شدن بعدی major ETH برای سود قابل توجهی .1. ETH بازارهای خرس اخیر در اواخر سال 2024 ، Ethereum نزدیک به 70 ٪ کاهش یافته است ، بدون اینکه موج صعودی قابل توجهی در چشم بینایی داشته باشد. این دوره به عنوان یکی از راکد ترین و غیرقابل تحمل ترین مراحل در تاریخ ETH - یک بازار خرس طولانی مدت است که با علی رغم اینکه از نظر متعهدانه ترین متعهدانه ها را تست داده است ، علی رغم اینکه از نظر متعهدانه ترین و اعتقادات خود را به وجود آورده است. بازارها غالباً در چرخه ها حرکت می کنند ، و این نوع ادغام عمیق و طولانی می تواند پیشرو باشد. بر خلاف تصادفات ناگهانی ، این کاهش با یک حرکت آهسته و مداوم که اعتماد به نفس را با گذشت زمان تخلیه می کرد ، مشخص شد. شمع های نزولی در ابتدا افراطی نبودند ، اما فرسایش پایدار در قیمت آن را به یک مرحله دردناک برای دارندگان ETH تبدیل کرد. این کاهش کشیده همان چیزی است که واقعاً بازار خرس را تعریف می کند-نه فقط عمق قطره بلکه مدت زمان و عوارض روانی آن. همانطور که اغلب اتفاق می افتد ، مرحله آخر سخت ترین بود: در اواخر سال 2024 ، ETH بیش از 10 ٪ در یک روز کاهش یافت ، یک حرکت کاپیتولاسیون که آنچه را که اکنون بسیاری از آنها را به عنوان پایین طولانی مدت آن می شناسند ، نشان می دهد. پس از تحمل یک بازار خرس طولانی و چندین شمع نزولی شدید ، ETH سرانجام آن را تأیید کرده و تقریباً 76 ٪ از آن دوباره تغییر یافته است. این یک الگوی کلاسیک است: وقتی بیشتر مردم ترس ، حوصله و یا تسلیم شدن دارند - این زمانی است که فرصت واقعی شروع می شود. این مرحله ، که اغلب توسط اکثریت نادیده گرفته می شود ، دقیقاً زمانی است که سرمایه گذاران هوشمند خود را برای موج بعدی قرار می دهند. در سال 2022 ، Ethereum یکی از شدیدترین کاهش های خود را تا کنون تجربه کرد و تقریباً 80 ٪ از اوج خود کاهش یافت. پس از تصادف اولیه در حدود 50 ٪ ، ETH قبل از ادامه مسیر نزولی خود ، شاهد بازگشت مجدد کوتاه مدت-در حدود 50 ٪-افزایش یافته است. پس از هرگونه کاهش major ، ما معمولاً به دنبال یک شکستن صعودی به عنوان سیگنال شروع می شود. جالب اینجاست که فرصت های خرید قوی اغلب در نزدیکی شکستگی های نزولی یافت می شود - به ویژه هنگامی که شمع های نزولی شدید ظاهر می شوند ، زیرا آنها اغلب مرحله نهایی کاپیتولاسیون را قبل از معکوس نشان می دهند. نمونه هایی از شمع های نزولی شدید: 2. سیگنال های لازم برای خرید Ethfirstly ، ما برای تأیید پایان بازار خرس و شروع یک صعود به شمع های شکستن صعودی نیاز داریم. از این رو ، ما به احتمال زیاد می توانیم انتظار داشته باشیم که یک شمع نزولی افراطی درست قبل از شکستن صعودی ظاهر شود. این حرکت شدید حتی می تواند حمایت اخیر 1،378 دلار را انجام دهد ، و باعث ترس شدید در سراسر بازار و در بازار ETH Communition. دست های ضعیف و مرحله ای را برای یک شکستن قوی به سمت بالا تنظیم کنید. سیگنال من: موقعیت: BuyEntry: 1378-1675Target: 4100DisClaimer: این یک استراتژی سرمایه گذاری میان مدت است ، برای معاملات کوتاه مدت در نظر گرفته نشده است. اگر شما یک معامله گر کوتاه مدت هستید ، لطفاً این طرح را متناسب با مشخصات ریسک خود و تجارت خود در مورد تجارت خود قرار دهید.
TVSltd_algoindicators
Buy ETH Today to Double Tomorrow

همین امروز ETH را بخرید تا فردا دو برابر شود - فرصت سرمایه گذاری میان مدت سلام دوستان، دوباره Tradevietstock با شماست! Ethereum نزدیک به یک سال است که در یک روند ثابت گیر کرده و هیچ حرکت صعودی واقعی ندارد. دارندگان ETH از این حرکت جانبی خسته شده اند - و حق هم دارند. اما من معتقدم که لحظه مناسب بالاخره در حال نزدیک شدن است - و می تواند همه چیز را تغییر دهد. این فرصت پیش رو می تواند به شما این امکان را بدهد که سرمایه گذاری خود را دو برابر کنید و با سوار شدن بر موج بعدی major ETH سود قابل توجهی کسب کنید. ۱. بازارهای نزولی اخیر ETH از اواخر سال ۲۰۲۴، Ethereum نزدیک به ۷۰ درصد سقوط کرده و هیچ موج صعودی قابل توجهی در چشم نیست. این دوره به عنوان یکی از راکدترین و ناامیدکننده ترین مراحل تاریخ ETH شناخته می شود - یک بازار نزولی طولانی و طاقت فرسا که صبر حتی متعهدترین دارندگان را نیز آزمایش کرده است. با این حال، با وجود این یکنواختی و ناامیدی، من قویاً معتقدم که زمان مناسب در حال نزدیک شدن است. بازارها اغلب به صورت چرخهای حرکت می کنند و این نوع تثبیت عمیق و طولانی می تواند پیش درآمد یک صعود انفجاری باشد. بیایید به برخی از الگوهای تاریخی نگاهی بیندازیم تا ببینیم چه چیزی ممکن است در ادامه رخ دهد. در طول سال ۲۰۲۴، Ethereum یک بازار نزولی طولانی را تجربه کرد و تقریباً ۴۶ درصد از اوج خود سقوط کرد. برخلاف سقوطهای ناگهانی، این کاهش با یک روند نزولی آهسته و مداوم مشخص شد که به مرور زمان اعتماد به نفس را از بین برد. کندلهای نزولی در ابتدا شدید نبودند، اما فرسایش مداوم قیمت، این مرحله را برای دارندگان ETH دردناک کرد. این کاهش طولانی مدت است که واقعاً یک بازار نزولی را تعریف می کند - نه فقط عمق سقوط، بلکه مدت زمان و تلفات روانی آن. همانطور که اغلب اتفاق می افتد، مرحله نهایی سخت ترین بود: در اواخر سال ۲۰۲۴، ETH در یک روز بیش از ۱۰ درصد سقوط کرد، حرکتی تسلیم کننده که بسیاری اکنون آن را به عنوان کف بلندمدت خود می شناسند. پس از تحمل یک بازار نزولی طولانی و چندین کندل نزولی شدید، ETH سرانجام کف خود را تأیید کرد و تقریباً ۷۶ درصد جهش کرد. این یک الگوی کلاسیک است: وقتی اکثر مردم می ترسند، خسته می شوند یا تسلیم می شوند - این زمانی است که فرصت واقعی شروع می شود. این مرحله، که اغلب توسط اکثریت نادیده گرفته می شود، دقیقاً همان زمانی است که سرمایه گذاران باهوش خود را برای موج بعدی آماده می کنند. در سال ۲۰۲۲، Ethereum یکی از شدیدترین کاهش های خود را تجربه کرد و تقریباً ۸۰ درصد از اوج خود سقوط کرد. پس از سقوط اولیه حدود ۵۰ درصدی، ETH شاهد یک جهش کوتاه مدت بود - حدود ۵۰ درصد افزایش یافت - قبل از اینکه به روند نزولی خود ادامه دهد. پس از هر major کاهش، ما معمولاً به دنبال یک شکست صعودی به عنوان نشانه ای از شروع یک روند صعودی هستیم. جالب اینجاست که فرصتهای خرید قوی اغلب در نزدیکی شکستهای نزولی یافت میشوند - به خصوص زمانی که کندلهای نزولی شدید ظاهر میشوند، زیرا اغلب مرحله نهایی تسلیم را قبل از معکوس شدن نشان میدهند. برخی نمونهها از کندلهای نزولی شدید: ۲. سیگنال های ضروری برای خرید ETH اولاً، ما قطعاً به کندلهای شکست صعودی نیاز داریم تا پایان بازار نزولی و شروع یک روند صعودی را تأیید کنیم. ثانیاً، احتمالاً می توانیم انتظار داشته باشیم که یک کندل نزولی شدید درست قبل از شکست صعودی ظاهر شود. این حرکت شدید حتی می تواند حمایت اخیر در نزدیکی ۱,۳۷۸ دلار را بشکند و ترس شدیدی را در سراسر بازار و در جامعه ETH ایجاد کند. چنین رویدادهای تسلیم کننده ای قبل از معکوس شدن های major رایج است - آنها دست های ضعیف را بیرون می کشند و زمینه را برای یک شکست صعودی قوی فراهم می کنند. سیگنال من: موقعیت: خرید ورود: ۱۳۷۸-۱۶۷۵ هدف: ۴۱۰۰ سلب مسئولیت: این یک استراتژی سرمایه گذاری میان مدت است و برای معاملات کوتاه مدت در نظر گرفته نشده است. اگر معامله گر کوتاه مدت هستید، لطفاً این طرح را مطابق با مشخصات ریسک و سبک معاملاتی خود تطبیق دهید. همیشه مدیریت ریسک مناسب را برای محافظت از سرمایه خود در اولویت قرار دهید - اجازه ندهید یک معامله دلیلی برای از بین رفتن مجدد حساب شما باشد. می توانید کانال تلگرام و سایر منابع مرتبط در نمایه من را بررسی کنید. اگر از این محتوا لذت بردید، فراموش نکنید که دنبال کنید - مطالب بیشتری در راه است.
TVSltd_algoindicators
Buy ETH for Mid-Term Gains

خرید ETH برای دستاوردهای میان مدت: پتانسیل بالا با تخفیف قیمت همه ، این کار دوباره تجارت است! بازار در حال حاضر مطابق با شاخص ترس و حرص و طمع CNN ، در حال حاضر در حالت ترس شدید قرار دارد ، که اغلب نشانگر یک پایین بالقوه تاریخی در سراسر major دارایی های تجاری ، از جمله S&P 500 و بیت کوین یا حتی ETH است. اگرچه بازار از منطقه ترس شدید خارج شده است ، اما بهبودی هنوز هم متوسط و اخیر است - این بدان معنی است که هنوز زمان خود را برای قرار دادن خود وجود دارد! اگر هنوز دریغ کنید ، احتمالاً این فرصت را از دست داد. سیگنال هایی که ما باید یک گاو نر را تأیید کنیم: در اکتبر 2023 یک بازار بسیار مسطح و کسل کننده برای ETH وجود داشت - با این وجود ، یک شکست صعودی رخ داد ، و باعث یک حرکت قوی به سمت بالا و نشانگر شروع یک گاو نر جدید شد. بعد از این سیگنال ظاهر شد ، ETH دو برابر شد! Ethereum (ETH) از اواخر سال 2024 با تخفیف قابل توجهی معامله شده است - بیش از 66 ٪ نسبت به اوج قبلی. براساس شاخص کوانتومی Flux ، ETH به طور رسمی از مرحله بازار خرس خود خارج شده است ، همانطور که توسط سیگنال های خرید چندگانه (از جمله نقاط سبز و صلیب) مشهود است. این نتیجه گیری فاز 1 است: بازار خرس. برای سرمایه گذاران ، این یک فرصت rare برای خرید ETH در یکی از سنگین ترین سطح تخفیف دیده شده در تاریخ اخیر را نشان می دهد. پس از تجربه تصحیح 80 ٪ در سال 2022 ، ETH از آن زمان چندین سیگنال کلیدی را نشان داده است. ابتدا ، شاخص Quantum Flux سیگنال های خرید چندگانه (نقاط سبز و صلیب) را در انتهای فاز 1 (بازار خرس) نشان داده است. این نشان می دهد که ETH در یک منطقه پایین تاریخی قرار دارد. دوم ، ما شاهد شکستگی های صعودی هستیم - حرکات قیمتی دفع کننده که معکوس از روند نزولی اخیر را تأیید می کند. از هم اکنون ، ما اولین موج سیگنال ها را از Quantum Flux دریافت کرده ایم. سیگنال های من: موقعیت: منطقه BuyPrice: 1290-1700Target: 4000 PLEASE مدیریت ریسک خود را در اولویت قرار دهید. هیچ کس نمی تواند در این بازار زنده بماند و در طولانی مدت بدون مدیریت ریسک به پیروزی برسد.
TVSltd_algoindicators
JUP/USDT: New Crypto with 300% Upside Potential

Top 1 newly listed crypto to invest - Jupiter (JUP) – Is it worth your money? Hello folks, it's Tradevietstock again! As we move through 2025, the crypto market continues to be a rollercoaster of opportunities and risks. With so many projects out there, finding one with real value can feel like searching for a needle in a haystack. Today, I want to talk about Jupiter (JUP), a project that’s caught my attention as a potential investment this year, and I believe this is top 1 newly listed crypto to invest in this year.i. Overview ofJupiter (JUP) – The Top Decentralized Trading Platform on Solana1. What Is Jupiter?Jupiter is a DEX aggregator on the Solana blockchain that finds the best token swap prices across different liquidity sources (DEXs, pools, market makers). It also offers advanced DeFi tools like:Limit Orders: Buy/sell at specific prices automaticallyDCA/TWAP: Reduce volatility risk by spreading trades over timeBridge Comparator: Find the cheapest route to move assets across blockchainsPerpetuals Trading: Trade futures with leverage=> With over 1.35 billion JUP tokens in circulation and community governance, Jupiter is a vital infrastructure player in the Solana DeFi ecosystem.2. 💡 Why Jupiter MattersDecentralized, Efficient TradingAggregates liquidity for best prices & low slippageYou stay in control of your crypto – no middlemanCross-Chain TransfersEasily bridge assets between Solana, Ethereum, and othersPro-Level Trading ToolsLimit orders and DCA/TWAP help both beginners and prosPerpetuals offer advanced trading strategiesReal-World IntegrationSOL-based debit card (via Sanctum) makes crypto spendable in daily lifeBoosts Solana EcosystemJupiter provides liquidity for other DeFi apps, supporting growth3. ✅ Is Jupiter Legit?Yes. Jupiter tackles real DeFi problems:Liquidity fragmentation → Solved with aggregationHigh fees → Solana keeps transactions under $0.01Blockchain silos → Bridge Comparator fixes interoperabilityReal-world usage → Debit card bridges crypto and financeCommunity governance → Token holders vote on proposalsEvents like Jupuary airdrops and a 30% token burn in Jan 2025 show strong user focus.4. 📈 Why JUP Could Be a Top InvestmentSolana’s rise: Fast, cheap, and gaining adoptionDeFi growth: More users + institutions entering the spaceJupiter innovation: Advanced tools, debit card, growing dev supportBullish market trends: 2025 shows signs of crypto recoveryRisks include:Market volatilitySolana TVL dipsCompetition from other DEXs (like Uniswap, Layer 2s)Still, Jupiter’s real-world use cases and solid roadmap make it one of the top newly listed tokens to watch in 2025.5. 🔧 Technology HighlightsBuilt on Solana: 65,000 TPS, <$0.01 feesProof of History + Proof of Stake for speed & securitySmart Contracts automate trades, strategies, and bridging6. Who’s Behind Jupiter? The Team Driving the ProjectJupiter was founded by a team with the right mix of skills to make it a success:Fabiano Solana: The tech expert, responsible for Jupiter’s blockchain infrastructure and ensuring the platform runs smoothly.Rolex Gold: A financial markets veteran, guiding Jupiter’s strategy and positioning it to meet the needs of traders.Mei: Focuses on community engagement and partnerships, helping Jupiter grow its user base and ecosystem.Meow: Played a key role in launching and managing the JUP token, though there have been some minor controversies around partnerships.Before moving on, I will explain some key terms in the image above: Team Tokens: This refers to the portion of tokens allocated to the team behind the project. These tokens are usually subject to certain vesting schedules to ensure that team members are incentivized to remain involved in the project over time.Mercurial Holders: This refers to the percentage of tokens allocated to holders of the Mercurial token, which could be part of a partnership or incentive program.Jupary: This might be referring to a group or entity related to the Jupiter ecosystem. It's likely a token allocation meant for contributors or important stakeholders associated with the Jupary initiative.Community Reserve: These tokens are set aside for the community, often used for future incentives or governance purposes, ensuring the community has a stake in the project's success.Strategic Reserve: These tokens are held for strategic purposes, like partnerships, future fundraising rounds, or to stabilize the market if needed.DAO Funding: Tokens allocated to the Decentralized Autonomous Organization (DAO), which is responsible for decision-making within the project. These tokens could be used for funding the DAO’s activities or decisions.Jup LFG Fee: Likely refers to a fee associated with the Jupiter Liquidity Fund Generation (LFG) program, which may involve creating liquidity for the project or incentivizing liquidity providers.MM Loans (CEX): This represents tokens allocated for market-making (MM) loans in centralized exchanges (CEX), which are used to maintain liquidity and facilitate trading on exchange platforms.Immediate LP Needs: Tokens set aside to meet immediate liquidity pool (LP) requirements, helping to ensure that there is enough liquidity available for trading on decentralized exchanges (DEX).Launch Pool: These tokens are part of the pool used for launching the project, often to facilitate the early stages of a token's distribution or public sales.Initial Airdrop: These tokens are distributed via an airdrop, which is a common way of giving free tokens to early adopters, participants, or holders to promote the project.Currently, the proportion of team tokens is 20% of the total supply of JUP. After one month, the team will receive a fixed amount of JUP worth $20 million. The total the team will receive will be worth $735.57 million in 2027. Just to clarify, the total supply of JUP is 10 billion.The team's total share will be 14% of the total supply of JUP, which is not a significant concern for price manipulation. The total tokens allocated to Jupary will make up over 14% of the total supply, and these will then be distributed to staking holders.However, one scenario to consider is that after the team receives the full amount of their tokens, they could potentially dump the project and liquidate. Yet, this will only happen in 2027, and the project is not designed to solve real-life problems. Despite this, I believe JUP is not likely to follow such a path.ii. Investment analysis - Top 1 newly listed crypto to invest1. Price chartJupiter is one of the recently listed tokens, and its price is still near the bottom, which I believe it should be included in the list of top 1 newly listed crypto to investLet’s move on to some technical analysis. The JUP price has reached its historical bottom at around 0.49 USDT. There has been no breakout below the ATR Bands, which indicates there are no bearish signals or a bearish trend expected in the near future. According to the Quantum indicator, there are some early crossover signals (green dots), suggesting that the bearish trend is coming to an end.Still, we need to wait a little longer before buying JUP. So, what exact signals from the indicators should we look for before buying JUP? I’d say we need confirmation of the bottom from the Quantum indicator and a breakout above the ATR Band. This will give us a clear set of confirmation signals.=> Although I say Jupiter is the top 1 newly listed crypto to invest, when investing in this token, we should treat it as a long-term investment, as tokens priced below $1 tend to experience significant fluctuations. Therefore, when buying JUP on Spot, we should consider staking it to receive a decent APR.2. Conclusion: Is Jupiter a Good Investment?After digging into Jupiter (JUP) in this Top 1 newly listed crypto to invest article, I can say it’s a strong contender for your crypto portfolio. It’s solving real problems in DeFi—like liquidity fragmentation, high fees, and blockchain isolation—while adding practical features like the SOL-based debit card that make crypto usable in everyday life. The technology is solid, leveraging Solana’s speed and low costs to deliver a seamless DeFi experience. The team behind it has the expertise and commitment to keep the project on track, and the growth potential is there, especially with Solana’s momentum and DeFi’s broader expansion.Of course, there are risks to consider. The crypto market is volatile, and Jupiter faces competition from other DEXs. Solana’s recent TVL drop could also impact its ecosystem. But with its focus on utility, innovation, and community engagement, Jupiter stands out as a project with real substance—not just another hyped-up token. If you’re looking for a crypto with strong fundamentals and upside potential, Jupiter is worth adding to your Top 1 newly listed crypto to invest list.
TVSltd_algoindicators
When to Sell GOLD?? When will Gold STOP RISING?

چه زمانی افزایش قیمت طلا متوقف شد؟ - چه زمانی طلا را بفروشیم و شروع به سرمایه گذاری در دارایی های دیگر کنیمسلام به همه، Tradevietstock دوباره برگشته! امروز، بعد از یک دوره hot در قیمت طلا، وارد سرمایه گذاری در طلا می شویم، در حالی که همه در رسانه ها در مورد آن صحبت می کنند. حتی برخی اطلاعات و شایعات غیررسمی ادعا می کنند که طلا می تواند به 6000 دلار در هر اونس برسد. اما چه چیزی data نشان می دهد که قیمت طلا به طور چشمگیری به افزایش خود ادامه داد، شاید حتی دو برابر شود؟ و مهمتر از آن، چه زمانی افزایش قیمت طلا متوقف شد؟ و زمان دقیق فروش آن و برداشت سود چه زمانی است؟ بیایید data را در زیر تجزیه و تحلیل کنیم.دیدگاه ما در Tradevietstock این است که طلا به این شکل به صعود خود ادامه داد. در عوض، اکنون زمان آن است که به دنبال فرصت هایی برای فروش با بهترین قیمت باشیم. FOMO (ترس از دست دادن) در این مرحله، تعقیب طلا در اوج خود، می تواند منجر به خسارات قابل توجهی شود، به خصوص اگر یک سفته باز کوتاه مدت هستید.با نگاهی به حرکات اخیر، XAUUSD برای سه جلسه متوالی افزایش یافته است، هر کدام حدود 3٪. به نظر من، این نشان دهنده FOMO قوی در بازار طلا است - نشانه خوبی برای خریداران جدید نیست.الف. تاریخچه قیمت طلا1. Data تاریخی از سال 1970طلا در گذشته شاهد جهش های قابل توجهی بوده است، مشابه افزایش اخیر. در زیر خلاصه ای از تاریخچه قیمت طلا از سال 1987 تا به امروز ارائه شده است که دوره های افزایش متوالی قوی و سایر معیارهای کلیدی را برجسته می کند.2. زمینه تاریخی در لحظات کلیدینتایج=> همانطور که از رویدادهای فوق می بینیم، طلا تمایل دارد در دوره های بی ثباتی مالی و تنش های ژئوپلیتیکی افزایش یابد. با این حال، از سال 2022 تا کنون، قیمت طلا تقریباً دو برابر شده است و تمام اخبار منفی اقتصاد کلان در قیمت ها لحاظ شده است. بنابراین، چه زمانی افزایش قیمت طلا متوقف شد و چه زمانی آن را بفروشیم؟ب. Data احتمالات1. آمار کمی در زیر مقایسه آماری از قیمت های طلای XAUUSD با حرکات قیمتی قوی مشابه مشاهده شده در آوریل 2025 آورده شده است:با نگاهی به داده ها، می بینیم که قیمت طلا به طور کلی از جلسه 30 به بعد کاهش می یابد، پس از تجربه افزایش 3 درصدی در هر جلسه. جلسه 30 از 9 آوریل 2025 آغاز می شود. علاوه بر این، از سال 2024، طلا بیش از 60 درصد افزایش یافته است.2. نتایج احتمال بر اساس محاسبات احتمال از 9 آوریل 2025، فرصت خرید موقعیت های جدید در XAUUSD عملاً از بین رفته است. پس از جلسات 10 و 30، دیگر توصیه نمی شود وارد موقعیت های جدید شوید. در عوض، زمان آن رسیده است که به دنبال موقعیت های فروش یا قفل کردن سود باشید.=> از زمان شروع چرخه، طلا برای 213 جلسه متوالی انباشته شده است، در حالی که میانگین دوره انباشت برای XAUUSD حدود 290 جلسه است. این بسیار نزدیک است. هرچه فاز انباشت طولانی تر باشد، افزایش قیمت پس از آن قوی تر بود. با این حال، ما قبلاً شاهد افزایش قابل توجهی در قیمت طلا بوده ایم، به این معنی که بیشتر سودهای بالقوه قبلاً در قیمت ها لحاظ شده است.3. چه سیگنال هایی تأیید می کنند که قیمت طلا به شدت کاهش یافت؟چه زمانی افزایش قیمت طلا متوقف شد و چه زمانی باید آن را بفروشیم؟ پاسخ ساده است: ما به سیگنال های تأیید واضح از XAUUSD نیاز داریم. در این حالت، سیگنال یک کاهش شدید 5 درصدی در یک جلسه واحد بود. بر اساس احتمال آماری و داده های تاریخی، چنین کاهش های 5 درصدی از نظر تاریخی شروع یک بازار نزولی برای طلا را تأیید کرده اند، به این معنی که قیمت ها یا کاهش می یابند یا برای مدت طولانی ثابت می مانند.کاهش قابل توجه 5 درصدی در 15 مه 2006 رخ داد، زمانی که طلا قبلاً در یک دوره حدود 246 جلسه حدود 55 درصد افزایش یافته بود. نتیجه این بود که قیمت طلا در 30 جلسه بعدی حدود 14 درصد کاهش یافت.مثال دیگری از زمان فروش در 4 دسامبر 2009 رخ داد، زمانی که طلا پس از سود قبلی 24 درصدی در 144 جلسه متوالی، کاهش 4 درصدی را تجربه کرد. از آنجایی که سود قبلی فوق العاده قوی نبود، XAUUSD تنها در 50 جلسه بعدی حدود 6 درصد کاهش یافت.از این مثال ها می توان نتیجه گرفت که طلا تمایل دارد پس از یک چرخه انباشت حدود 200 جلسه یا بیشتر، به شدت افزایش یابد و پس از آن افزایش قیمت 50 درصد یا بالاتر داشته باشد. هرچه افزایش قبلی قوی تر باشد، کاهش پس از آن بیشتر بود، معمولاً حدود 14-15 درصد.4. Data از احساسات طلاچه زمانی افزایش قیمت طلا متوقف شد؟ چه زمانی باید طلا را بفروشید؟ بر اساس data احساسات طلا از MacroMicro، واضح است که با افزایش شاخص انتشار نظرسنجی، قیمت طلا تمایل به افزایش دارد. برعکس، وقتی این شاخص کاهش می یابد، قیمت طلا وارد فاز اصلاحی می شود و منجر به دوره ای از رکود می شود.در حال حاضر، شاخص انتشار نظرسنجی از حدود مارس 2025 در حال کاهش است. بنابراین چه زمانی افزایش قیمت طلا متوقف شد؟ این نشان می دهد که قیمت طلا ممکن است به زودی به پایان چرخه صعودی خود برسد. با این حال، از آنجایی که این یک شاخص تاخیری است، فروش یا قفل کردن سود مستلزم در نظر گرفتن عوامل اضافی است.ج. نتیجه گیریبنابراین، چه زمانی افزایش قیمت طلا متوقف شد و چه زمانی باید آن را بفروشیم؟ آیا قیمت به 6000 دلار در هر اونس رسید؟ بر اساس تجزیه و تحلیل ما، زمان مناسب برای فروش یا قفل کردن سود زمانی است که یک کاهش 5 درصدی در یک جلسه واحد رخ دهد. این نتیجه گیری بر اساس داده ها است، نه گمانه زنی. بعید است قیمت طلا در آینده نزدیک به 6000 دلار در هر اونس hit برسد و احتمالاً نیاز به گذراندن چرخه دیگری با دوره انباشت متوسط 200 جلسه دارد. هدف قیمت برای برداشت سود می تواند حدود 3600 دلار آمریکا باشد.امیدوارم اطلاعات موجود در این مقاله چه زمانی افزایش قیمت طلا متوقف شد به شما کمک کند تا سفر سرمایه گذاری خود را به آرامی و با اطمینان بیشتری آغاز کنید. با آرزوی سرمایه گذاری موفق و سودآوری برای همه!
TVSltd_algoindicators
When to Sell GOLD?? When will Gold STOP RISING?

When will gold stop rising - When to sell gold and start investing in other assetsHey everyone, Tradevietstock is back again! Today, I’m diving into gold investing after a hot streak in gold prices, with everyone in the media talking about it. There’s even some unofficial info and rumors claiming gold could reach 6,000USD per ounce. But what data shows that gold prices will continue to rise dramatically, maybe even double? And, more importantly, when will gold stop rising? And what is the exact time to sell it and take profit? Let’s break down the data below.Our view at Tradevietstock is that gold won’t keep climbing like that. Instead, this is the time to look for opportunities to sell at the best price. FOMO (fear of missing out) at this point, chasing gold at its peak, can lead to significant losses, especially if you’re a short-term speculator.Looking at recent movements, XAUUSD has surged for three consecutive sessions, each by around 3%. To me, this signals strong FOMO in the gold market—not a good sign for new buyers.i. Gold Price History1. Historical Data from 1970Gold has seen significant spikes in the past, similar to the recent surge. Below is a summary of gold price history from 1987 to present, highlighting periods of strong consecutive increases and other key benchmarks.2. The historical context at key moments=> As we can see from the events above, gold tends to rise during periods of financial instability and geopolitical tension. However, from 2022 to now, gold prices have almost doubled, and all macroeconomic negative news has been priced in. So, when will gold stop rising and when to sell it?ii. Probability Data1. Quantitative StatisticsBelow is a statistical comparison of XAUUSD gold prices with similar strong price movements observed in April 2025:Looking at the data, we can see that gold prices generally decrease from the 30th session onward, after experiencing a 3% increase each session. The 30th session begins on April 9, 2025. Additionally, since 2024, gold has increased by more than 60%.2. Probability ResultsBased on probability calculations from April 9, 2025, the opportunity to buy new positions in XAUUSD is virtually gone. After the 10th and 30th sessions, it's no longer advisable to enter new positions. Instead, it's time to look for sell positions or lock in profits.=> Since the cycle began, gold has accumulated for 213 consecutive sessions, while the average accumulation period for XAUUSD is about 290 sessions. This is quite close. The longer the accumulation phase, the stronger the price increase afterward. However, we’ve already seen a significant rise in gold prices, meaning most of the potential gains have already been priced in.3. What Signals Confirm That Gold Prices Will Drop Sharply?When will gold stop rising and when should we sell it? The answer is simple: we need clear confirmation signals from XAUUSD. In this case, the signal would be a sharp 5% decline in a single session. Based on statistical probability and historical data, such 5% declines have historically confirmed the start of a bear market for gold, meaning prices will either decrease or remain stagnant for an extended period.A notable 5% drop occurred on May 15, 2006, when gold had previously surged by approximately 55% over a period of about 246 sessions. The outcome was that gold prices dropped by around 14% in the next 30 sessions.Another example of when to sell occurred on December 4, 2009, when gold experienced a 4% decline after a previous gain of 24% over 144 consecutive sessions. Since the prior gain wasn’t exceptionally strong, XAUUSD only dropped around 6% in the following 50 sessions.From these examples, we can conclude that gold tends to rise sharply after an accumulation cycle of about 200 sessions or more, with subsequent price increases of 50% or higher. The stronger the previous rise, the larger the drop afterward, typically around 14-15%.4. Data from Gold SentimentWhen will gold stop rising? When should you sell gold? Based on the Gold Sentiment data from MacroMicro, it’s clear that as the Survey Diffusion Index increases, gold prices tend to rise. Conversely, when this index decreases, gold prices enter a correction phase, leading to a period of stagnation.Currently, the Survey Diffusion Index has been declining since around March 2025. So when will gold stop rising? This suggests that the gold price may soon reach the end of its upward cycle. However, since this is a lagging indicator, selling or locking in profits requires considering additional factors.iii. ConclusionSo, when will gold stop rising and when should you sell it? Will the price reach 6,000USD per ounce? According to our analysis, the right time to sell or lock in profits is when a 5% drop occurs in a single session. This conclusion is based on data, not speculation. Gold prices are unlikely to hit 6,000USD per ounce in the near future and will likely need to go through another cycle with an average accumulation period of 200 sessions. The price target to take profit could be around 3,600USDI hope that the information in this When will gold stop rising article will help you begin your investment journey smoothly and with more confidence. Wishing everyone successful investments and profits!
TVSltd_algoindicators
Bitcoin Mid-Term Investment Signals: A Strong Buying Opportunity

سلام به همه، دوباره ترید ویتنام استاک هستم! طبق شاخص ترس و طمع سیانان، بازار در حال حاضر در وضعیت ترس شدیدی قرار دارد، که اغلب نشاندهنده یک کف تاریخی بالقوه در سراسر major دارایی معاملاتی، از جمله S&P 500 و Bitcoin است. علاوه بر این، BTC ورودی به آدرسهای انباشت به اوج خود میرسد، که به این معنی است که خریداران بزرگ بیشتری وارد بازار میشوند. طبق مدل کوانتومی Flux من، ما در حال حاضر شاهد پایان فاز 1 برای بیت کوین هستیم، زیرا حدود 30٪ تخفیف خورده است - که معمولاً نشان دهنده پایان یک چرخه نزولی است. این مدل سیگنالهای ورود را نشان میدهد و پیشنهاد میکند که ما در آستانه یک موج صعودی جدید هستیم. بر اساس این، توصیه میکنم ورود به منطقه قیمت فعلی را در نظر بگیرید. هدف آینده برای BTC همچنان در حدود اوجهای قبلی خود - تقریباً 100000 دلار - باقی میماند. با نگاهی به گذشته، ما دقیقاً همان تنظیمات را در دوره ترس شدید ژوئن 2021 مشاهده کردیم. در آن زمان، مدل کوانتومی Flux نیز پایان فاز 1 را نشان داد و اندکی پس از آن، Bitcoin به بالاترین حد خود رسید. اکنون شاهد ظهور الگوهای مشابهی هستیم که معتقدم فرصت سرمایه گذاری میان مدت قانع کننده ای را ارائه می دهد. سیگنال های من: موقعیت ها: خرید، برداشت سود: 100 هزار دلار. این یک سرمایه گذاری میان مدت است. لطفا به هر major سیگنال و مدیریت ریسک خود توجه داشته باشید.
TVSltd_algoindicators
Bitcoin Mid-term investing signals: BUY BTCUSDT
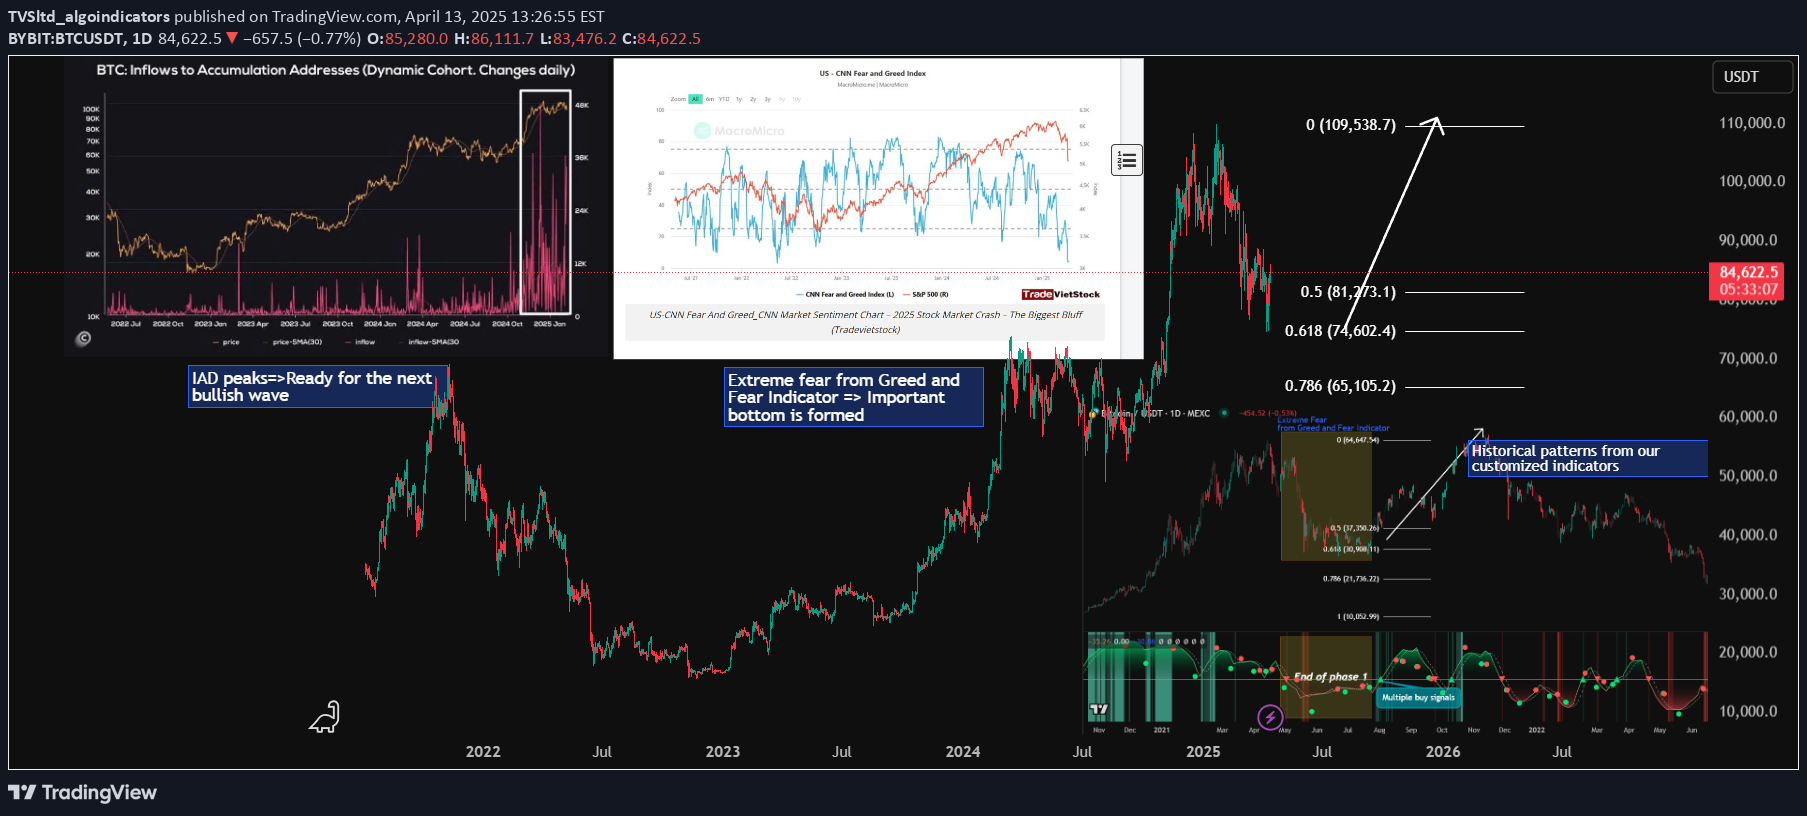
به روز رسانی تحلیل بازارسلام به همه، باز هم Tradevietstock هستم!در حال حاضر بازار در وضعیت ترس شدیدی قرار دارد که اغلب نشان دهنده یک کف تاریخی بالقوه در سراسر major دارایی معاملاتی، از جمله S&P 500 و Bitcoin است.بر اساس مدل کوانتومی Flux من، ما اکنون شاهد پایان فاز 1 برای Bitcoin هستیم - که معمولاً نشان دهنده پایان یک چرخه نزولی است. این مدل سیگنالهای ورود را نشان میدهد و حاکی از آن است که ما در آستانه یک موج صعودی جدید قرار داریم. بر این اساس، من توصیه می کنم ورود به محدوده قیمت فعلی را در نظر بگیرید.هدف آینده برای BTC همچنان در حدود بالاترین سطح قبلی خود - تقریباً 100000 دلار است. با نگاهی به گذشته، ما دقیقاً همان الگو را در دوره ترس شدید ژوئن 2021 مشاهده کردیم. در آن زمان، کوانتوم Flux نیز پایان فاز 1 را نشان داد و اندکی پس از آن، Bitcoin به بالاترین حد خود رسید.ما اکنون شاهد ظهور الگوهای یکسانی هستیم که به نظر من یک فرصت سرمایه گذاری میان مدت قانع کننده را ارائه می دهد.شما می توانید از انجمن تلگرامی تازه تاسیس ما در اینجا بازدید کنید. ما تحلیل های بنیادی و algo معاملاتی را به اشتراک می گذاریم!
سلب مسئولیت
هر محتوا و مطالب مندرج در سایت و کانالهای رسمی ارتباطی سهمتو، جمعبندی نظرات و تحلیلهای شخصی و غیر تعهد آور بوده و هیچگونه توصیهای مبنی بر خرید، فروش، ورود و یا خروج از بازارهای مالی نمی باشد. همچنین کلیه اخبار و تحلیلهای مندرج در سایت و کانالها، صرفا بازنشر اطلاعات از منابع رسمی و غیر رسمی داخلی و خارجی است و بدیهی است استفاده کنندگان محتوای مذکور، مسئول پیگیری و حصول اطمینان از اصالت و درستی مطالب هستند. از این رو ضمن سلب مسئولیت اعلام میدارد مسئولیت هرنوع تصمیم گیری و اقدام و سود و زیان احتمالی در بازار سرمایه و ارز دیجیتال، با شخص معامله گر است.